

DP-500 Table of contents
In one of the previous articles, we’ve already covered how to identify data loading bottlenecks in Power BI. Now that you know how to identify the most common issues, it’s time to learn how to fix them.
Just to make it clear at the very beginning – it’s absolutely impossible to cover all performance optimization techniques in one article! There are books, whitepapers, and courses examining various aspects of performance optimization. I’m also delivering a full-day workshop on Power BI performance optimization, so don’t expect to read this article and become a “performance tuning master” all of a sudden:)

It’s usually a painful process, and fixing one issue may sometimes simply reveal another one in the background. It’s also an iterative process – meaning, once you resolved a problem, it doesn’t necessarily mean that your job is done and that the problem will not pop up again. Once the data begin to scale, or your data model becomes more complex, get ready to pull up your sleeves again…
However, don’t be scared off – I have two good news for you:
- Identifying a problematic area in your Power BI solution is PROBABLY the most important step in troubleshooting a poorly performing solution. That’s because once you identify the root cause of the problem, you can focus on solving a specific issue and narrow down the options for performance optimization
- More often than not, solving one specific issue will also have a positive impact on other potential bottlenecks. Let me briefly explain this point: let’s say that your report renders slow for the end user. One of the potential reasons may be that your data model size is very large, so the engine needs to scan huge amounts of data for the report calculations. If you reduce the size of the model, chances are that the report will also render faster, although you haven’t changed the calculation itself
Since the exam topic covers performance tuning of Power Query and data sources, I won’t be examining slow-rendering visuals or poor-performing DAX queries. Sure, you should definitely learn and understand these areas as well, but this article will focus on improving the “backend” stuff.
And, there are at least three potential pain-points in the backend part of Power BI:
- Data model
- Power BI on-premises data gateway
- Data refresh process
So, let’s start with the obvious…
Or, is it obvious? Two principles that I advise EVERYONE (literally everyone) to grasp when working with Power BI are:
- Star-schema all the way!
- “Roche’s Maxim” of data transformation
Let’s quickly explain both, because understanding these principles will possibly have a huge impact on all the potential downstream issues.
Star schema all the way!
Back to basics, for those of you who maybe don’t know, I’ll try to explain what a star-schema is – first of all, this is a well-established data modeling concept that’s been around for decades (many years before Power BI). In a nutshell, all of the tables in the data model should be classified either as dimensions (answer the questions starting with “W”: who, what, where, when) or facts (usually, answers the question: how much, but can also store the information about certain events).

In any case, understanding the ins and outs of dimensional modeling is, in my humble opinion, a MUST for every serious Power BI professional, so I strongly suggest spending time learning about the concept of star-schema and other Power BI data modeling concepts. My friend Tom Martens and I wrote a whole series on data modeling for Power BI, so maybe you should want to check that out.
My two go-to resources for learning about dimensional modeling are two books: “Star schema – complete reference” by Christopher Adamson, and the so-called dimensional modeling bible “The Data Warehouse Toolkit” by Ralph Kimball and Margy Ross.
Now, star-schema relevance for Power BI…Well, Power BI “loves” star schema and works best when you model your data like a star (I “borrowed” this phrase from my friend Markus Ehrenmüller-Jensen and his great session on the topic). This phrase best describes the “love story” between Power BI and star-schema – if you model your data to be star-schema, you’ll be a real data modeling star:). Finally, if you don’t trust Markus and me (and many other proven Power BI experts, by the way), Microsoft explains in this article why you should always strive to implement a star-schema design.
Roche’s Maxim of data transformation
“Data should be transformed as far upstream as possible, and as far downstream as necessary.“…Another proof that brilliance is usually tightly coupled with simplicity. Roche is Matthew Roche from Microsoft’s Power BI CAT team and his maxim is one of the universal truths to be applied when designing Power BI solutions for performance and scalability.
To “translate” it into simple words: if you have a chance to perform transformations directly on the data source – do it! If not, then use Power Query. Why does this matter? Well, by pushing transformations upstream, you are shaping the data in advance (who said star-schema), thus reducing the work that has to be done by Power BI itself! Not only that, the performance of the VertiPaq engine is largely dependent on the data compression – and DAX calculated columns should be used as a last station for data transformation, because they are not optimally compressed.
Keep this maxim always in mind and your future “you” will be very grateful for that:)
Reducing the data model size
As you may assume, reducing the overall data model size will help the engine perform better. Don’t forget, the blazing fast speed of VertiPaq is based on keeping the data in cache memory – consequentially, the smaller the memory footprint, the faster it will be!
I’ll give you a simple analogy: let’s imagine that you’re searching for a book in your old attic. What do you think? Will it be faster to find it if your attic has just a few items around, or if it’s full of all kinds of stuff? I’m sure you know the answer…

General rules for reducing data model size
To conclude, here is the list of general rules you should keep in mind when trying to reduce the data model size:
- Keep only those columns your users need in the report! Just sticking with this one single rule will save you an unbelievable amount of space, I assure you…
- Try to optimize column cardinality whenever possible. The golden rule here is: test, test, test…and if there is a significant benefit from, for example, splitting one column into two, or substituting a decimal column with two whole number columns, then do it! But, also keep in mind that your measures need to be rewritten to handle those structural changes, in order to display expected results. So, if your table is not big, or if you have to rewrite hundreds of measures, maybe it’s not worth splitting the column. As I said, it depends on your specific scenario, and you should carefully evaluate which solution makes more sense
- Same as for columns, keep only those rows you need: for example, maybe you don’t need to import data from the last 10 years, but only 5! That will also reduce your data model size. Talk to your users, and ask them what they really need, before blindly putting everything inside your data model
- Aggregate your data whenever possible! That means – fewer rows, lower cardinality, so all nice things we are aiming to achieve! If you don’t need hours, minutes, or seconds level of granularity, don’t import them! Aggregations in Power BI (and the Tabular model in general) are a very important and wide topic, which is out of the scope of this article, but I strongly recommend you understand this concept properly
- Avoid using DAX calculated columns whenever possible, since they are not being optimally compressed. Instead, try to push all calculations to a data source (SQL database for example) or perform them using the Power Query editor (Roche’s Maxim to the rescue)
- Use proper data types (for example, if your data granularity is on a day level, there is no need to use Date/Time data type. Date data type will be completely fine)
- Disable the Auto Date/Time option for data loading, as this will remove a bunch of automatically created date tables in the background
Data gateway recommended practices
I’ll cover on-premises data gateway in more depth in one of the next articles. Here, just to provide you with a high-level understanding: the on-premises data gateway provides a secure communication medium between the company’s on-prem data sources and various Microsoft cloud services. So, Power BI is just one of these cloud services that leverage on-premises data gateway. A gateway can work in two modes: Standard (enterprise) and Personal. From now on, we will examine Standard mode only.
One of the biggest misconceptions about the data gateway is that it’s being used just as a medium for checking credentials and establishing a secure connection between data sources and Power BI Service. Gateway is MUCH MORE than that!
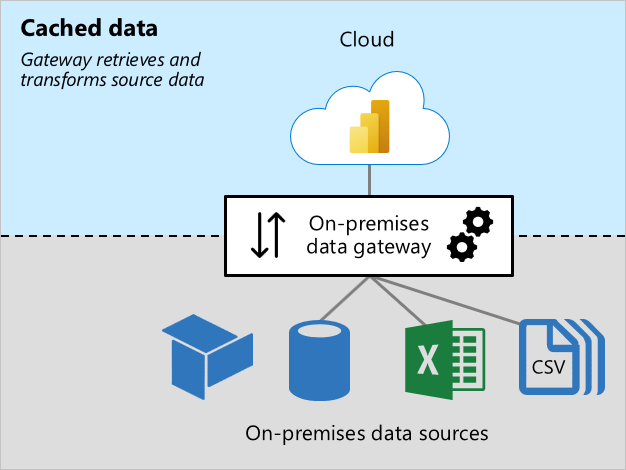
First of all, the gateway machine hosts Power Query’s Mashup engine. This means, all Power Query transformations are performed on the gateway machine. Not only that – keep in mind that the gateway isn’t sending the data back to Power BI Service as the data is coming. In fact, the gateway will wait until the whole data that’s required by the Power BI query is ready, so it will store the data on the disk in temporary cache files in a process called spooling. Therefore, one of the key considerations when configuring a gateway machine is: how much disk space do you need? Not only how much, but also which disk type – the recommended practice is to use SSD for the spooling storage.
Here is the list of the general recommended practices for improving the data gateway performance:
- Keep data sources and gateways as close as possible – the gateway machine should be located physically close to data sources, as this will reduce the latency when data is being transferred
- Keep the gateway machine only for that purpose – this means, avoiding running other applications on the gateway
- Separate gateways for Scheduled Refresh vs DirectQuery – in a nutshell, these two operations put completely different workloads on the gateway, so it’s easier to plan and scale gateway configuration if you assign a separate machine for each of these workloads
- Allocate enough disk space and use SSD – as already explained, the gateway will use spooling to gather all the data requested by the Power BI query, so it’s of paramount importance to prevent this part of the process from becoming a bottleneck
Finding the right configuration for the on-premises data gateway is one of those challenges where you need to find that “sweet point” relevant to your specific workloads. So, there is no single “golden” rule, but you need to ask yourself (or someone responsible for configuring the data gateway) the following questions: How much data will be transferred during the data refresh? How many datasets will be refreshed concurrently? How complex are transformations used in the queries? How many users will target data sources using DirectQuery storage mode?
Once you “answer” these questions and configure the gateway, the next step is monitoring the gateway performance. Depending on the findings, you may need to adjust some of the settings.
You may also decide to scale up (add more resources to a single gateway machine) or scale out (create a cluster of gateways) data gateway, but these considerations will be covered in more detail in a separate article.
Performance tuning of the data refresh process
Before you proceed with this article, I strongly suggest you first read my previous article on identifying potential bottlenecks in the data refreshing process. Then, download Phil Seamark’s template for visualizing the data refresh process to quickly understand what is going on during the data refresh.
The key “ingredient” for the optimal data refresh process is the query folding feature. I’ve already written a 3-part series of blog posts on this topic, explaining what is query folding and why should you always strive to achieve it.
Based on that if your query folds or not, you may want to fine-tune some additional things to optimize the data refresh process.
If your query partially folds, check the transformation steps and, in case you need to keep the step that breaks the query folding, push it down the transformation pipeline as much as possible.
One more thing to keep in mind: whenever you refresh a dataset, each table is being refreshed within its own evaluation “box”. In Power BI Desktop, each of these “boxes” is by default allocated 432 MB of physical memory. If the “box” requires more than that, the data will be “spilled” to the disk, which may significantly slow down the data refresh process.
You can adjust this default setup within the Options in Power BI Desktop:

The other property, Max number of simultaneous evaluations, refers to the number of logical cores available on the machine running Power BI Desktop. It’s usually not a good idea to increase the number of this value, as having too many “boxes” executing in parallel can slow down the overall performance.
Also, keep in mind that you can’t use any user interface option to manually adjust this value for Power BI Premium, as this is handled by Microsoft, depending on the SKU your organization purchased. However, you can leverage the XMLA endpoint and execute the TMSL script to override the setting of how many tables/partitions can be processed in parallel. But, being able to do something doesn’t necessarily mean that you SHOULD do it:) Please, carefully evaluate if this option will bring benefit in the final outcome.
Leverage Incremental refresh for large tables
Sometimes, your data refresh process may take a while, even though the query folding is in place. It’s quite obvious with very large datasets. So, what can we do if the query folds, but we still need to wait long for the data refresh to complete?
We can take advantage of the incremental refresh feature!
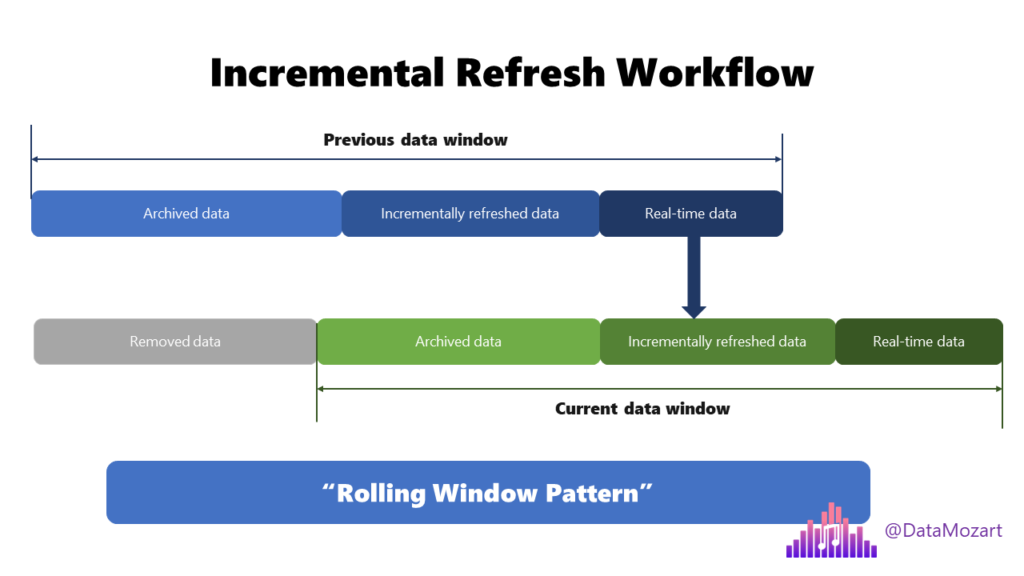
I’ve already described how to implement and configure incremental refresh in Power BI. Essentially, instead of refreshing the whole giant table each and every time, we can check and refresh only the smaller part of that table. This may have a significant impact on the data refresh process!
Going above and beyond with table partitioning in Power BI Premium
Table partitioning concept is just a more “sophisticated” version of the incremental refresh. While with incremental refresh Power BI will automatically partition your data into two parts (the one that is not refreshed and the other that is refreshed), with custom table partitioning you have more granular control over how your data is distributed and processed!
The main benefit of this approach is that you can then decide which partition(s) you want to refresh and at which cadence. This is enabled by using XMLA endpoints, so you can leverage some of the external tools, such as Tabular Editor or SSMS, to perform these tasks.
Bonus resource for Power BI report performance tuning
Ok, we’ve covered from a high-level perspective, the most common “backend” areas for performance troubleshooting. However, I prepared a bonus resource for you. This is my “Performance Tuning Cheatsheet”, that may help you decide which path to take depending on the problem you identified in your Power BI solution.
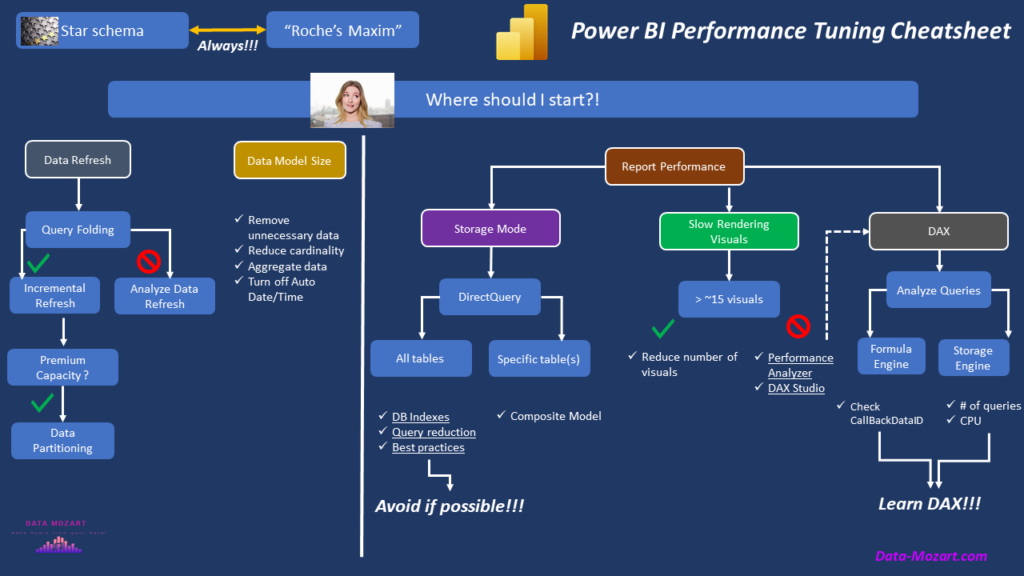
You can download a pdf version of the cheatsheet here.
Conclusion
Mastering Power BI performance tuning is both science and art! Don’t forget, the longest journey starts with a single step. Therefore, make sure that this first step is always identifying the main bottleneck in your Power BI solution. If you identify that the issue is below the surface (meaning, it’s not strictly related to slow report rendering), there are multiple concepts and techniques that you should learn and understand, so you can determine which to use in specific scenarios.
Keep in mind that performance tuning is usually a complex and iterative process, and, as such, requires a thorough understanding of the various platform components and features.
Thanks for reading!
Last Updated on January 24, 2023 by Nikola


