

By introducing Azure Synapse Analytics in late 2019, Microsoft created a whole new perspective when it comes to data treatment. Some core concepts, such as traditional data warehousing, came under more scrutiny, while various fresh approaches started to pop up after data nerds became aware of the new capabilities that Synapse brought to the table.
Not that Synapse made a strong impact on data ingestion, transformation, and storage options only – it also offered a whole new set of possibilities for data serving and visualization!
Therefore, in this series of blog posts, I will try to explore how Power BI works in synergy with the new platform. What options we, Power BI developers, have when working with Synapse? In which data analytics scenarios, Synapse will play on the edge, helping you to achieve the (im)possible? When would you want to take advantage of the innovative solutions within Synapse, and when would you be better sticking with more conventional approaches? What are the best practices when using Power BI – Synapse combo, and which parameters should you evaluate before making a final decision on which path to take.
Once we’re done, I believe that you should get a better understanding of the “pros” and “cons” for each of the available options when it comes to integration between Power BI and Synapse.
Special thanks to Jovan Popovic from Microsoft, who helped me understand key concepts and architecture of Synapse
After we laid a solid theoretical background and got more familiar with Azure Synapse Analytics in the previous part of the series, I believe it’s the right moment for Power BI to jump on the stage.
Synapse for Power BI Developers
As already stressed in the previous article, Microsoft made Synapse Analytics a one-stop-shop for all your data-related tasks. That being said, one would expect tight integration between the Synapse and Power BI, as Power BI is (rightly) considered as an ultimate tool to articulate data and serve your users with various business insights.
And, Synapse in synergy with Power BI, and vice versa, live to that high expectations!

Before we dive deep in each of the different layers of integration between these two, let me briefly walk you through the scenarios when you, as a Power BI developer, might want to consider using Synapse:
- DirectQuery – I’ve already written about DirectQuery in detail, explaining what it is, and in which scenarios you should consider using DQ. As you may recall from that article, DirectQuery is by no means an optimal choice when it comes to report performance, as each visual will generate at least one query to a data source. However, in specific circumstances, you will have no other option than to use DirectQuery, and Synapse can be your friend in those situations! We will examine later on a real example how this works in reality…
- Security – If you think of Power BI authentication through Azure Active Directory (AAD), which is also a recommended standard for Synapse, you can easily imagine a scenario where security for Power BI solutions is being handled on a data-tier level within Synapse. This is especially important for Power BI solutions that rely on the DirectQuery option, as you may still want to implement Row-Level-Security when using Import mode
- Data shaping – Power BI has its own set of tools for performing data shaping – most noticeable – Power Query, Dataflows, and DAX calculated columns and tables. However, none of these can be compared to enterprise-scale capabilities for data transformation and preparation within Synapse. For starters, Synapse comes with Azure Data Factory, as probably the most powerful tool for data orchestration tasks. That means that you can perform whole data shaping on the source side, so your Power BI reports can benefit from using ready-made solutions
- Single source of truth – You’ve probably heard this sentence many times if you’re working with data. Essentially, that’s the ultimate goal we all aim to achieve. Since Synapse represents, from one of its perspectives, the legitimate successor of Azure SQL Data Warehouse, you can take advantage of this, and use data from Synapse for your Power BI reports being confident that the data comes from the centralized and approved location
Power BI storage modes in a nutshell
Before we proceed further with examining how Power BI benefits from synergy with Synapse Analytics, we need to understand different types of storage modes in Power BI itself.
I’ve already written about the Storage engine within the Tabular model in this article and explained in detail how you can optimize your data model size by applying some of the best practices that can enable VertiPaq to achieve the optimal data compression.

However, a brief overview of the storage modes here would help to better understand various capabilities when working with Synapse:
- Import mode – based on VertiPaq. Table data is being stored in-memory as a snapshot. Data can be refreshed periodically
- DirectQuery mode – data is being retrieved from the data source at the query time. Data resides in its original source before, during, and after the query execution
- Dual mode – a combination of the first two options. Data from the table is being loaded into memory, but at the query time it can be also retrieved directly from the source
Where does Synapse fit here?
Ok, now you’re probably asking yourselves what Synapse brings to the table when it comes to Power BI development.
In this article, we will examine various scenarios when working with data that comes from Synapse Analytic Engines. As you may recall from the previous article, there are three different Analytic Engines in Synapse: Serverless SQL pool, Dedicated SQL pool, and Apache Spark pool.
And each of them has its own advantages and practical use-cases. But, the one thing they all have in common is that they easily integrate with Power BI!
As I mentioned, dealing with Apache Spark Analytic Engine will not be covered in this blog series. However, in case you are interested to learn how Spark Analytic Engine works in synergy with Power BI, you can check this tutorial and get more details.
Since the next article of the series will cover integration between Power BI and Dedicated SQL pool in detail, let’s focus here on using the Serverless SQL pool as a data source for our Power BI reports.
Stop talking – it’s DEMO time!
Now it’s time to get our hands dirty and evaluate different scenarios when using Synapse’s Analytic Engines as a storage for the data that is being consumed by Power BI.
But, first things first. Before we proceed further, you should understand the concept of Linked Services in Synapse. Basically, using Linked services, you can take advantage of including a whole set of different features and services that exist outside of Synapse, such as Azure Data Lake, CosmosDB, Amazon Redshift, MongoDB, and many more…One of them is Azure HDInsight, if you plan to work with Apache Spark Analytic Engine. And, by linking them, they become a part of your Synapse ecosystem!
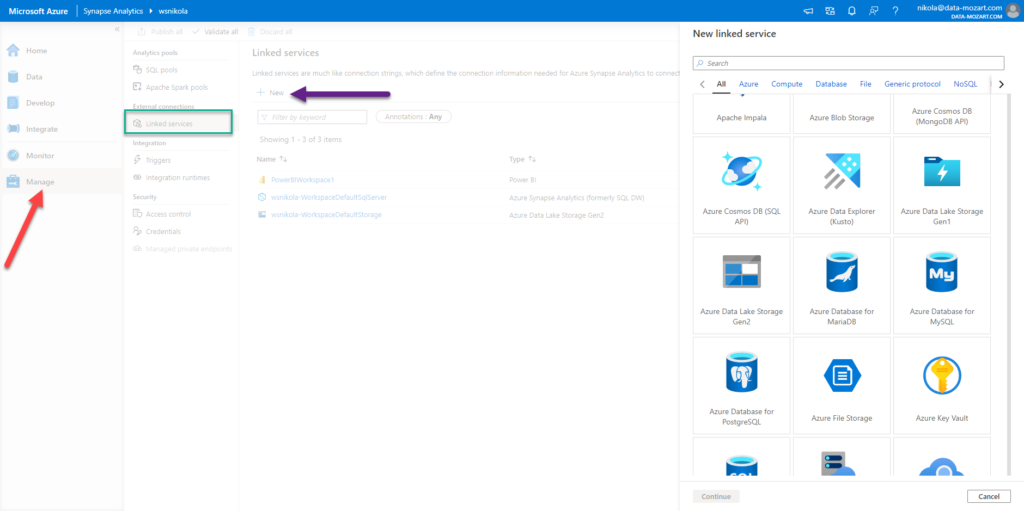
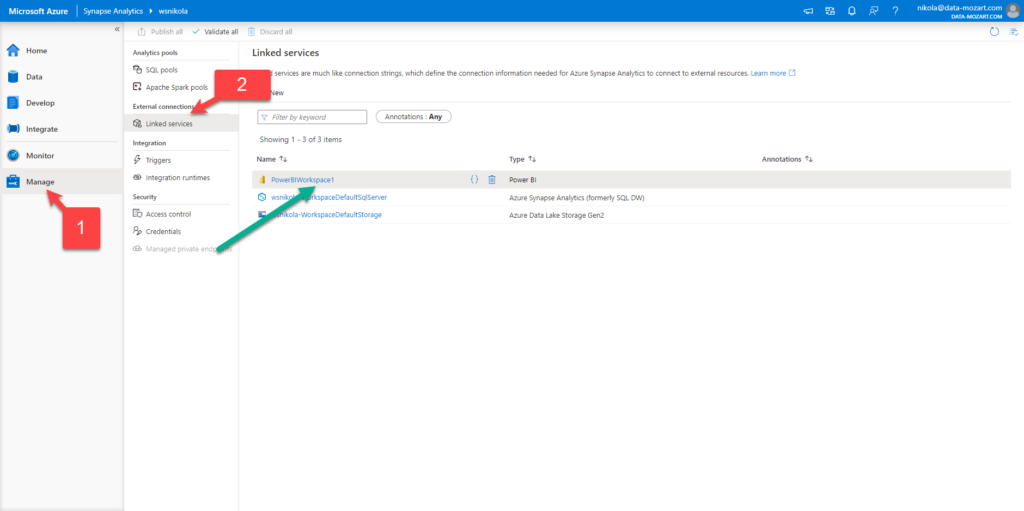
Now, under Manage option, and under Linked services, I’ve linked my Power BI workspace – this means I can immediately start developing my Power BI reports, straight from the Synapse Analytics Studio!
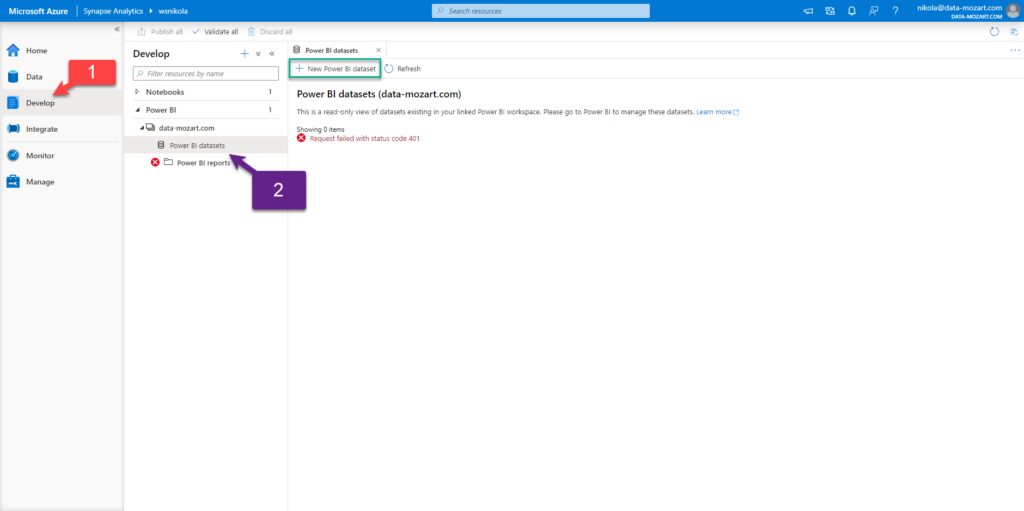
When I click on Develop, under Power BI, I see my workspace and available Power BI datasets and reports. There is nothing in there so far, so I will click on New Power BI dataset:
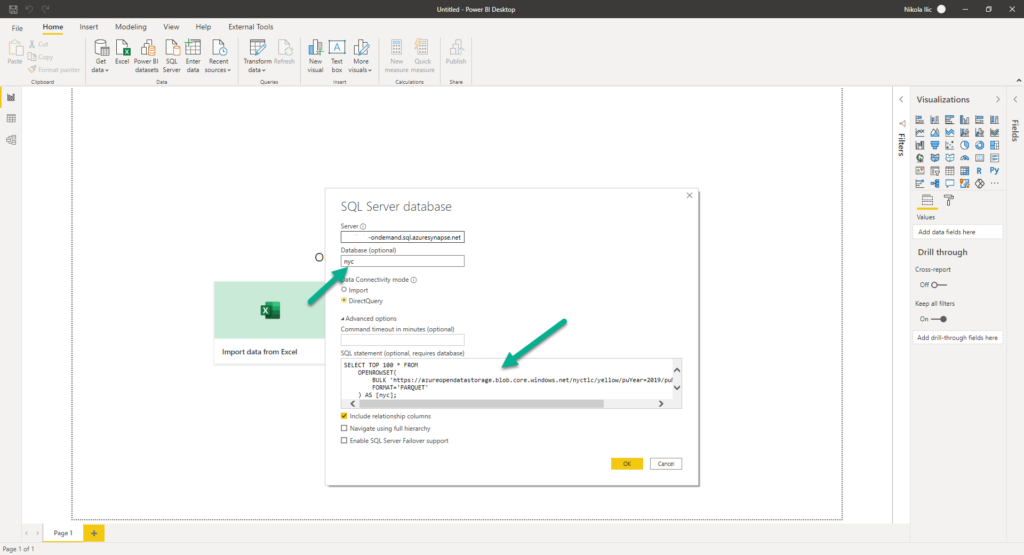
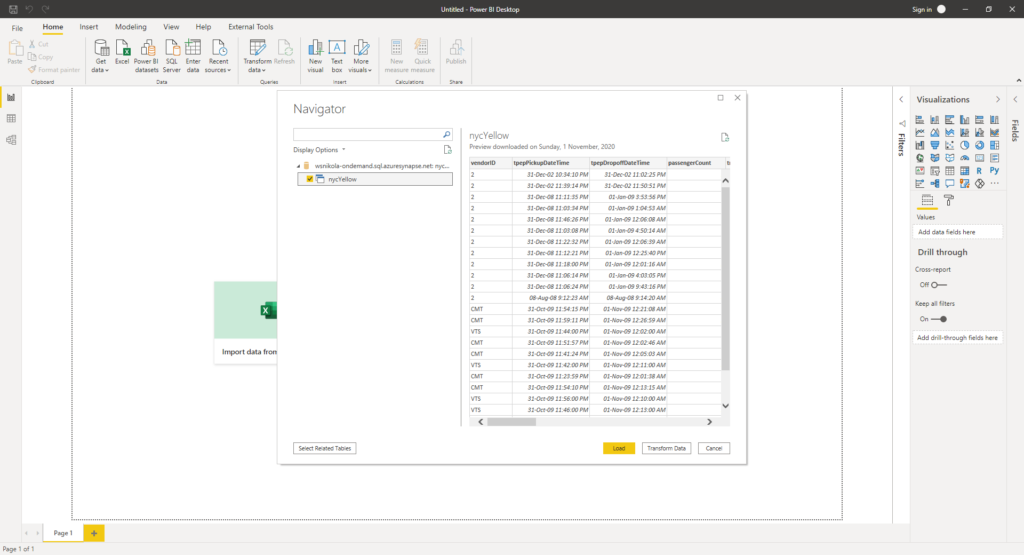
Now, in the previous article, I showed how you can write plain T-SQL to query data from parquet files (and CSV, and JSON files too)! And, using the OPENROWSET function, I’ve created a view that contains data about taxi rides in New York City. This dataset has around 1.5 billion rows, so let’s check how we can visualize data from this huge dataset in Power BI.
One bonus tip: in case that certain AAD users don’t have rights to create objects in the database, so they are not able to create a view like I did, they can still benefit from using Serverless SQL pool as a data source for the Power BI report, by writing T-SQL query directly in Power BI!
Simply choose Azure SQL Database as your data source, put the URL of your Synapse workspace (this can be found under Serverless SQL Endpoint), enter database name (if no database exists, type: master), and write T-SQL directly in the query window to get your data into Power BI!
That’s an awesome feature and opens the door to an indefinite number of use-cases!
In this article, we will not go deep into detail about the performance, optimization, costs, etc. The purpose of this demo is just to emphasize the flexibility of integration between Synapse Analytics and Power BI.
Since you are getting a Serverless SQL pool provided by default when you create your Synapse Analytics workspace, I will choose my Serverless SQL pool as a data source and after that download automatically created .pbids file. You can also use the Dedicated SQL pool or Apache Spark pool as your data source once they are provisioned (and I will show you in the next article how to use Dedicated SQL pool as a data source), but for the sake of simplicity, I will use Serverless SQL pool in this example.
Once I open this file in Power BI Desktop, my data is ready for action!
Now, we will use DirectQuery just to demonstrate how you can leverage the integration of Synapse and Power BI to work with enormous volumes of data. I’ve put just one visual on my report canvas: card visual showing the calculation of the following measure:
Total Records = COUNTROWS(nycYellow)
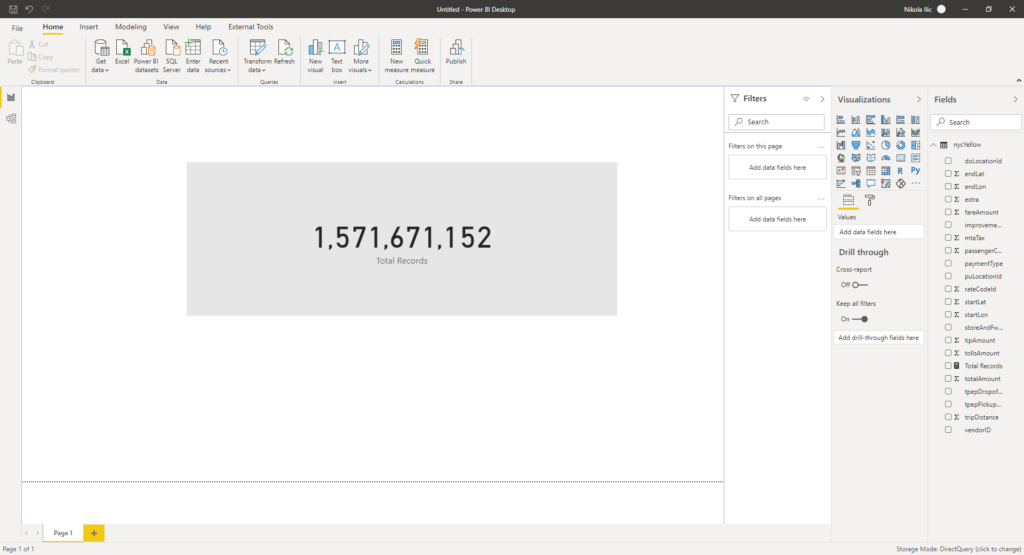
As you can spot, we are querying a giant dataset using our favorite reporting tool – Power BI! Moreover, our users don’t even know what is in the background. They can’t imagine that they are slicing and dicing data coming from the parquet file! And, we enabled it using regular T-SQL, without the need to “physically” transfer the data and store it! Essentially, we’ve created a “virtual” data warehouse with help of a Synapse Serverless SQL pool. Finally, as this data is in form of a “normal” SQL view, we are able to interact with it in Power BI like with any other view from the on-prem SQL Server or Synapse Dedicated SQL pool!
And, don’t forget that we performed all required steps within one single environment – Azure Synapse Studio! We’ve even connected to Power BI Desktop directly from Synapse…That’s the integration between Synapse and Power BI that I’m constantly emphasizing, and that makes these two, at first glance completely different tools, so tightly coupled!
Once I’m done with my work in Power BI Desktop, I can publish the report to a Power BI workspace:
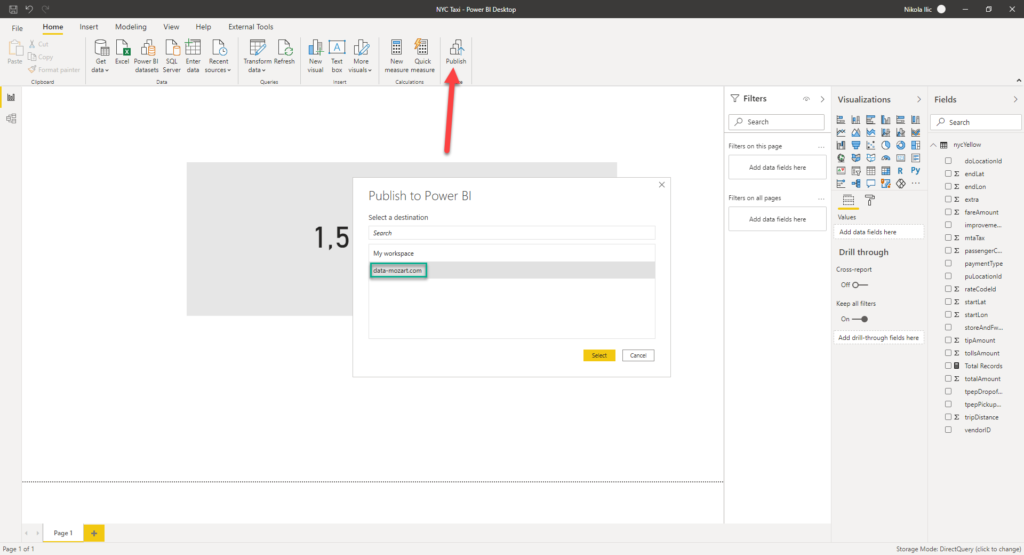
And, since I’ve linked my Power BI workspace to a Synapse Analytics Studio, I can access my report directly from there! Not just that, I can interact with the report, and if I want to make some changes, I can even save it directly from Synapse Analytics Studio! How cool is that!
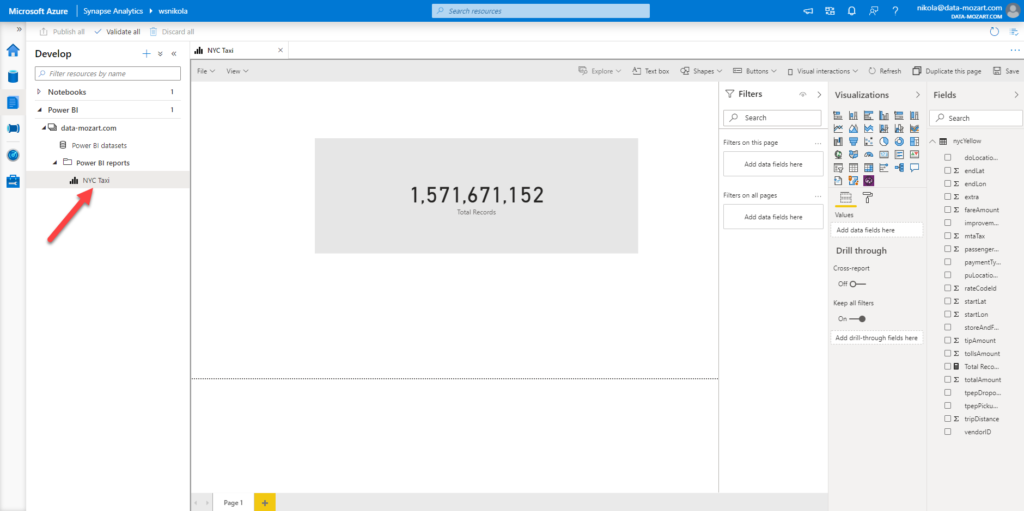
That’s the key takeaway from this blog series – when used together, Synapse and Power BI unlock indefinite possibilities for calibrating your data workloads!
Conclusion
In this article, we examined different ways of integration between Synapse Analytics and Power BI, and how you, as a Power BI developer, can leverage your analytic workloads using these two powerful tools in synergy.
We showed how you can quickly visualize data coming from the parquet file, directly in Power BI, without the need to perform any physical data manipulation, by using simple T-SQL and taking advantage of Synapse Analytics Serverless SQL pool.
In the next article, we will focus on consuming relational data from Synapse Dedicated SQL pool, and different scenarios that can be supported within Power BI.
Thanks for reading!
Last Updated on November 17, 2020 by Nikola


