
Despite my planning not to write any “serious” blog posts till the end of year (I just wanted to create some entertaining stuff), a recent announcement from Microsoft that Serverless SQL Pool within Synapse now supports a whole new set of T-SQL functions forced me to change my initial plans and play around with the latest stuff.
Honestly, I was curious to test how PIVOT works in the synergy between Power BI and Synapse, as this is one of the most used transformations in Power BI.
Before you proceed reading, maybe you would like to check the article where I explained what is Synapse Analytics, and what kind of benefits it brings to a Power BI table.
In case you are interested how much will using the Serverless SQL pool within Synapse cost you, please refer to this article and check all the different scenarios.
Scenario
As in the previous examples, I will use the NYC Taxi dataset to prepare different use-cases, which means that I wanted to check how PIVOT works both for CSV and PARQUET files in the background.
I’ve created a view for each single scenario within my Synapse Serverless SQL pool, in order to handle all the necessary transformations, and that would enable usage of “regular” Import mode in Power BI, without need to write custom T-SQL (writing custom T-SQL to import the data would prevent query folding, and that is the main parameter I wanted to test here).
The main idea is to display total amount for every single date per vendor in Power BI report…
#1 CSV File with no additional transformations in Serverless SQL pool
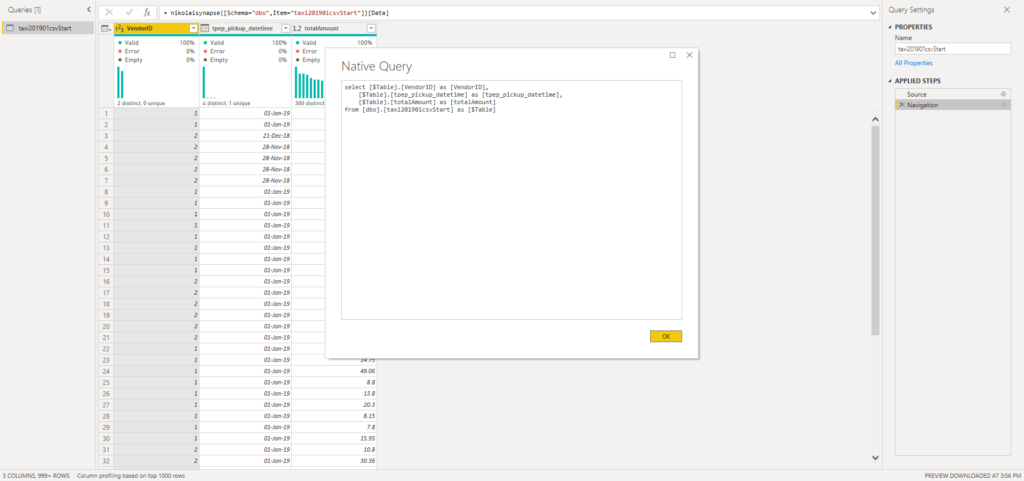
This is the most basic option – simple selecting three necessary columns from the original dataset: VendorID, Date and Total Amount:
CREATE VIEW [dbo].[taxi201901csvStart] AS
 SELECT
     VendorID
    ,cast(tpep_pickup_datetime as DATE) tpep_pickup_datetime
    ,total_amount totalAmount
	FROM
    OPENROWSET(
        BULK 'https://<Your ADLS>/nikolaiadlsfilesys/Data/yellow_tripdata_2019-01.csv',
        FORMAT = 'CSV',
        PARSER_VERSION='2.0',
        HEADER_ROW = TRUE
    )  WITH(
        VendorID INT,
        tpep_pickup_datetime DATETIME2,
        total_amount DECIMAL(10,2)
    )
	as baseQuery
GO
Once I’ve loaded the data into Power BI and opened Power Query Editor, I can see my data here, and I can see that query folding is still in place:
Now, I’ve applied PIVOT transformation to a VendorID column, and guess what – I needed to wait approx. 10 minutes for the transformation to be applied! And guess what else – query folding was broken! This means that the Mashup engine needed to be included in order to apply the required transformation.
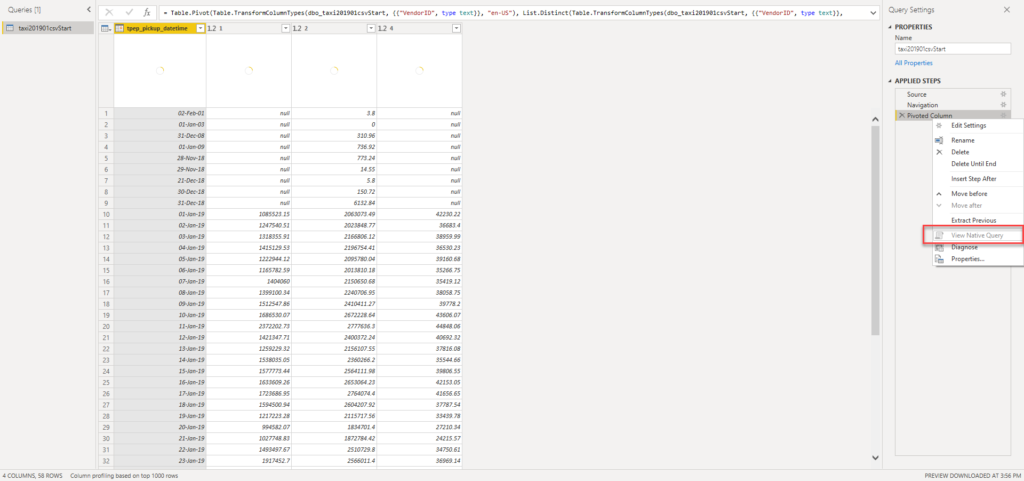
And, this dataset has around 7.7 millions of records.
#2 CSV file with aggregated data within Serverless SQL pool
The next scenario was to test the data coming from the CSV file again, but this time I’ve preaggregated the data on a row level:
CREATE VIEW [dbo].[taxi201901csvAggNormal] AS
 SELECT
     VendorID
    ,cast(tpep_pickup_datetime as DATE) tpep_pickup_datetime
    ,SUM(total_amount) totalAmount
	FROM
    OPENROWSET(
        BULK 'https://<your ADLS>/nikolaiadlsfilesys/Data/yellow_tripdata_2019-01.csv',
        FORMAT = 'CSV',
        PARSER_VERSION='2.0',
        HEADER_ROW = TRUE
    )  WITH(
        VendorID INT,
        tpep_pickup_datetime DATETIME2,
        total_amount DECIMAL(10,2)
    )
	as baseQuery
	GROUP BY VendorID
    ,cast(tpep_pickup_datetime as DATE)
GO
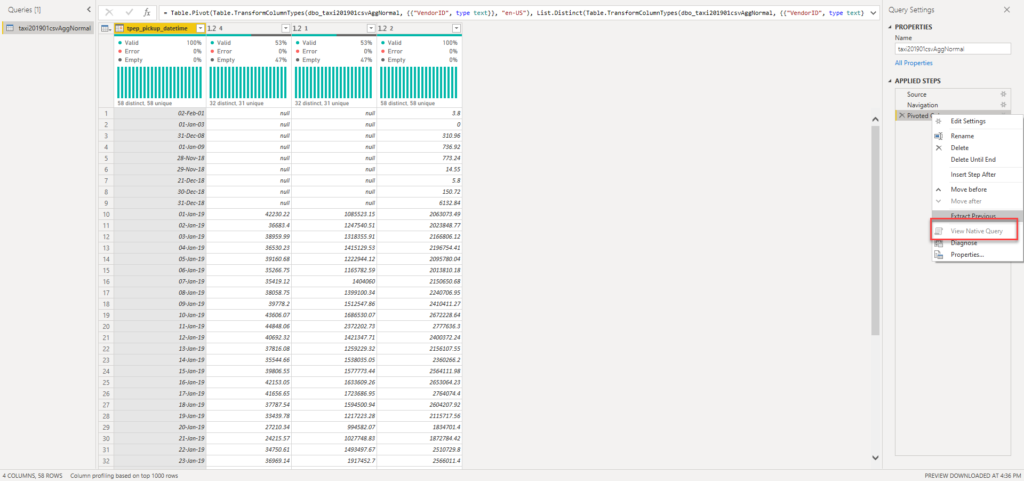
Pivoting for this one, of course, worked much faster, as data was already aggregated and the dataset contained only 120 rows for pivoting (instead of 7.7 millions). However, query folding was again broken:
#3 CSV File with pivoted data within Serverless SQL pool
Finally, let’s try the newly introduced function in the Serverless SQL pool – PIVOT! This function already existed in “standard” T-SQL, but it’s a nice extension to capabilities within Synapse.
CREATE VIEW [dbo].[taxi201901csvAggPivot] AS
with baseQuery as (
    SELECT
     VendorID
    ,cast(tpep_pickup_datetime as DATE) tpep_pickup_datetime
    ,SUM(total_amount) totalAmount
	FROM
    OPENROWSET(
        BULK 'https://<Your ADLS>/nikolaiadlsfilesys/Data/yellow_tripdata_2019-01.csv',
        FORMAT = 'CSV',
        PARSER_VERSION='2.0',
        HEADER_ROW = TRUE
    )  WITH(
        VendorID INT,
        tpep_pickup_datetime DATETIME2,
        total_amount DECIMAL(10,2)
    )
	as baseQuery
	GROUP BY VendorID
    ,cast(tpep_pickup_datetime as DATE)
)

select tpep_pickup_datetime AS pickupDate
	,[1] AS Vendor1
	,[2] AS Vendor2
	,[4] AS Vendor4
from baseQuery
PIVOT (
      SUM (totalAmount) FOR VendorID IN ( [1], [2], [4])
) AS Vendors
GO
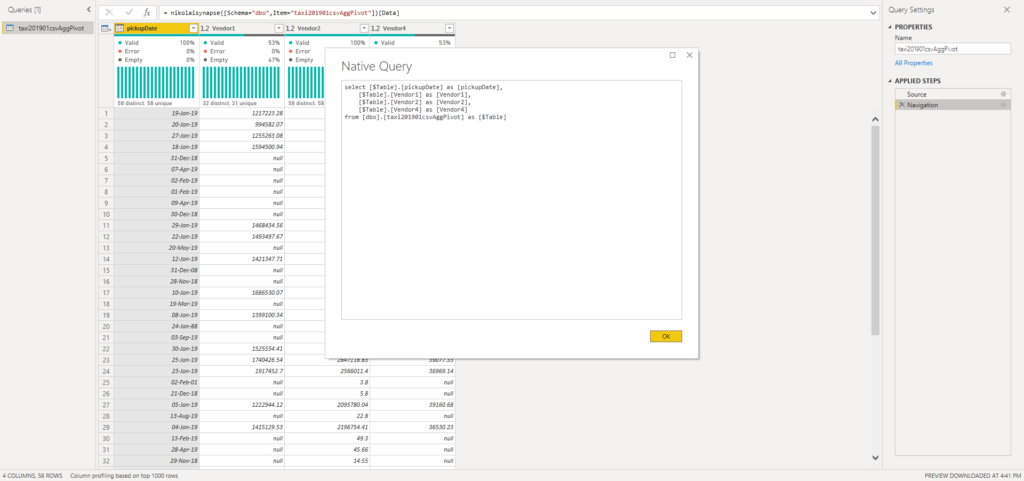
Here, no additional transformations are needed, as the data comes already in shaped form. And, obviously, query folding works!
#4 Parquet File with no additional transformations in Serverless SQL pool
As you probably know, PARQUET format compresses data in a more optimal way than CSV. Therefore, instead of only one month of data in CSV, I’ve included two months for Parquet scenarios! In total, my dataset has around 14.4 million rows:
CREATE VIEW [dbo].[taxi20190102parquetStart] AS
	SELECT
        VendorID
        ,CAST(TpepPickupDatetime AS DATE) TpepPickupDatetime
        ,TotalAmount TotalAmount
FROM
    OPENROWSET(
        BULK 'puYear=*/puMonth=*/*.snappy.parquet',
        DATA_SOURCE = 'YellowTaxi',
        FORMAT='PARQUET'
    )nyc
WHERE
    nyc.filepath(1) = 2019
    AND nyc.filepath(2) IN (1,2)
    AND tpepPickupDateTime BETWEEN CAST('1/1/2019' AS datetime) AND CAST('2/28/2019' AS datetime)
GO

Once I’ve applied PIVOT transformation, it took around 15 seconds, and guess what: query folding was in place!

As you can see in the query generated by the Formula Engine, the engine was smart enough to take advantage of the PIVOT function and push the heavy lifting on the source side! That’s awesome!
But, hey, I have more great news to share! Let’s try to add some more transformations, and to check if the query folding breaks. The first step is to remove the column:
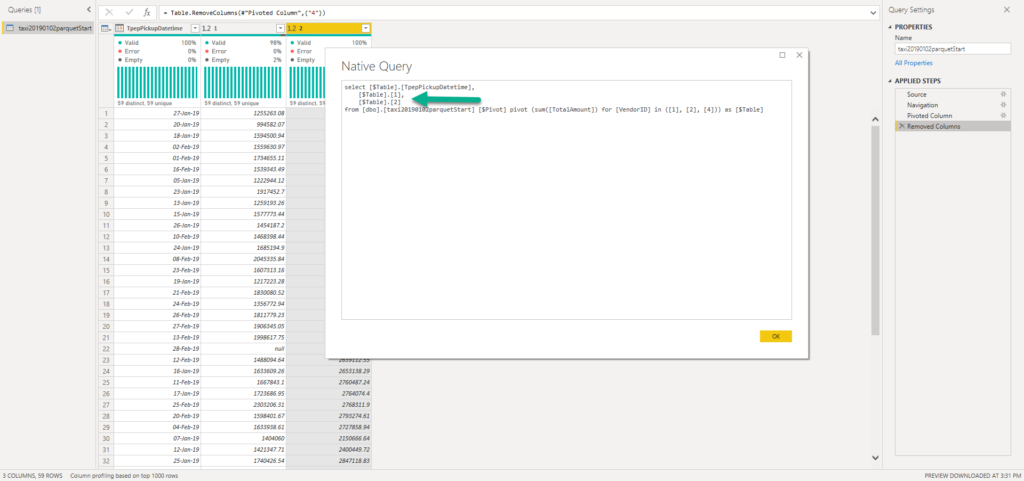
As you see, the query was adjusted to include only the required columns. This might not look like something special for you, but let’s not forget that the Serverless SQL pool charges you for the amount of data processed – that means if you are retrieving fewer columns (fewer data is being scanned and moved) you will pay less!
So, being able to perform this kind of thing within Power BI, and without breaking query folding, can save you real money!
Finally, let’s filter one of the columns within Power Query editor and see what happens:

As you can spot, I want to keep only those records for Vendor2 with values greater than 2.500.000.

And that folds too!!! You see a nice WHERE clause being added to our query that will be forwarded to a data source. Brilliant!
Conclusion
Introduction of the new T-SQL functions within Serverless SQL pool in Synapse Analytics enabled Power BI engine to generate more optimal queries, and, consequentially, reduce the query costs – both in terms of money, as only necessary data would be processed, but also in terms of speed – because query folding works, the whole query, together with transformations, can be pushed down to a data source.
Truth to be said, at the moment that applies to Parquet files only. So, if possible, you should tend to store your data in Parquet format in your Data Lake.
If you’re dealing with CSV files, performing PIVOT transformation from the Power Query editor is not an optimal solution. Luckily, you can now take advantage of using the T-SQL PIVOT function within the Serverless SQL pool and perform necessary data shaping before you import data into Power BI.
Thanks for reading!
Last Updated on December 19, 2020 by Nikola