

By introducing Azure Synapse Analytics in late 2019, Microsoft created a whole new perspective when it comes to data treatment. Some core concepts, such as traditional data warehousing, came under more scrutiny, while various fresh approaches started to pop up after data nerds became aware of the new capabilities that Synapse brought to the table.
Not that Synapse made a strong impact on data ingestion, transformation, and storage options only – it also offered a whole new set of possibilities for data serving and visualization!
Therefore, in this series of blog posts, I will try to explore how Power BI works in synergy with the new platform. What options we, Power BI developers, have when working with Synapse? In which data analytics scenarios, Synapse will play on the edge, helping you to achieve the (im)possible? When would you want to take advantage of the innovative solutions within Synapse, and when would you be better sticking with more conventional approaches? What are the best practices when using Power BI – Synapse combo, and which parameters should you evaluate before making a final decision on which path to take.
Once we’re done, I believe that you should get a better understanding of the “pros” and “cons” for each of the available options when it comes to integration between Power BI and Synapse.
Special thanks to Jovan Popovic from Microsoft, who helped me understand key concepts and architecture of Synapse
Azure Synapse Analytics – New kid on the block, or…?
Since Power BI is already a mature and well-known product (it celebrated 5th birthday this July), before we dive into the relationship between Power BI and Synapse, I believe that we will need to spend some time learning about the “younger” technology…
As I already mentioned, Synapse was introduced about a year ago (late 2019.). Officially, it succeeded Azure SQL Data Warehouse (SQL DW), and was presented as an evolution of the SQL DW.
So, would it be fair if we think of Synapse as a “new kid on the block”, or just as a rebranding of the existing product?
Before we answer this question, let’s first take a look into traditional data warehousing architecture:
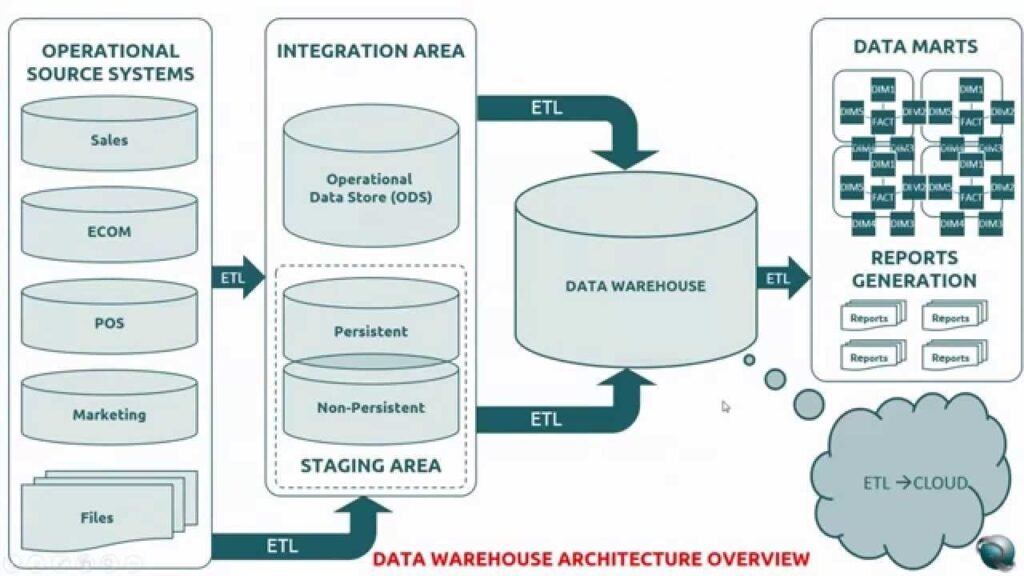
In a typical traditional data warehousing scenario, you would collect your data from multiple different sources, perform some transformations, data cleansing, etc. before putting consolidated data into a relational data warehouse. This was the focal point of your reporting solutions, a single source of truth for your data, and you could build various reports from there, using a whole range of tools – such as Crystal Reports, SSRS, or Power BI, if we talk about Microsoft’s solutions. You could also build an additional semantic layer using SSAS to create “cubes” (both tabular and multidimensional), and then target those cubes with reporting tools mentioned above (don’t forget good old Excel too).
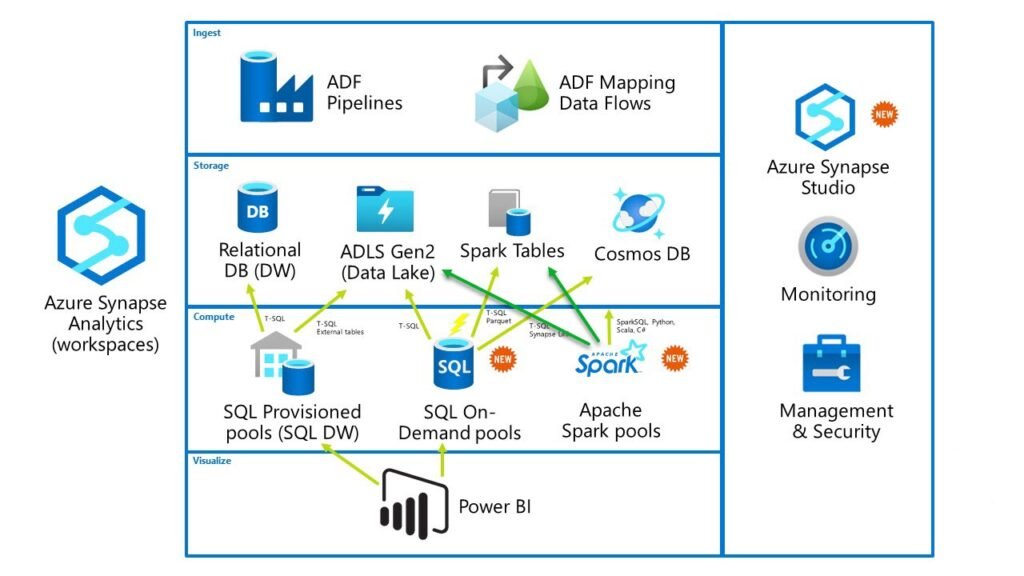
Now, with Azure Synapse Analytics, you are getting all these (and many more) functionalities under one roof! Even if you don’t have SSAS included in Synapse by default, you can link it as an external service.
But, first things first! Once you find yourself within Azure portal, if you search for Synapse, don’t get confused when you see something like this:
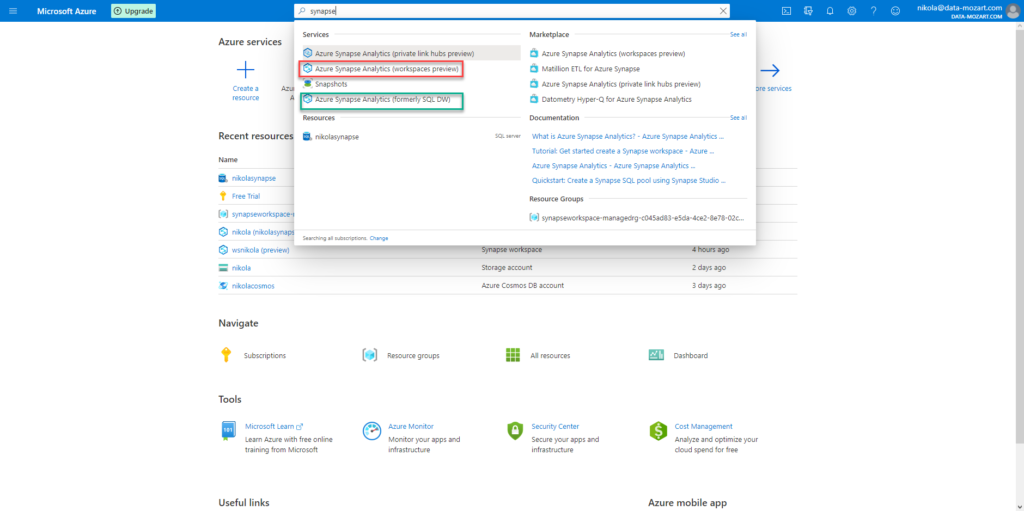
You will see, not one, but two separate results with the same name! In whole truth, explanation within the brackets shed some light on what option offers what, but still…it can be confusing for the first meeting with Synapse.
Azure Synapse Analytics marked with the green is nothing more than the “regular” SQL DW. I won’t spend time going into details here, as this option works more or less like a traditional data warehouse – of course, with the possibility to quickly and easily scale out your workload using additional power.
Therefore, we will fully focus on the option marked with red – Azure Synapse Analytics (workspaces preview)! This is where the party begins and where Synapse becomes revolution instead of evolution!
Swiss knife for your data
Can you recognize the object in the following picture?

Yes, that’s the famous “Swiss knife”. You can cut the paper, open a bottle of wine or beer, or cut some smaller items – all of that using one single tool!
So, if you’re asking yourself – what on Earth does Swiss knife have in common with Synapse?! Well, you can think of Synapse as a single tool that can satisfy all your data needs.
Do you need to import data from multiple different sources? Synapse can do that. Do you need to transform data before serving it? Synapse can do that, too. Do you need to store the data? Synapse can do it for you. Do you need to query non-relational data, or even files directly? Synapse can do that. Watch out now: do you need to query non-relational data, or even files directly, using plain old T-SQL? Synapse CAN DO THAT! Whaaaaat???!!!! Yes, you can write T-SQL to query data from CSV, JSON, or parquet files. But, more on that later in the series. Do you need to build machine learning models? Synapse can manage this for you. Finally, do you need to create your Power BI report straight from the Synapse? Yes, that is also possible!
As you may notice, Synapse is a one-stop service for all your data tasks.
Azure Synapse Studio – your ticket for all events
When I’m explaining some technical stuff, I like to make comparisons to non-technical things, so that people without a technical background can understand the essential underlying concept.

Now, you probably know when you travel to a famous tourist city for the first time, you want to visit all the important places: museums, sightseeing, local attractions… And the majority of these cities offer you a “City Card”. You can use that one single card to enter all of the main city attractions, which saves your time and money.
You can think of Azure Synapse Studio as “that” kind of card. It’s a unified workspace for all different tasks – from data preparation, data warehousing, monitoring and manage resources, etc.
Synapse Workspace – Understanding core components
Now, we are ready to scratch under the surface and examine the core components of the Synapse Workspace.
The most important part is the Analytic Engines. There are three different engines within the Synapse Workspace. Two of them are SQL-flavored (Dedicated SQL Pool and Serverless SQL pool), while the third is based on Apache Spark (Apache Spark Pool).
Also, two of them are provisioned (Dedicated SQL Pool and Apache Spark Pool), while the third (Serverless SQL pool) works like a serverless solution. In the most simplified way, it looks something like this:

In this blog series, we will not analyze the Spark pool, as our focus will be SQL-based solutions, especially the Serverless SQL pool.
Serverless SQL pool – full power without single piece of hardware!
As soon as you create a Synapse Workspace, you will see a Serverless SQL pool under your SQL pools:
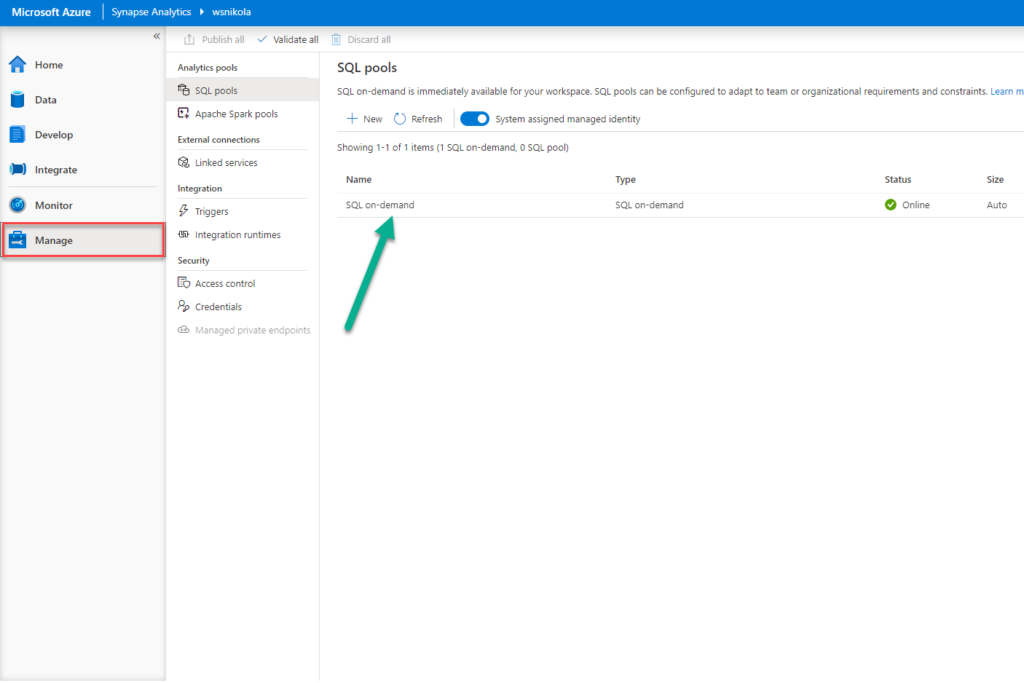
In my opinion, this is one of the revolutionary features in the Synapse. Essentially, what Serverless SQL pool could do for you is hardly beatable: you can query data directly within your data lake, without the need to transfer or copy it anywhere! Moreover, you can query the data in the data lake writing plain old T-SQL! Yes, CSV, JSON, and parquet files included!
Since it is a serverless system, you don’t need to set up any kind of infrastructure, or clusters. You can literally start querying your data as soon as your workspace is created! Serverless SQL pool works as a standalone Polybase service, so there are no costs for the resources reserved. You are only being charged for the volume of data processed by your queries (at the moment of writing, it is 5 USD/1 TB). Just keep in mind, when you’re planning your workloads, that the minimal billing volume is 10 MB. This minimal threshold doesn’t apply on metadata queries, so you don’t have to worry that you will be charged at all if you execute something like:
SELECT * FROM sys.objects
Having this tool under your belt lets you think about an indefinite number of possible approaches:
- You can quickly perform ad-hoc queries over data in the data lake before you decide what is the best possible way to gain more insights from it
- You can build an additional logical layer, a kind of “abstract” data warehouse on top of raw, or non-relational data, without moving data to a physical storage
- You can transform data directly in the data lake, and consume it directly from there (for example, using Power BI)
As already mentioned, you can use T-SQL to query the data directly from the data lake. And not just that! You can also write T-SQL to retrieve data from Spark tables and CosmosDB (we will examine the way Power BI can integrate with CosmosDB in a more optimal way, using this feature in Synapse).
Writing T-SQL for querying non-SQL Server data is being achieved by using an extended version of the OPENROWSET function. Because of the non-native usage, there are obviously a few limitations regarding some T-SQL functionalities.
I strongly suggest reading this article on James Serra’s blog, where he collected and answered a lot of questions regarding the Serverless SQL pool.
There is also a great overview of the best practices related to the Serverless SQL pool here.
Abrakadabra – read parquet file using T-SQL
Yes, I know that it sounds like we need a magic wand to query the data directly from the parquet file using plain T-SQL…But, it’s possible! And, trust me, you don’t need to me a magician – some basic T-SQL knowledge will suffice.
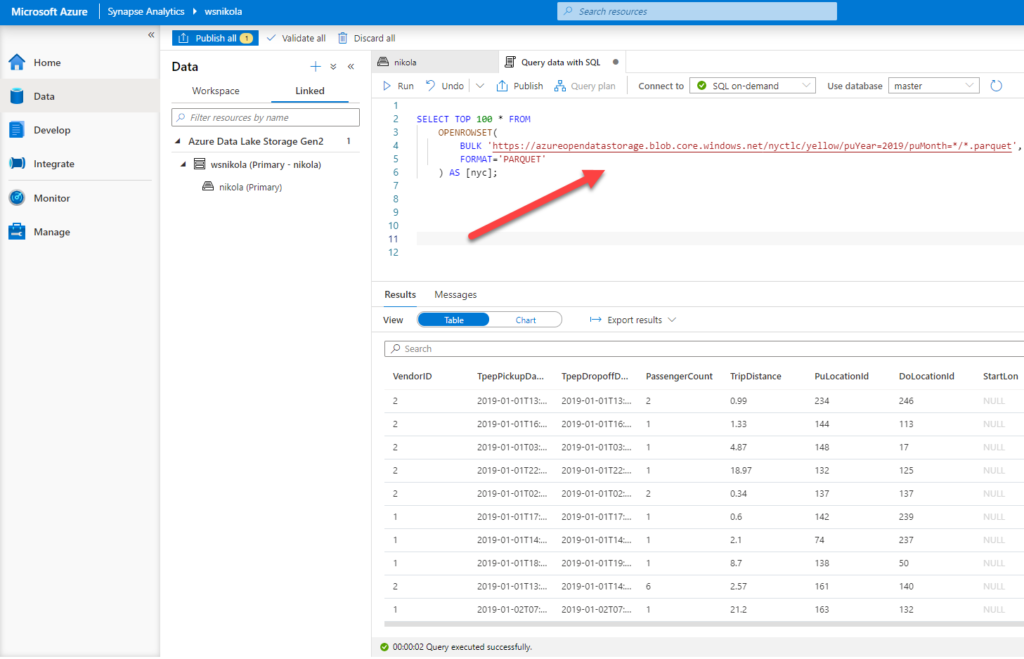
In this example, I’ve used a sample NYC Taxi dataset. Data is stored in a parquet file, but I can use the OPENROWSET function within my T-SQL syntax to query the ~1.5 billion record dataset like it is stored in my SQL Server database! How cool is that!
Additionally, I can extend on this and perform all kinds of aggregations, groupings, where clauses…
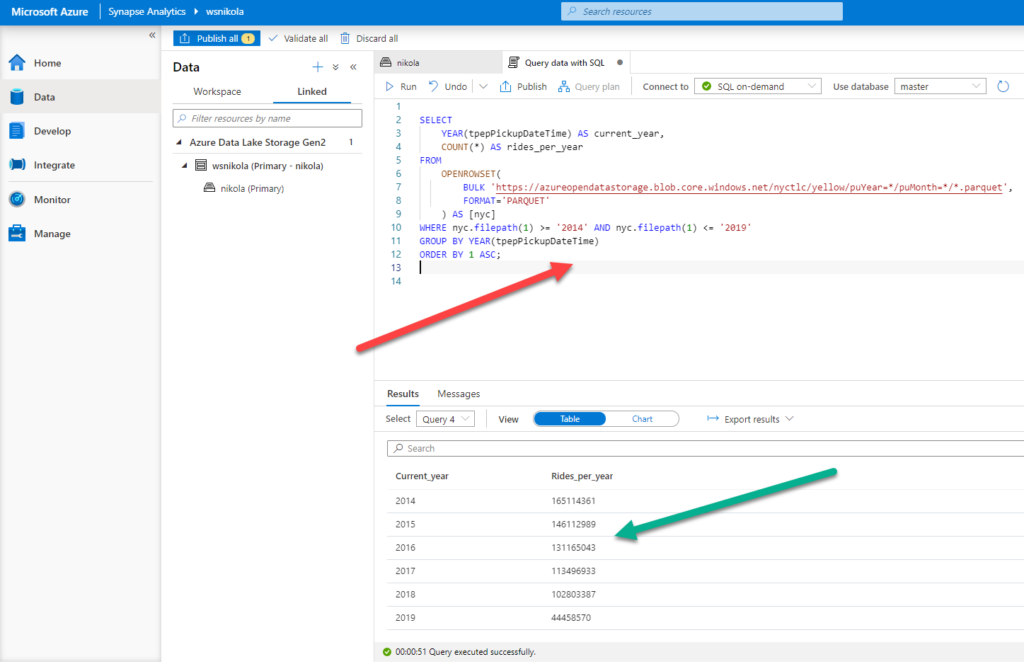
If that wasn’t enough, watch this:
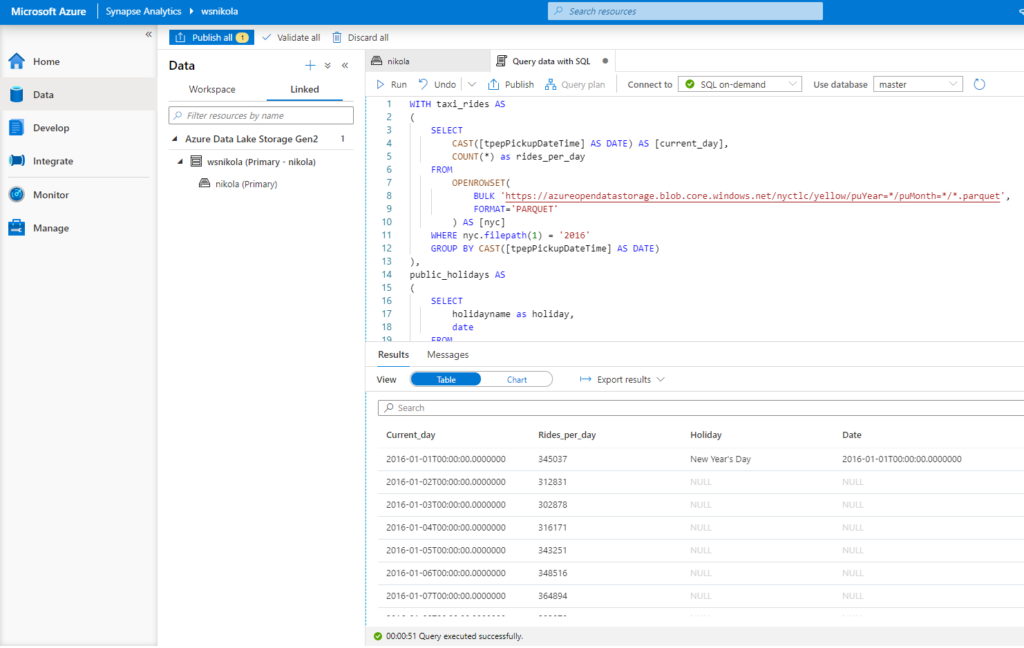
Here is the T-SQL code that was run over two parquet files:
WITH taxi_rides AS
(
    SELECT
        CAST([tpepPickupDateTime] AS DATE) AS [current_day],
        COUNT(*) as rides_per_day
    FROM
        OPENROWSET(
            BULK 'https://azureopendatastorage.blob.core.windows.net/nyctlc/yellow/puYear=*/puMonth=*/*.parquet',
            FORMAT='PARQUET'
        ) AS [nyc]
    WHERE nyc.filepath(1) = '2016'
    GROUP BY CAST([tpepPickupDateTime] AS DATE)
),
public_holidays AS
(
    SELECT
        holidayname as holiday,
        date
    FROM
        OPENROWSET(
            BULK 'https://azureopendatastorage.blob.core.windows.net/holidaydatacontainer/Processed/*.parquet',
            FORMAT='PARQUET'
        ) AS [holidays]
    WHERE countryorregion = 'United States' AND YEAR(date) = 2016
)
SELECT
*
FROM taxi_rides t
LEFT OUTER JOIN public_holidays p on t.current_day = p.date
ORDER BY current_day ASC
So, we created two CTEs, used the WHERE clause to filter the data, aggregate function, and finally joined CTEs like we were querying our “normal” SQL Server database…And, don’t forget, we were retrieving the data directly from two parquet files!
No, you don’t need to be Harry Potter to do this – using a Serverless SQL pool within Synapse Workspace is the only “trick” you should perform!
Conclusion
This was just a brief introduction to Synapse Analytics, Microsoft’s all-in-one solution for your data workloads. By no means we covered all concepts and features within this platform – the idea was to get you started for using Synapse in synergy with Power BI.
Now, I hope that you’ve got a better overview and a big picture of the main capabilities that Synapse provides and that you can take advantage of those capabilities once you start using Synapse for building your Power BI reports.
Take your time, explore the Synapse, try different approaches for your data workloads, before we dive together into the next phase, where Power BI, and its integration with Synapse (especially with Serverless SQL pool), will be our focal point!
Thanks for reading!
Last Updated on November 4, 2020 by Nikola


Hitchhikers guide to Azure Purview for Power BI professionals - vcunews
[…] should have noticed that Microsoft made two important announcements a few weeks ago: the first, Azure Synapse Analytics became GA, while the other also caused a lot of interest: by introducing Azure Purview as the […]