
Table of Contents
One of the most anticipated Power BI features is finally there! No, it’s not new fancy Small multiples improvements, or another fresh AI thing…It’s not even DirectQuery support for Dataflows, nor dataset discoverability (which are both, by the way, very cool additions). Guess what – the Paginated Report visual has just arrived on Power BI Desktop!
I hear you, I hear you…Who needs this thing at all?! Why would one use the (almost) deprecated technology in super modern shiny Power BI solutions?! Even more, Paginated reports are almost exclusively boring tables + matrices. We have these two in Power BI with waaay more customization options and properties to make them a lot nicer and better looking.
History lessons…
We, old people, tend often to say: “You know how it was done in my younger days…”, or “We did exactly like that X years ago…” And, Paginated reports came into our lives way before Power BI. In 2004, Microsoft introduced SQL Server 2000 add-in called SQL Server Reporting Services, and this tool became a reporting standard for the first decade and a half of this century (some will argue even longer, till nowadays).

Things in the data area evolving fast! Extremely fast! So, new challenges required fresh solutions, and Power BI was introduced in 2015 to answer as many business reporting questions as possible, in the most efficient and eye-catching way. However, same as SSAS Multidimensional, which still resists giving up (even though Microsoft pushes everything to Tabular in recent years), SSRS is an integral part of many legacy BI solutions that still work – and not just work, they work quite well!
Ok, the number of visualization types and their customization might look awkward compared to Power BI, but, hey, we could’ve written Visual Basic to extend built-in features! Raise your hand every one of you who used something like the following code snippet to make your table rows color alternating:)
=iif(rownumber(nothing) mod 2 = 0,"LightGrey","Transparent")
Yeah, I know, it’s much easier to format your table in Power BI and just click on the Alternate rows option, but VB is much more fun:)) (just kidding, of course)
I myself thought 2-3 years ago that SSRS is dead…Oh, how wrong I was! Do you know the movie: “No country for old men”? In my case, it could’ve been easily translated to: “No SSRS for old (data) men”… Even though most of the companies migrated to Power BI and adapted their reporting solutions to fit into a new cloud environment, there is still a significant number of clients who are not willing to discontinue using good old paginated reports.
No SSRS for old (data) men
And, believe me, I saw a lot of hybrid solutions, where the majority of the reports were migrated to Power BI, but certain reports remained in paginated form, without any intention to recreate them in Power BI…Why is that way, I hear you ask? Isn’t Power BI a more robust, more efficient, and more powerful tool? Of course, it is! There is no single doubt about it. If you look from a performance perspective, VertiPaq is a beast that can compress and process enormous amounts of data blazingly fast…From a data modeling perspective, I can bet that Power BI is the most comprehensive solution at this moment. You can extend traditional data modeling principles using various powerful features, such as Composite models, role-playing dimensions, Dataflows, and so on.
Not to tell about the capabilities for data transformation and data shaping, to prepare your data in an optimal way for the final reporting solution.
Paginated reports are not an alternative to Power BI!
Of course, if you put Power BI vs SSRS head-to-head, the winner is obvious! But, if you compare these two tools head-to-head, feature by feature, you are missing the point. Paginated reports are not here to be an alternative to Power BI – they are here to complement Power BI! Simply put, there are certain features that SSRS offers, that Power BI simply can’t replicate. For example, if your users insist on pixel-perfect, printable, or easily exportable reports, there is no better option than a paginated report! Their name says all – they are called paginated, because they are designed to fit well on the page!
Up until now, integration between paginated reports and Power BI reports was not possible. It was either one or the other. Now, with the Paginated Report visual, you can take advantage of the best features from both worlds!
Creating Paginated report
To be able to use a Paginated report visual, you first need to build a paginated report itself. So, let’s go and build a very basic paginated report, using the Adventure Works sample database. I’m intentionally keeping things simple, as the purpose of this article is not to go deep into the Paginated report creation process, but more focus on integration between the Paginated report and Power BI.
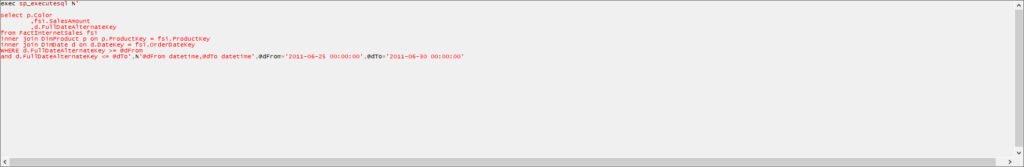
In order to build a Paginated report, you’ll need a separate tool, called Power BI Report Builder. If you used to work in SSRS Report Builder, the whole environment will look familiar. Here is the query I’ll use to create a dataset for my Paginated report:
SELECT p.Color,
       fsi.SalesAmount,
       d.FullDateAlternateKey AS [date]
FROM FactInternetSales fsi
    INNER JOIN DimProduct p
        ON p.ProductKey = fsi.ProductKey
    INNER JOIN DimDate d
        ON d.DateKey = fsi.OrderDateKey
WHERE d.FullDateAlternateKey >= @dFrom
      AND d.FullDateAlternateKey <= @dTo;
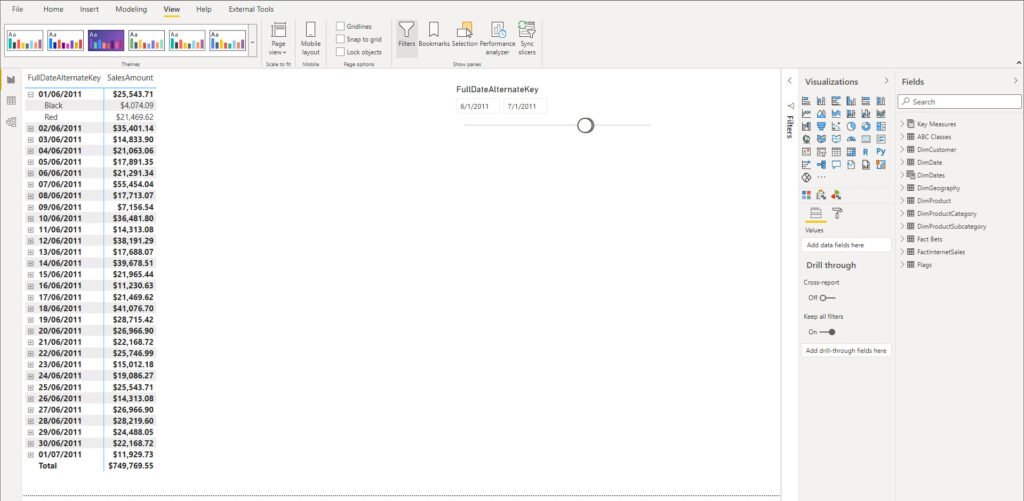
Basically, I want to show product color, sales amount, and date for every single transaction from my FactInternetSales table. As I said, a quite basic setup.
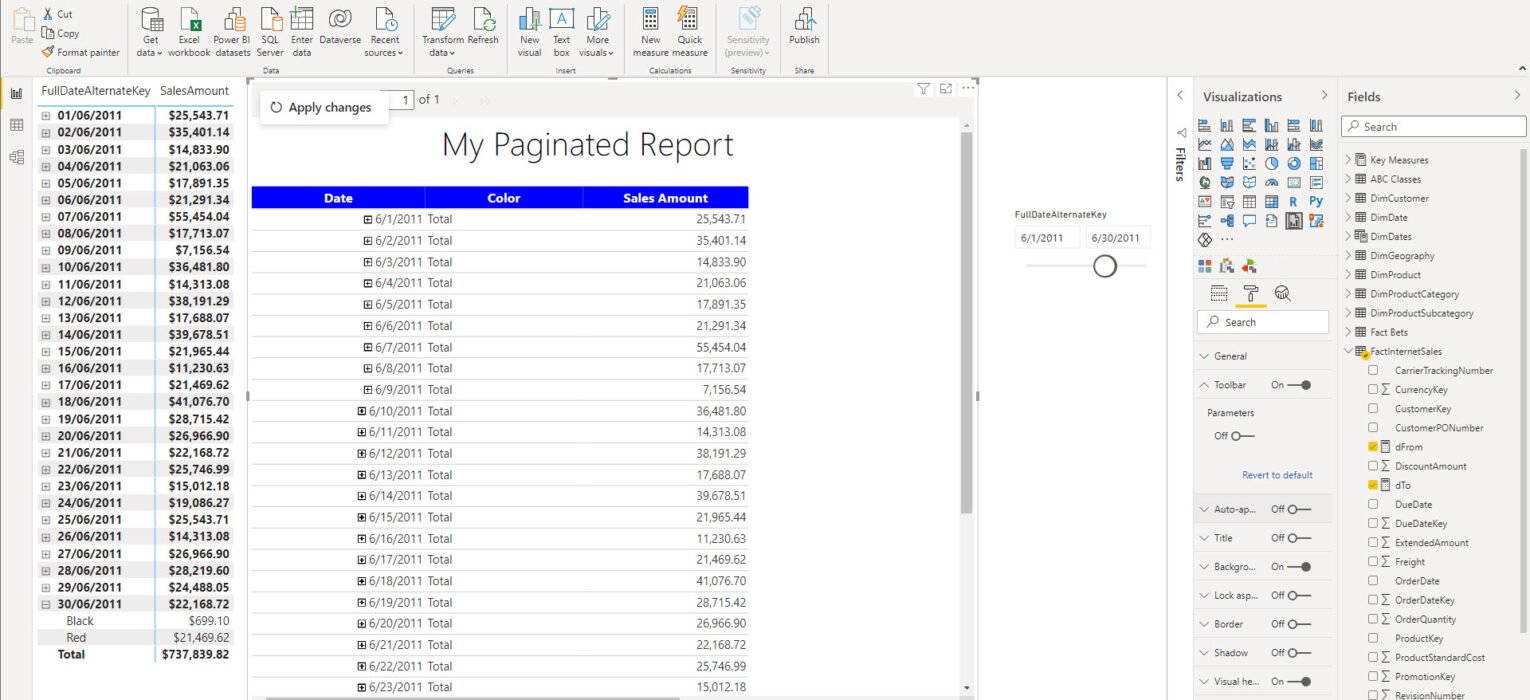
Since my query is parameterized, I need to map parameters (in my case, those are starting and ending dates). In case you’re using additional parameters (for example, color), make sure that you map them too. I’ve put a simple matrix on the report canvas, and I’m ready now to publish the report to my workspace:

You can immediately notice that the Paginated report differs from the “classic” Power BI report by looking at the icons next to the report name. And, if I run the Paginated report, it renders nicely to show me results based on the date parameters I’ve set:
So far, nothing special, as you had to decide whether you want to use Power BI or Paginated report…
Run Paginated report INSIDE Power BI report!
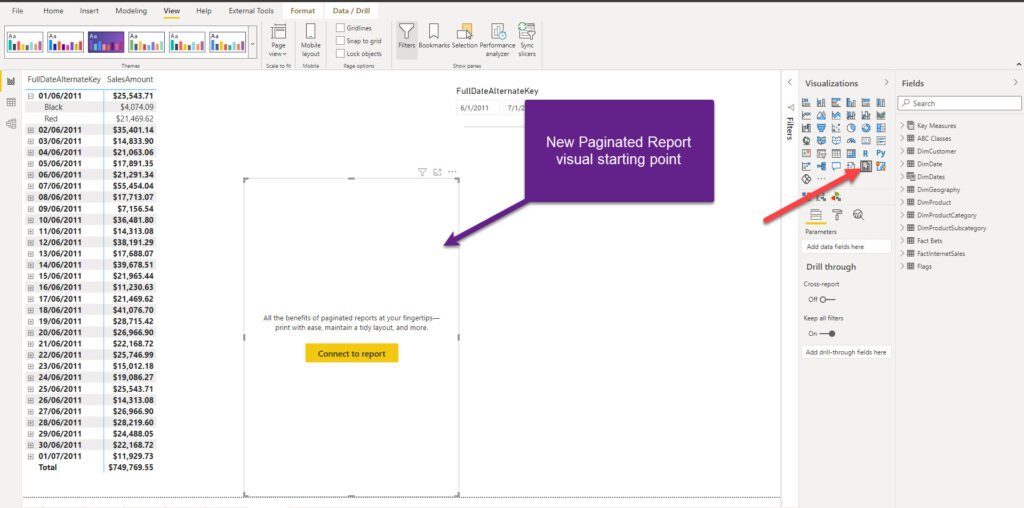
And, here is where the real magic happens! Now, you can integrate the Paginated report into your Power BI report and run it from there! Let’s go step by step to see how it’s done…
Within Power BI Desktop, I’m using exactly the same dataset (AdventureWorksDW2017) and I’ve created the same matrix as in the Paginated report previously. Now, I’ll drag a brand new Paginated Report visual on the report canvas and follow the instructions to connect to the My Paginated Report.
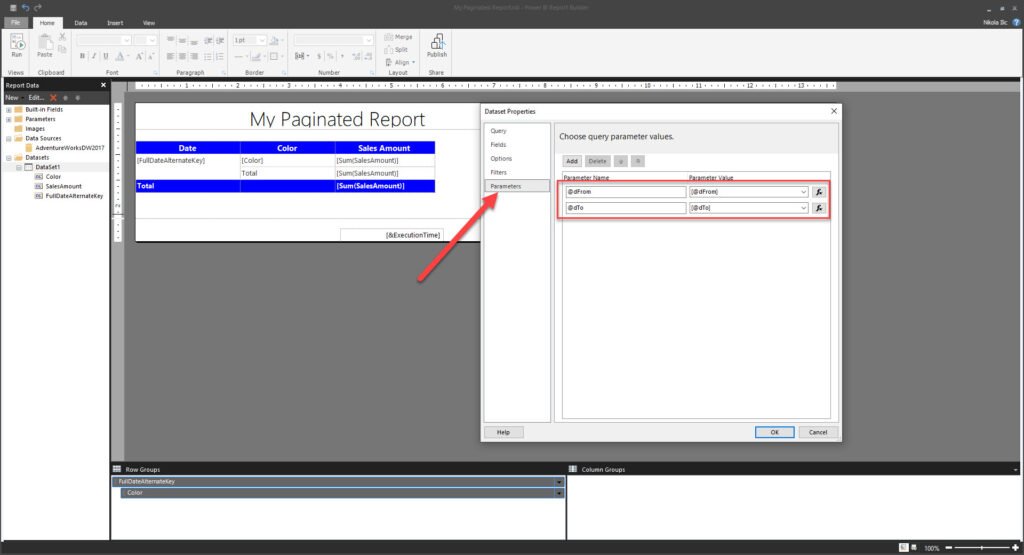
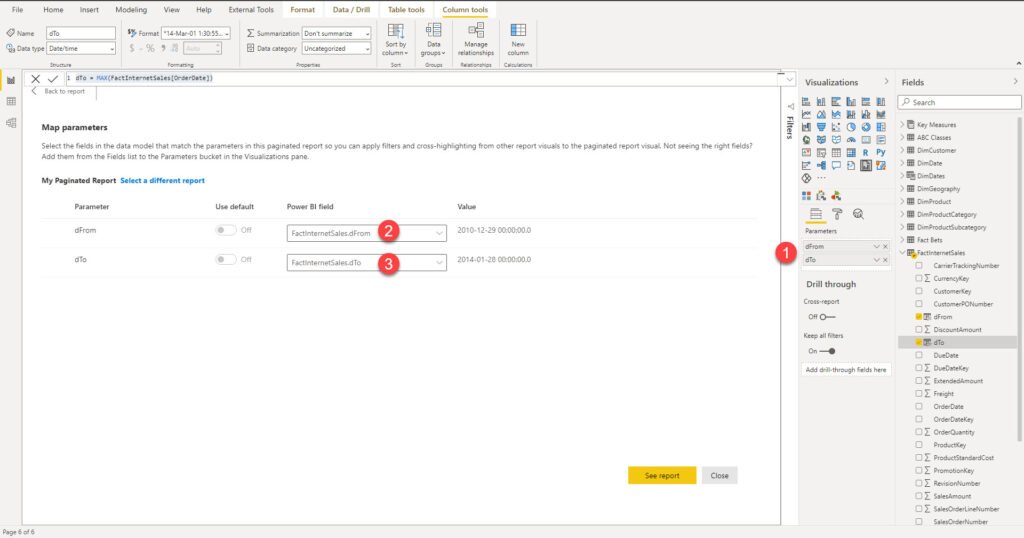
Now follows the interesting part, as you’ll need to configure a few things. After I’ve selected the paginated report I want to connect to (in my case, My Paginated Report), I need to provide parameter values, so that the visual can be cross-filtered from within Power BI! Therefore, I’ll create two measures to use to feed the parameter values:
dFrom = MIN(FactInternetSales[OrderDate])
dTo = MAX(FactInternetSales[OrderDate])
I will drag these measures as Parameters for the Paginated report visual and assign those values to my original parameters:
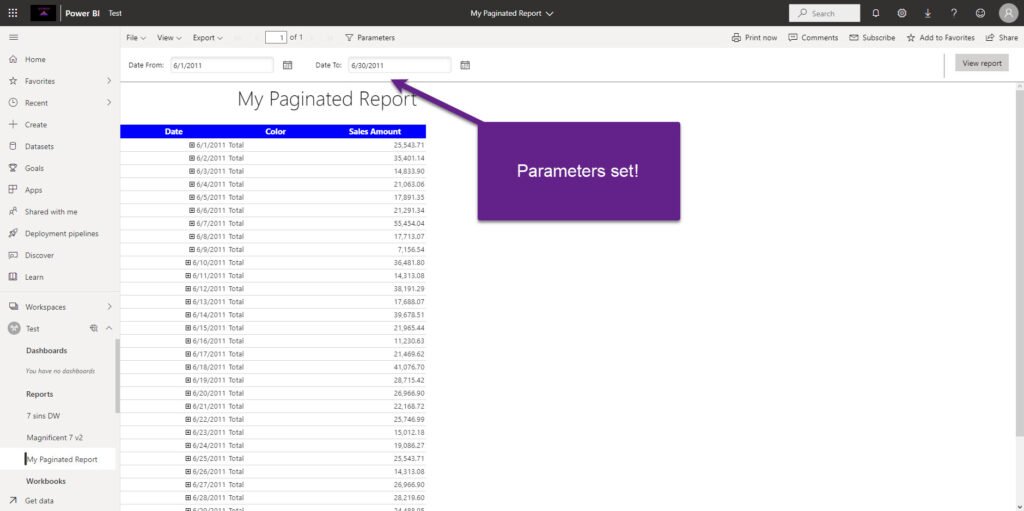
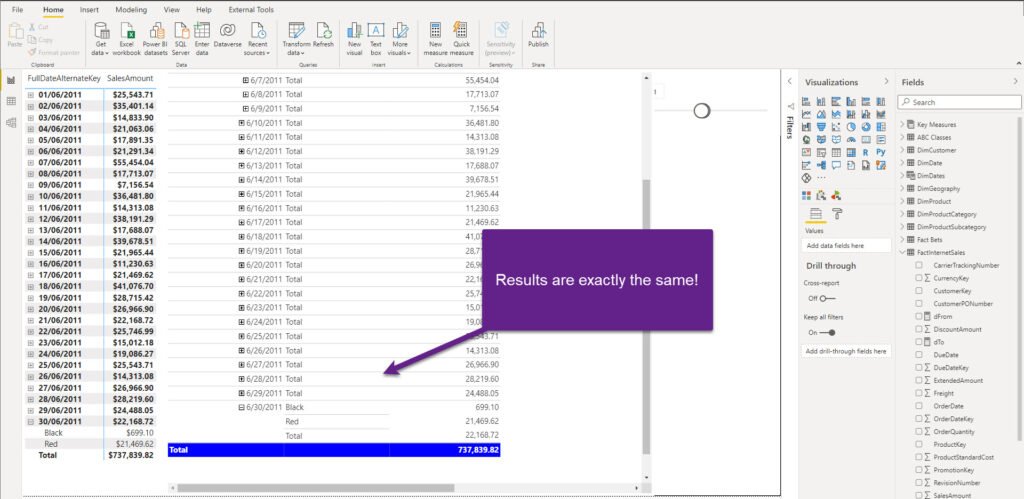
And once I click on See report, you can notice that I’m getting my Paginated report rendered within Power BI directly! How cool is that! And results are the same between the two matrices:
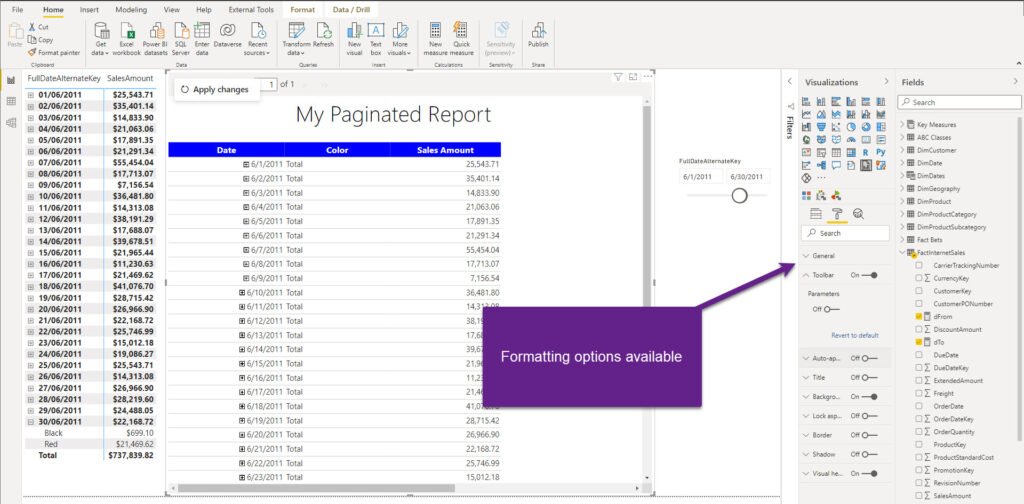
There are also additional formatting options for the Paginated Report visual. Obviously, not as many possibilities for customization as with “regular” Power BI visuals, but still useful, especially with Toolbar and Parameters properties:
How does it work in the background?
Since the visual is fully responsive in terms of cross-filtering, let’s check what happens if I change the slicer values:
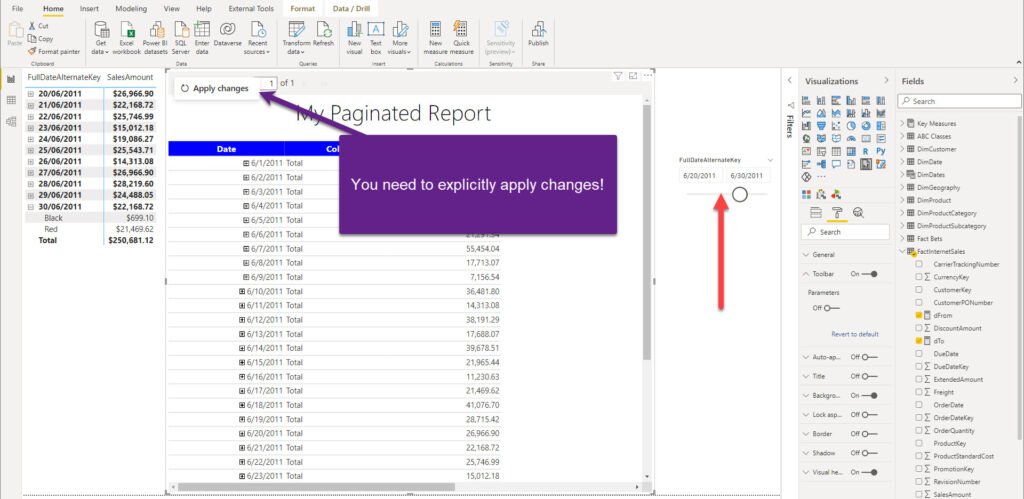
As you would expect, Power BI visual immediately reflects the changes, but for the Paginated report visual nothing changed. By default, you need to explicitly click on this Apply changes button for new slicer values to be propagated to an underlying data source. You can change this behavior by enabling Auto-apply filters in the Format pane, but I would suggest not doing it, as the default setup was specified with query reduction in mind. We will come soon to explain what is going on in the background when you change the slicer values…
So, I was curious to see what happens under the hood when you render paginated reports within Power BI and how the data is being retrieved. Let’s first launch DAX Studio and capture the queries generated by Power BI:
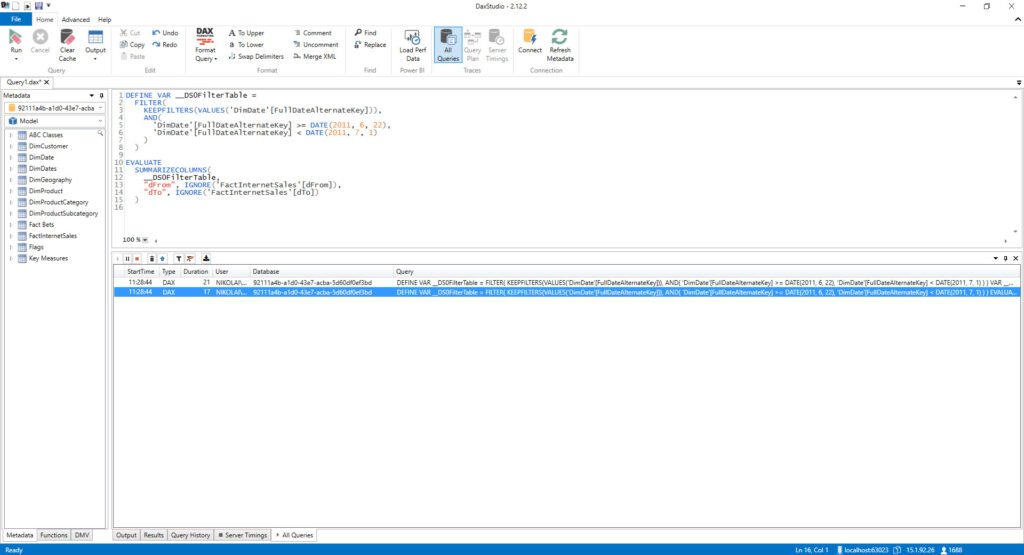
Hm, that’s strange, as there is no SQL code generated, and I would expect to see something like a SQL statement. This query basically calculates only our measures for dFrom and dTo parameters. So, I’m turning on a good old SQL Server Profiler to check what is really going on down there.
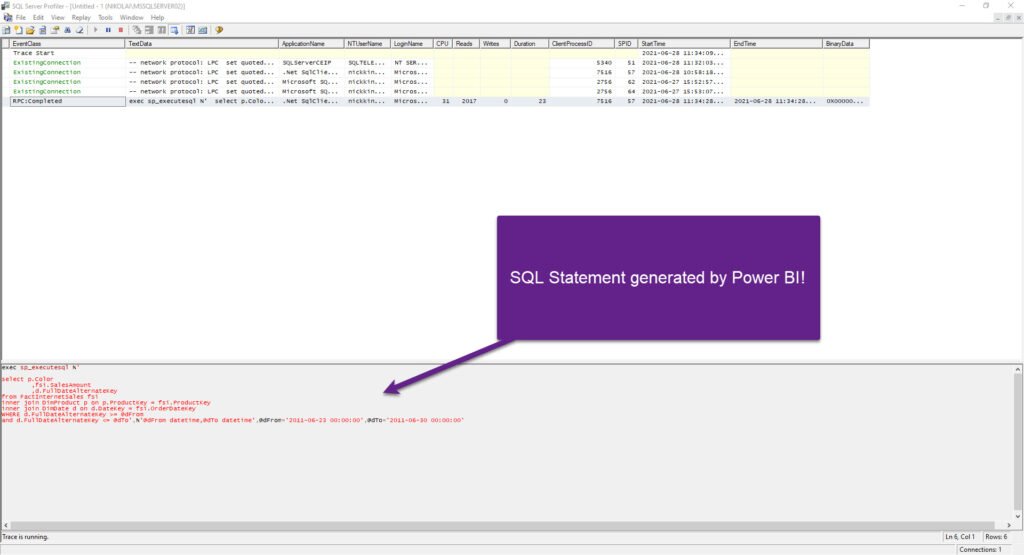
And here it is! This is the SQL statement that retrieves the data from the AdventureWorksDW2017 database. Looks familiar? Yes, exactly, that’s the query we’ve used to create our original dataset for the paginated report! However, Power BI generated a dynamic SQL statement, wrapping our original query with parameters grabbed from the Power BI slicer (that’s the query we saw in DAX Studio)!
If I change the slicer values, we should see the new dynamic SQL query with different parameter values (I’ll set starting date to June 25th). Let’s check if that’s the case:
BAM! There you go! As expected, we have a new SQL statement – in fact, the base statement is the same, but parameter values were changed and a new dynamic SQL was generated and executed.
This leads to the conclusion that the Paginated Report visual works in a DirectQuery mode!
Exporting the data
Well, that was all nice, but I hear you asking: why do I need a Paginated Report visual in my Power BI report in the first place? I’ll publish our Power BI report that includes a Paginated report visual to a workspace and I’ll show you the use case.
Let’s imagine that one of the users’ requests is to export the data from the visuals.
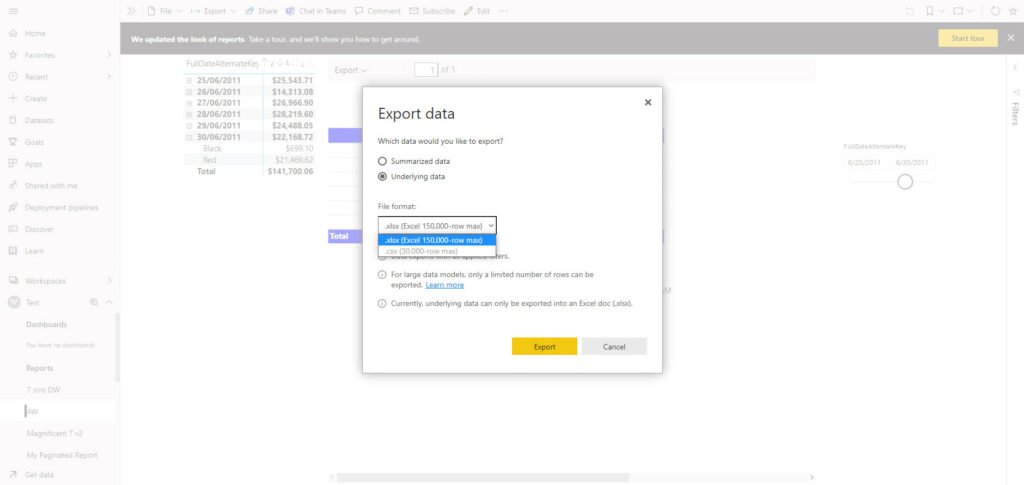
When you’re exporting the data from Power BI original matrix, the only available format is xlsx. On the other hand, if I click on Export within the Paginated Report visual, look what I have at my disposal:
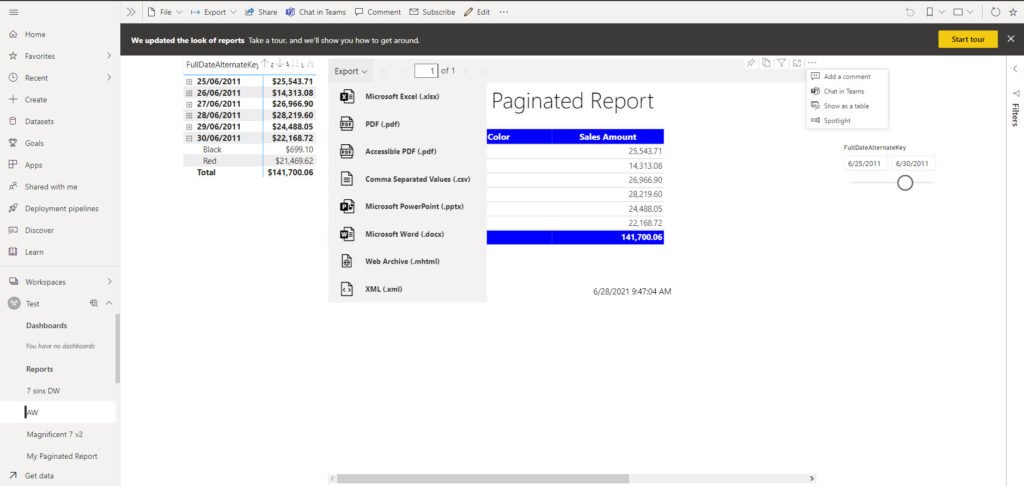
Wow! Not just Excel! I can export to a whole range of different formats, including pdf if I need to print out something (oh, yes, believe me, there are a lot of people around that still prefer to print their reports), or pptx in case I need it for my fancy PowerPoint presentation! Don’t forget why are Paginated reports called Paginated in the first place:)
Next, what happens if I have more data in my visual than can fit on one page and want to export it to pdf? Let’s check how the Power BI matrix renders to pdf:
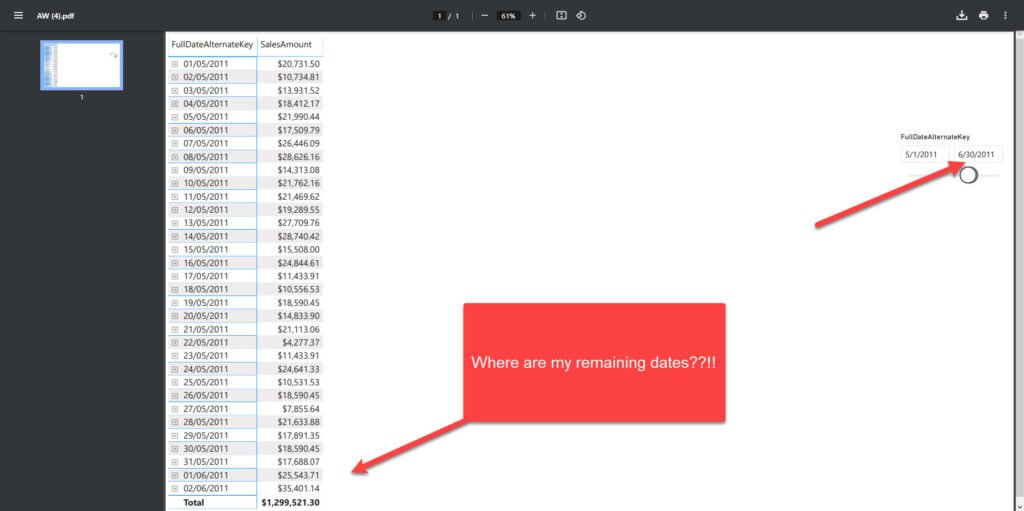
Oh, man, I’m missing data! Why is that? Where are my dates between June 3rd and June 30th? I saw them in my Power BI report. Yes, you did. But, you can scroll the table in the Power BI report, and you can’t scroll the image in pdf!
Let’s check what happens if we export data from the Paginated Report visual:
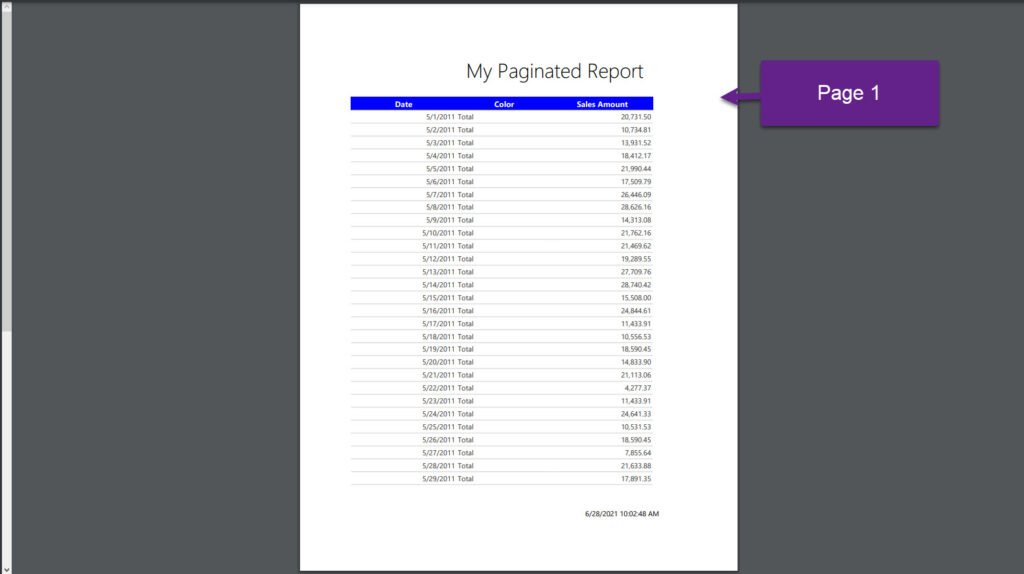
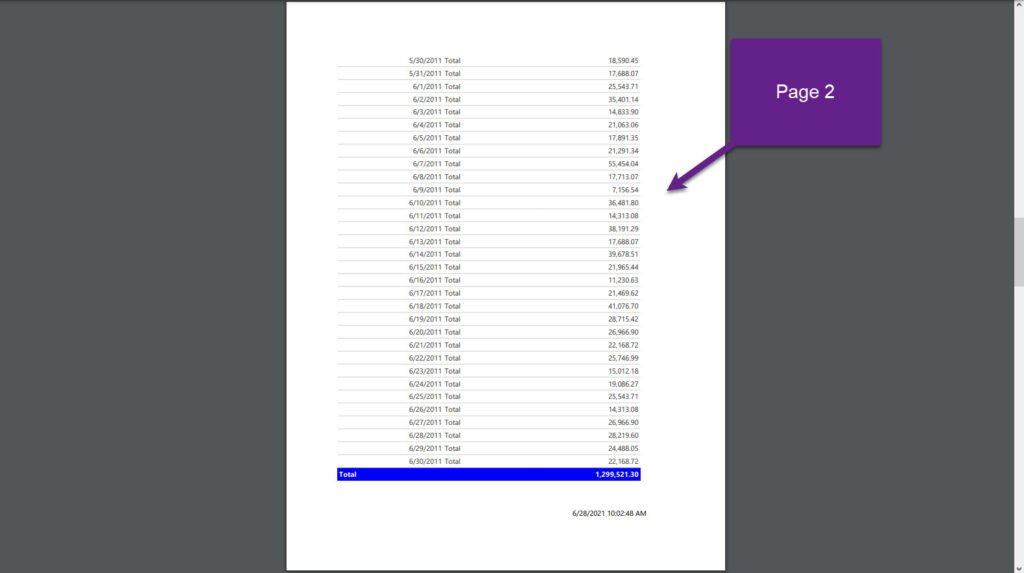
Oh, how nice and clean that looks!
Conclusion
The possibility to render Paginated Report directly within Power BI report is an immense addition to the already wide range of capabilities that Power BI offers. Having another (very powerful) tool under your belt can only increase the business value your reporting solution provides.
There will always be users that insist on pixel-perfect, print-friendly data, and Power BI on its own couldn’t address these requests properly. But, now, by integration of mature and established technology, such as Paginated reports, you can satisfy all requests from within a single location, even applying all the filters to the data at once!
Despite some limitations, I believe that the Paginated Report visual is one of the greatest improvements in Power BI recently!
Thanks for reading!
Last Updated on April 27, 2023 by Nikola


Bibin
Thanks for the detailed explanation
Georgi
Great post, Nikola! I am playing with this new visual now to build a case for one of my customers and everything looks perfect until I publish the report to the service. Then it says that the report couldn’t access the data source and it doesn’t render. Have you stumbled upon such issue? I am thinking it might be because the source for my paginated report is an SSAS tabular database but then again, it doesn’t make sense to work in PBI Desktop and fail in the service.
Nikola
Thank Georgi! Are you using Live Connection, or Import mode?