

In my previous blog post, I’ve explained how you can display images and icons on the axis and in the slicers, leveraging a very simple technique using UNICHAR() DAX function. Now, I wish to expand on that, and show how you can create ratings visual, using simple DAX! Let me be immodest and say – using this trick you can freely say that you create your own custom visual!
Setting the stage
As in my previous post, I’ll use a dataset related to a support agent interactions with the customers – as a reminder, agents communicate with the customers via chats, emails and phone calls, and after the interaction is completed, customer can fill the survey and express her/his opinion. Customer is being asked to answer to three questions:
- Resolution – was my problem resolved by the support agent?
- Satisfaction – am I satisfied with the resolution?
- Recommendation – would I recommend the company’s services to others?
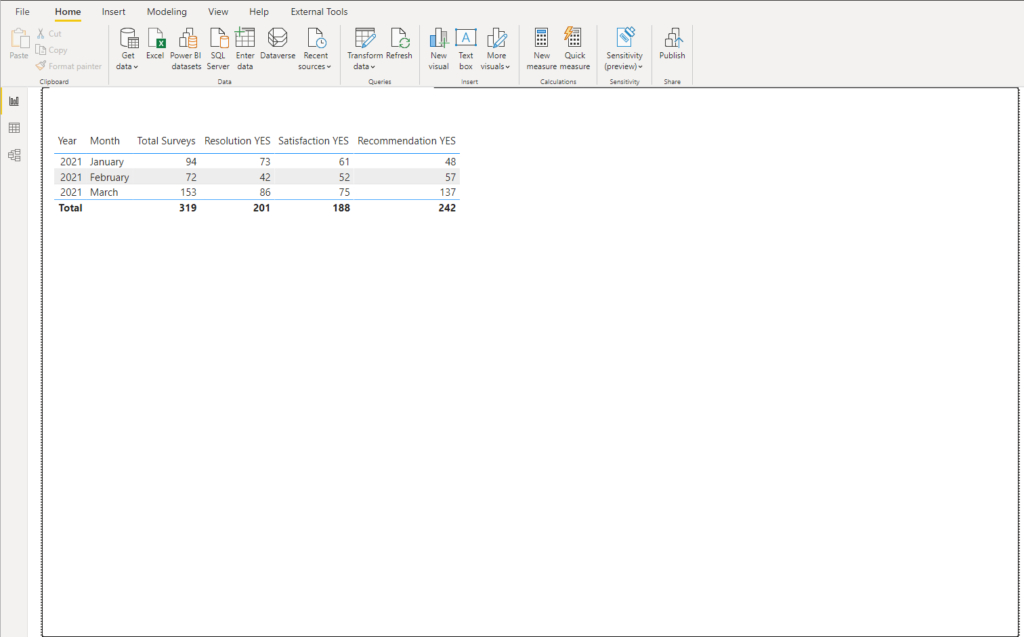
I’ll use the same dataset as previously, but focusing on surveys results only. Here is the raw data imported in Power BI:

Let’s first try to get some insight from this dataset – for example, how many customers were satisfied with the service, and how many of them would recommend company’s services. I’ll go and create three measures that will count surveys with positive response:
Resolution YES = CALCULATE(
                        COUNT(Surveys[Interaction ID]),
                        Surveys[Resolution] = "Y"
                        )

Satisfaction YES = CALCULATE(
                        COUNT(Surveys[Interaction ID]),
                        Surveys[Satisfaction] = "Y"
                        )

Recommendation YES = CALCULATE(
                        COUNT(Surveys[Interaction ID]),
                        Surveys[Recommendation] = "Y"
                        )
And if I drag these measures to my report, I can get some, at least basic, insight into the customer’s satisfaction:
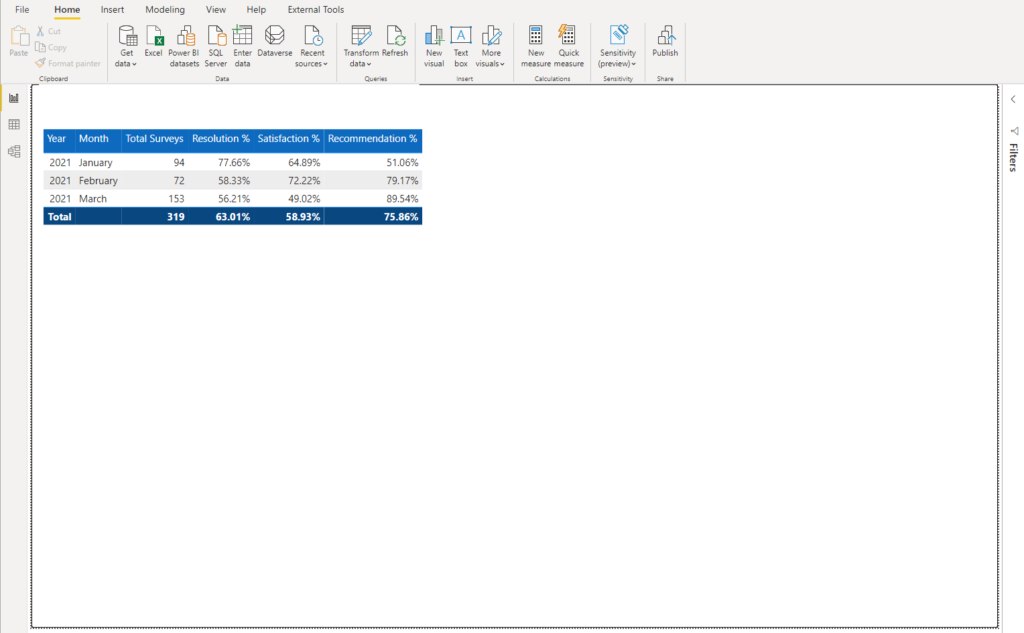
Not bad, but the first question that business will ask is: what percentage of customers were satisfied with our service? So, let’s go and create measures to calculate percentages of positive answers:
Resolution % = DIVIDE([Resolution YES], [Total Surveys],0)

Satisfaction % = DIVIDE([Satisfaction YES], [Total Surveys],0)

Recommendation % = DIVIDE([Recommendation YES], [Total Surveys],0)
Don’t forget to format these measures as Percentage:)
And, after I’ve formatted my table, the report looks really nice:
Push the user experience to a new level
Ok, that serves the purpose, and report consumers can quickly see the percentage of satisfied customers. However, what if I want them to “feel” the rating experience – you know those nice stars on Amazon, Netflix, etc. showing you the ratings of the product. Power BI doesn’t offer ratings visual out-of-the-box. You can grab it from the App Source Marketplace (at least it existed there previously, I guess it’s still available), but…
What if I tell you that you can create a ratings visual yourself by writing some simple DAX?!
Let’s pull up our sleeves and start working on it. The idea is to display percentages as the stars in our report. Last time, we’ve created a column of icons, containing their Unicode values, as placeholders. This time, we want to build a measure, to express the numbers behind our customers’ satisfaction. Again, we will take advantage of UNICHAR() function, but in a slightly different manner.
Here is how it should work: for each decade of a percentage value, I want to show one star – simply said, if the percentage value is, let’s say, 63%, I will show 6 stars…If the value is 72%, I’ll display 7 starts, and so on. Let me show you how can we achieve this.
Percentages in my table are nothing more than decimal numbers, represented as a percentage. That means, 63.01% is essentially 0.63 (if we cut it to two decimal places), 58.93% is 0.59, etc. Now, I will duplicate these measures, but I’ll leave them formatted as decimal numbers:
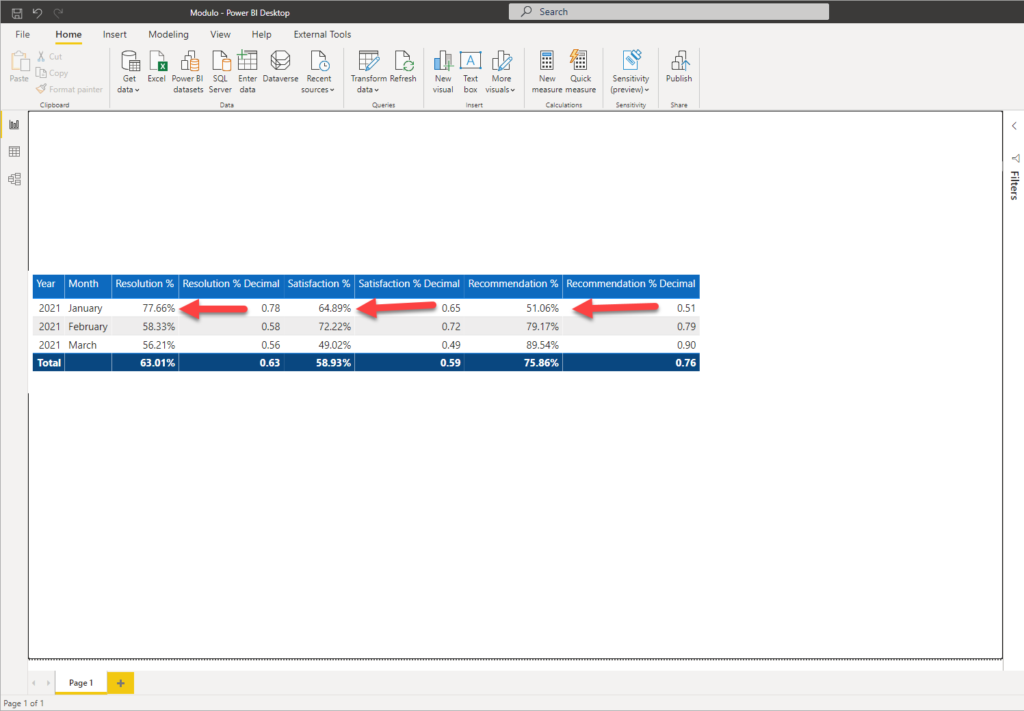
My table now shows both decimal values and percentages of the customer’s responses. I will now use UNICHAR() function to show the star symbol in my table. But, in order to display the proper number of stars – remember, 53% is 5 stars, 63% is 6 stars, etc. – I’ll have to perform some modifications on my measure.
I will multiply the result by 10, so 0.78 will become 7.8, 0.56 will become 5.6, and so on. Then, I can retrieve the whole number value from the result and set the appearance of the star symbol!
Resolution % Decimal Multiplied = [Resolution % Decimal] * 10
I will now use REPT() DAX function, which basically repeats the defined text, as many times as you specify in the second argument of this function. In my case, I wrote my measure like this:
Stars v1 = REPT(UNICHAR(11088),[Resolution % Decimal Multiplied])
Let me stop for a second and explain what is so special about this measure: it will repeat the first argument, which is unichar representation of the Unicode value 11088, times of the number of decades in our percentage value. How cool is that!
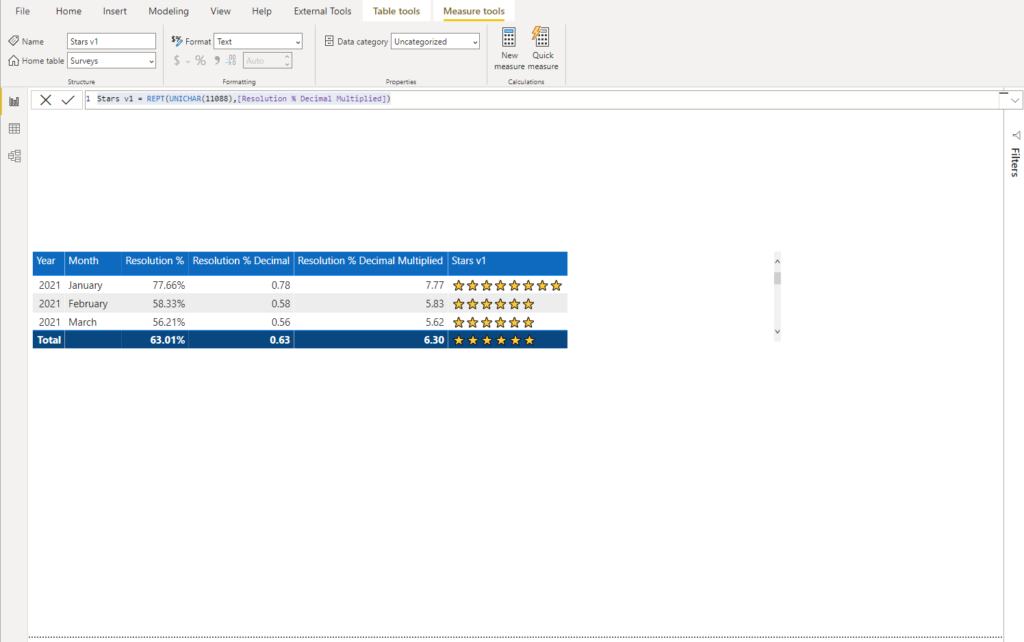
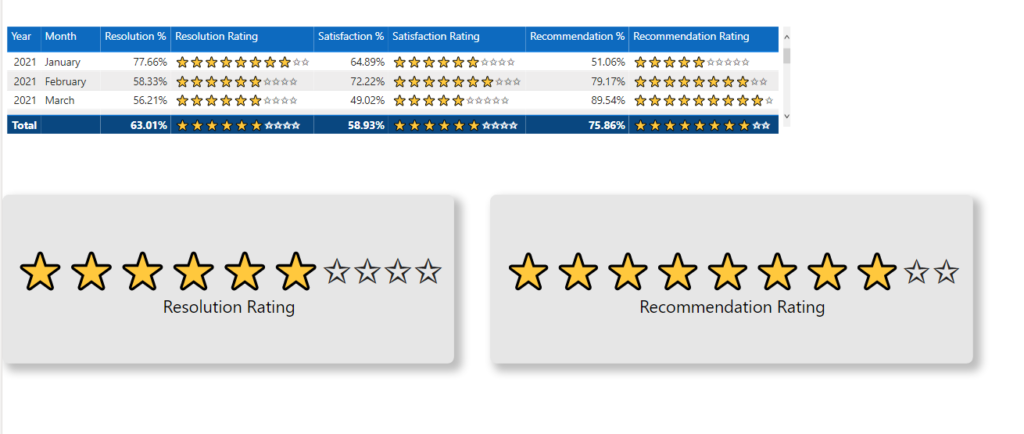
As you see, the function was “smart” enough to round number of stars as you would expect – therefore, 77.66% is represented as 8 stars, while 58.33% and 56.21% are displayed with 6 stars.
That was really awesome! But, what if I want to enable my users to immediately spot the ratings, without needing to count the stars. In other words, I want to display the maximum available value (which is 10 stars in our case), and then, depending on the percentages, some stars will stay empty. To simplify, if the percentage value is 77.66%, I want to display 8 yellow stars and 2 empty stars (same as Amazon, hehe).
Let’s go and write our final measure:
Stars v2 = [Stars v1]&(REPT(UNICHAR(10025),10-[Resolution % Decimal Multiplied]))
So, what do we have here: the first part of the measure is exactly the same, as we want to display our positive stars. But, then, the magic happens: as REPT() function works with text values, we can simply concatenate the other part – and, in this part, we are displaying unichar symbol of the Unicode value 10025 (empty star), and then we want to repeat it as many times as it is the value of subtraction between 10 (which is the max value of the stars) and the number of our “positive” stars – so this remaining number of times will show the empty star symbol.
Pretty awesome, isn’t it?
Conclusion
As you may conclude looking at the illustration above, we’ve managed to do it! We created a custom visual for displaying ratings, using DAX only!
I will repeat again: Power BI is an awesome tool, because it gives you the amazing amount of flexibility to tell your data story in multiple different ways. With little creativity and simple tweaking here and there, you can create an unforgettable experience for your users.
In this article, I’ve shown you how you can achieve (im)possible and create your own custom visual by writing a few lines of DAX code!
Thanks for reading!
Last Updated on July 8, 2021 by Nikola


Vinay B N
Wow! This is mind-blowing.
bschobs
This is great!!!