By introducing Azure Synapse Analytics in late 2019, Microsoft created a whole new perspective when it comes to data treatment. Some core concepts, such as traditional data warehousing, came under more scrutiny, while various fresh approaches started to pop up after data nerds became aware of the new capabilities that Synapse brought to the table.
Not that Synapse made a strong impact on data ingestion, transformation, and storage options only – it also offered a whole new set of possibilities for data serving and visualization!
Therefore, in this series of blog posts, I will try to explore how Power BI works in synergy with the new platform. What options we, Power BI developers, have when working with Synapse? In which data analytics scenarios, Synapse will play on the edge, helping you to achieve the (im)possible? When would you want to take advantage of the innovative solutions within Synapse, and when would you be better sticking with more conventional approaches? What are the best practices when using Power BI – Synapse combo, and which parameters should you evaluate before making a final decision on which path to take.
Once we’re done, I believe that you should get a better understanding of the “pros” and “cons” for each of the available options when it comes to integration between Power BI and Synapse.
Special thanks to Jovan Popovic and Filip Popovic from Microsoft, who helped me understand key concepts and architecture of Synapse
- Power BI & Synapse Part 1 – The Art of (im)possible!
- Power BI & Synapse Part 2 – What Synapse brings to Power BI table?
- Power BI & Synapse Part 3 – Keep the Tradition!
- Power BI & Synapse Part 4 – Serverless SQL: How much will it cost me?

If you carefully followed this blog series (and if you didn’t, shame on you, go back and read the previous four articles), maybe you remember that I refer to Synapse Analytics as a Swiss knife for your data.

As Microsoft introduced Synapse Analytics as a “one-stop-shop” for all data-related workloads, in the final part of the blog series, let’s see how Azure Cosmos DB fits into this concept.
For those of you who are not familiar, Cosmos DB is Microsoft’s NoSQL database solution. Going back to basics and explaining the difference between traditional relational databases and non-relational (NoSQL) databases is out of the scope of this article, but if you’re interested to get a better understanding before proceeding with reading this article, you can refer to this very comprehensive explanation.
Cosmos DB is not optimized for analytic workloads!
This is the most important thing to keep in mind when building reporting solutions over data coming from a Cosmos DB.
There are a dozen challenges to face if you plan to use non-relational databases as a direct source for your analytic workloads. Cosmos DB containers are internally stored similar to traditional OLTP systems (indexed row-based), that allow fast read and write operations.
Once your dataset becomes large, complex analytical queries start to be expensive in terms of provisioned throughput on the data stored in this format, which impacts the performance of transactional workloads.
In traditional scenarios, operational data was extracted to a separate data layer (data warehouse or data lake), which was later used for analysis. However, this segregation between analytical storage and operational data causes additional latency, because the ETL processes need to run less frequently to minimize the impact on transactional workloads.
Additionally, however strange it sounds, “flexibility” in Cosmos DB can potentially be a problem! Cosmos DB allows specifying different data types for each row – and that “freedom” can cause immense overhead when you need to create a reporting solution over such a portion of data!
How Synapse can help in conquering the Cosmos DB?
So, what should we do if our data is stored in a Cosmos DB, and we want to run different reports on top of it? Let’s see what benefits Synapse Analytics can bring in those scenarios.
Before you include Synapse in the loop, you should enable analytical store on the Cosmos DB container. That way, groups of values of each field can be serialized together, which dramatically improves the query performance over large data sets.
Now, the Azure Synapse Link for Cosmos DB comes into the scene. Using this feature (which is still in preview at the moment of writing), you can run near real-time analytics over operational data in Cosmos DB.
Synapse Link targets directly Analytical column-store within Cosmos DB, so that your operational workload is not being affected with analytic queries.
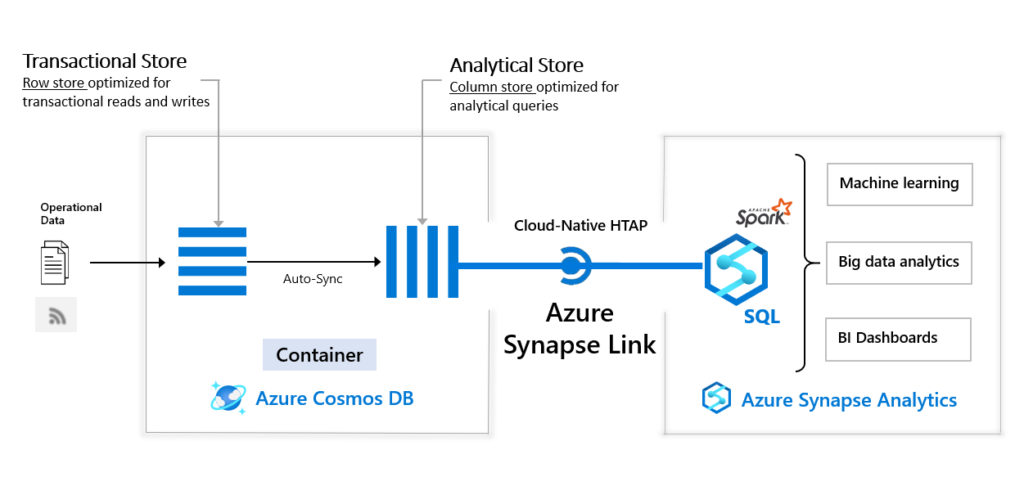
So, similar to previous scenarios, when we were creating views over CSV and PARQUET files, using plain T-SQL in Synapse Serverless SQL pool, we can do similar things with data coming from the Cosmos DB!
Connect Power BI directly to Cosmos DB
If you don’t plan to use Synapse Link, you can also connect to your Cosmos DB data directly from Power BI. However, if you recall from the beginning of this article, when I emphasized that Cosmos DB is not optimized for analytic workloads, there are many possible pitfalls if you opt to use this direct way of querying Cosmos DB data.
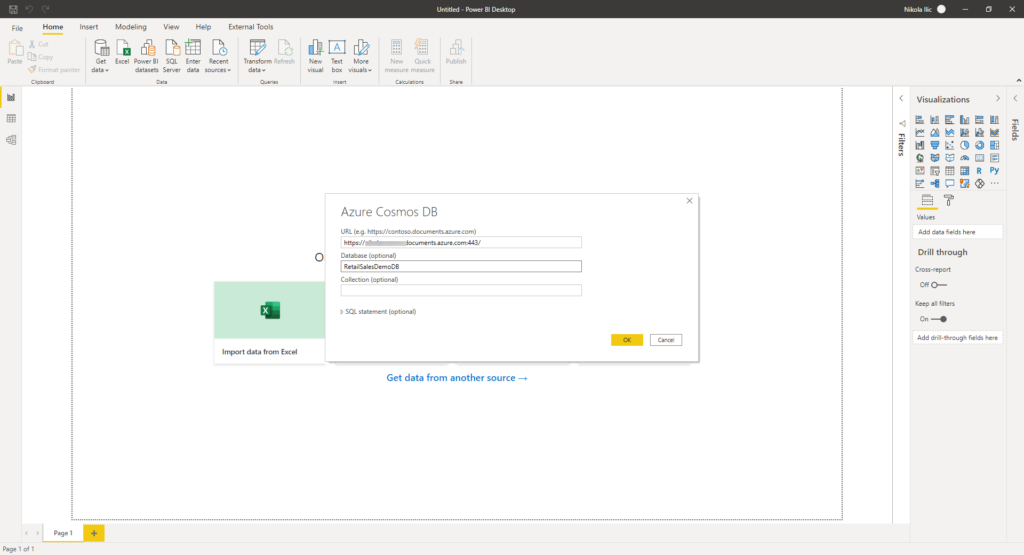
For this demo, I’m using sample data for Retail Sales. You can check all the details about how to import this data set into the Cosmos DB in this article.
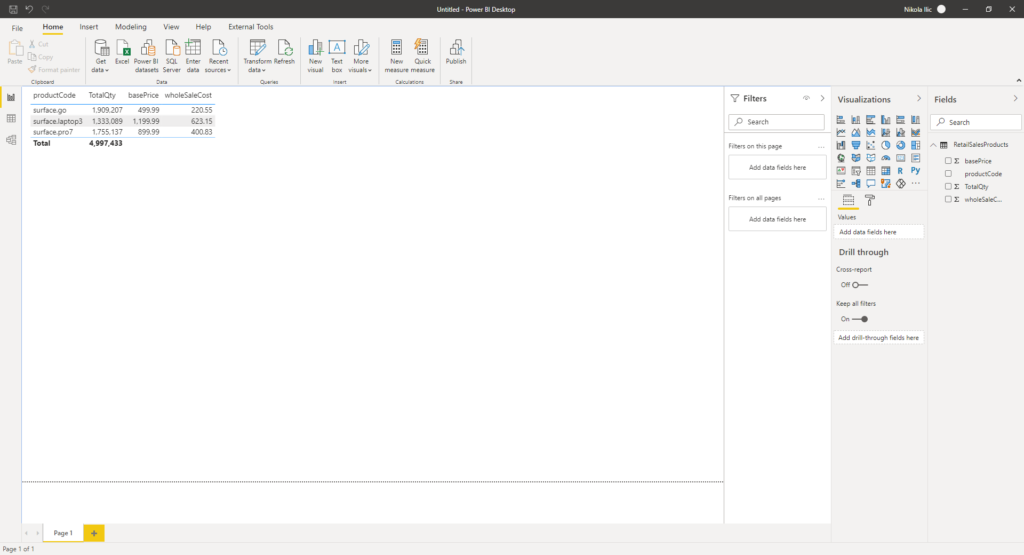
Let’s say that we want to display the total sales quantity per product, but also to include product base price and whole sale cost, which are not accessible directly from the RetailSales table. In other words, I need to import both “tables”, or better to say, containers (Products and RetailSales) in Power BI, in order to be capable to achieve my goal:
Now, these are extremely small tables, but it still took some time to load the data into Power BI. I’ve had to write a basic explicit measure Total Qty, which is just a simple SUM over Quantity column from the RetailSales table.
Data refresh took around 40 seconds, and there are ~20.000 rows in the RetailSales table. That’s because I’m using minimum throughput (400 RU/s), but scaling that out would cost me more… Now, imagine how long would it take for a fairly large data set of, let’s say, few million rows to refresh, and how it would affect your operational workloads.
Use Synapse Link to build virtual layer over Cosmos DB data
By using Synapse Link, you can build a virtual layer within Synapse Analytics, and prepare your data before consuming it with Power BI.
Before I show you how it’s done, just an important disclaimer here: in my example, I’m using SQL API for Cosmos DB (not Mongo DB API):
I can simply create a view, that will perform my calculation in advance:
CREATE CREDENTIAL nikolacosmos
WITH	IDENTITY = 'SHARED ACCESS SIGNATURE',
		SECRET = '<Your Account Key>'
GO

DROP VIEW IF EXISTS RetailSalesProducts
GO

CREATE VIEW RetailSalesProducts AS

WITH Products AS(
SELECT TOP 100 productCode
		,basePrice
		,wholeSaleCost
FROM OPENROWSET(PROVIDER = 'CosmosDB',
                CONNECTION = 'Account=nikolacosmos;Database=RetailSalesDemoDB;',
                OBJECT = N'Products',
		SERVER_CREDENTIAL = 'nikolacosmos'
)
WITH (productCode varchar(20), basePrice DECIMAL(10,2),wholeSaleCost DECIMAL(10,2))
AS Products
            )

SELECT Products.productCode
	,Products.basePrice
	,Products.wholeSaleCost
	,SUM(Sales.quantity) TotalQty
FROM OPENROWSET(PROVIDER = 'CosmosDB',
                CONNECTION = 'Account=nikolacosmos;Database=RetailSalesDemoDB;',
                OBJECT = N'RetailSales',
	        SERVER_CREDENTIAL = 'nikolacosmos') AS Sales
INNER JOIN Products on Sales.productCode = Products.productCode
GROUP BY Products.productCode
	,Products.basePrice
	,Products.wholeSaleCost
GO
Let me stop here shortly, as I really consider this as an astonishing feature! So, I’m writing plain T-SQL, performing joins, grouping, aggregating…all in one statement, to query different containers from the NoSQL database! What??!! Yes, looks insane, but it’s true!
Instead of inlining credentials in every single call of the OPENROWSET function, you can define a credential on a server level, enter the key value within the CREATE CREDENTIAL statement, and then just reference this already created credential as many times as you need.
Just one more thing to keep in mind: your database collation in Synapse SQL should support UTF-8 characters. Therefore, if you are creating a new database, you can set collation as part of the CREATE DATABASE statement, or if you already have an existing database, you can specify collation on it, using the ALTER DATABASE statement:
CREATE DATABASE mydb
    COLLATE Latin1_General_100_CI_AS_SC_UTF8;

ALTER DATABASE mydb
    COLLATE Latin1_General_100_CI_AS_SC_UTF8;
If needed, I could also combine data from, let’s say, PARQUET file and Cosmos DB within one T-SQL view – how cool is that!
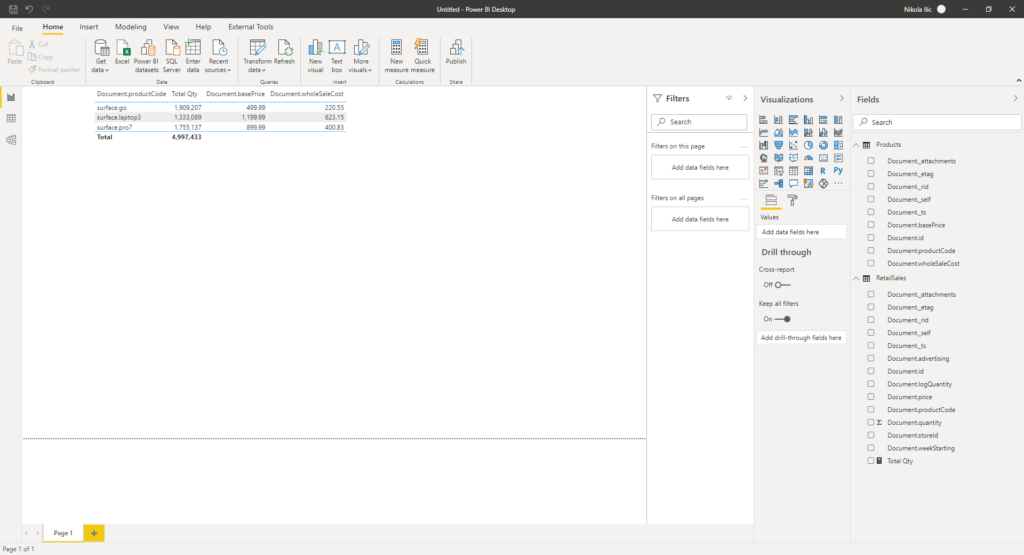
And now, I can expose only this view to my reporting solution to get exactly the same results as previously. Let’s head over to a Power BI Desktop again, and instead of using native connector for Cosmos DB, I will target my Serverless SQL pool within Synapse workspace (choose Azure SQL database as a data source in Power BI):

As you can notice, my data is already pre-aggregated and I don’t need to perform any single transformation in Power BI!
In this case, data refresh took ~12 seconds. And, no need to say that the memory footprint of this data model is way lower than in the previous scenario, when I imported both tables in the Power BI (1 MB vs 27 MB), as you can see in the following picture!
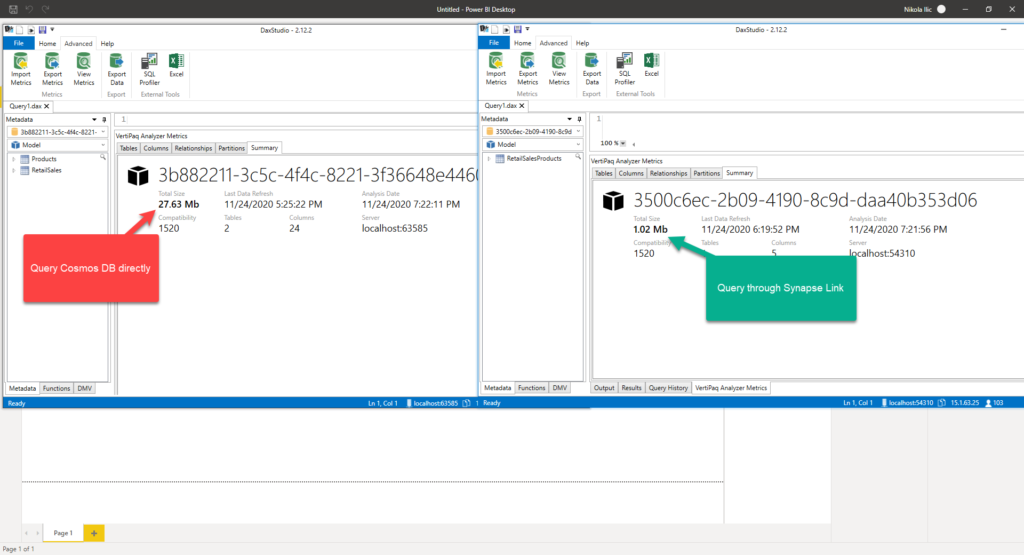
And, keep in mind that this is an extremely small data set. Imagine the difference over the large data volumes…
Conclusion
This was just a basic example on how you can leverage usage of the Serverless SQL pool in Synapse Analytics to perform complex analytical queries over data stored in non-relational database, writing well-known T-SQL syntax.
And it’s not just that your operational workloads will stay in-tact and unaffected by performing complex data analysis – moreover, in some scenarios, there is no need to perform “real” ETL processes, and your reporting solutions will be much more optimized if you prepare your analytic workloads in advance in Synapse Analytics, as you could’ve spotted in our example above.
Wrapping up the series…
In this blog series, I’ve tried to take a closer look into Synapse Analytics from multiple analytical perspectives and explore all different possibilities that this platform brings to a table for your data solutions.
My main goal was to examine different layers of integration between Synapse Analytics and Power BI, and I believe that after reading this series you’ve got a much better overview of the features, costs, best practices, and use-cases, once you decide to implement Synapse Analytics into your reporting solutions.
My general impression is – yes, Synapse Analytics can truly be your “one-stop-shop” when it comes to handling your data in the most optimal way. Just as a reminder – we have witnessed that you can build holistic, complex, and scalable data solution in one single place, nevertheless if your data comes from traditional relational data sources, semi-structured files (CSV, PARQUET, JSON), or even NoSQL databases.
Of course, always keep in mind best practices for specific use-cases, so you can always get the best possible performance, both in terms of speed and costs.
Before the end, let me just point the most important takeaway from this series: Synapse Analytics is constantly developing! New features are being regularly introduced, existing features are being improved, and that’s the key point that makes me optimistic regarding this platform.
So, stay tuned, I will follow up as soon as I spot something cool within Synapse Analytics again!
Thanks for reading!
Last Updated on November 27, 2020 by Nikola