By introducing Azure Synapse Analytics in late 2019, Microsoft created a whole new perspective when it comes to data treatment. Some core concepts, such as traditional data warehousing, came under more scrutiny, while various fresh approaches started to pop up after data nerds became aware of the new capabilities that Synapse brought to the table.
Not that Synapse made a strong impact on data ingestion, transformation, and storage options only – it also offered a whole new set of possibilities for data serving and visualization!
Therefore, in this series of blog posts, I will try to explore how Power BI works in synergy with the new platform. What options we, Power BI developers, have when working with Synapse? In which data analytics scenarios, Synapse will play on the edge, helping you to achieve the (im)possible? When would you want to take advantage of the innovative solutions within Synapse, and when would you be better sticking with more conventional approaches? What are the best practices when using Power BI – Synapse combo, and which parameters should you evaluate before making a final decision on which path to take.
Once we’re done, I believe that you should get a better understanding of the “pros” and “cons” for each of the available options when it comes to integration between Power BI and Synapse.
Special thanks to Jovan Popovic from Microsoft, who helped me understand key concepts and architecture of Synapse
- Power BI & Synapse Part 1 – The Art of (im)possible!
- Power BI & Synapse Part 2 – What Synapse brings to Power BI table?
Quiz question: do you have an idea whose successor is Azure Synapse Analytics? Yeah, I know, if you’ve read the first part of the series, the answer can be found over there. But, if you skipped that introductory part (yes, shame on you, go back there and start reading from the beginning), a quick answer would be: Azure SQL Data Warehouse.
Officially, Synapse Analytics was presented in late 2019 as a legitimate successor of SQL DW. However, before you easily come to the wrong conclusion that Synapse is just a “SQL DW rebranded”, you should keep in mind that Synapse is much more than just another “traditional data warehouse”. By including Serverless SQL pool and Apache Spark dedicated pool, Synapse essentially became a limitless analytics service for all kinds of different data workloads!
We scratched the surface in the previous part of the series, explaining how you can quickly leverage the Serverless SQL pool within Synapse in synergy with Power BI to get fast insights into the data that can reside out of the traditional data warehouse. Moreover, as you may recall, you don’t need to provision any resources – using plain T-SQL you can query the data directly from the Azure Data Lake Gen2!
You can also take advantage of using the Apache Spark analytic engine within Synapse, but that is out of the scope of this series of articles.
After integrating those two (Serverless SQL pool and Apache Spark pool) within Synapse, one can assume that the old, traditional data warehouse is dead…And, again, it would be a quick and wrong conclusion. There are still many scenarios and use-cases where a good old data warehouse would be an optimal solution.
Dedicated SQL pool – keep the tradition!
In this article, we will examine various workloads with relational data, that is being stored on the provisioned Analytic Engine (Dedicated SQL pool), so you can think, more or less, like we are dealing with a good old SQL Server in the background.
Truth to be said, Dedicated SQL pool is based on a different architecture, reaping the benefits of using MPP architecture:
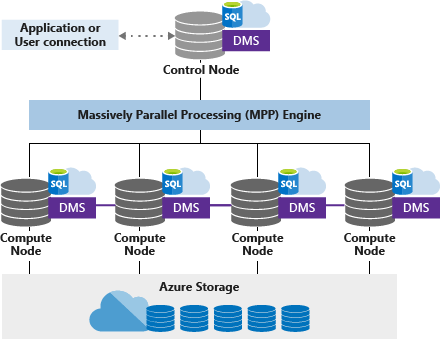
I’ll not go deep into details about MPP and how it works – I would just emphasize that this architecture enables enormous flexibility, since you are able to quickly scale-out your resources, depending on the current workloads’ volume and nature.
Of course, Synapse brings some additional potential performance gains, compared to an on-prem SQL Server, such as Result set caching and Materialized Views. Again, I’ll not go deep into details regarding these two features – if you’re interested in learning Materialized views in detail, I strongly suggest reading a series of articles on Niko Neugebauer’s blog. However, you should be aware of Materialized views, as we will use them in our demo here…
Stop talking – it’s DEMO time!
Now it’s time to get our hands dirty and evaluate different scenarios when using Synapse’s Dedicated SQL pool as a storage for the data that is being consumed by Power BI.
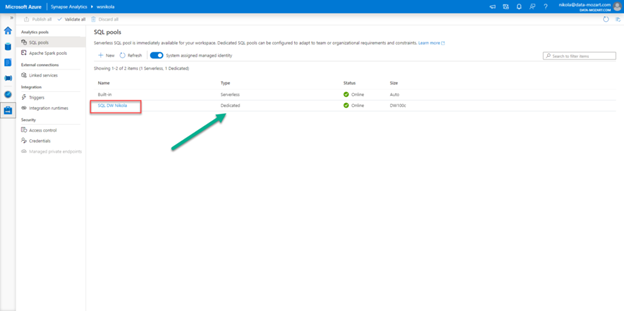
But, first things first. On the opposite of a Serverless SQL pool, that is created by default once you create your Synapse Workspace, a Dedicated SQL pool needs to be created manually. So, I’ve started with creating my Dedicated SQL pool, assigning default size (DW100c) to it:
As usual, when dealing with Power BI, I’m using a sample Contoso database for the demo. I’ve provisioned this database within my Dedicated SQL pool, and imported data for factOnlineSales table, and for two dimension tables: dimDate and dimProduct.

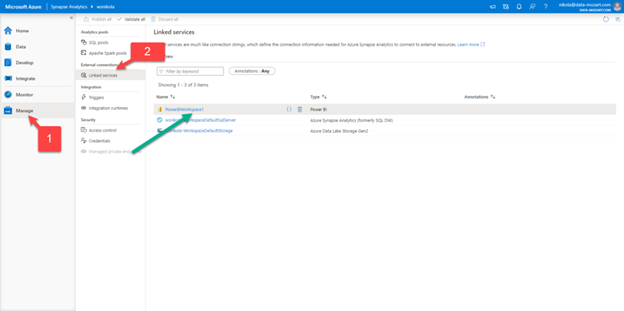
Now, under Manage option, and under Linked services, I’ve linked my Power BI workspace – this means I can immediately start developing my Power BI reports, straight from the Synapse Analytics Studio!
When I click on Develop, under Power BI, I see my workspace and available Power BI datasets and reports. There is nothing in there so far, so I will click on New Power BI dataset:

I will choose my Dedicated SQL pool as a data source and after that download the automatically created .pbids file. Once I open this file in Power BI Desktop, my data is ready for action!
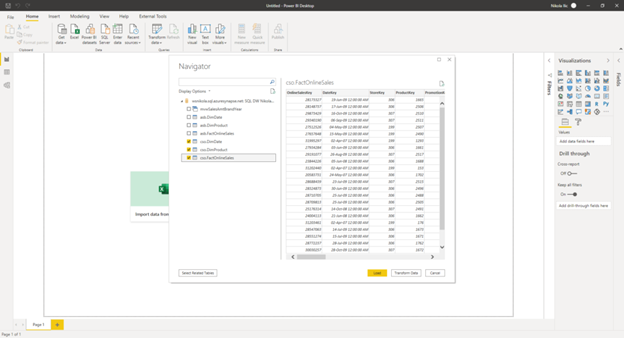
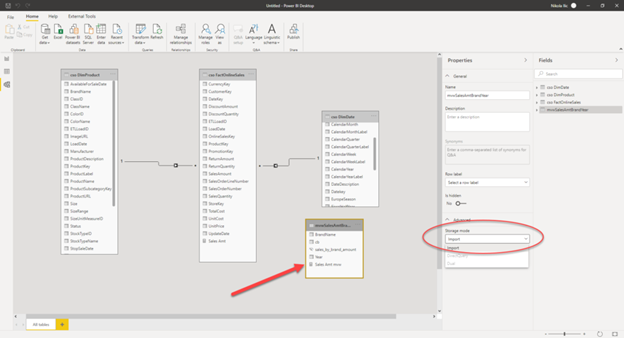
Now, in reality, my fact table has around 12 million rows, which is nothing special in terms of volume – I mean, Power BI should be able to cope with this without any problems. But, let’s pretend that our fact table has 1.2 billion rows, so importing the whole table on the existing granularity level is not an option. We will use DirectQuery just to demonstrate how you can leverage the integration of Synapse and Power BI to work with enormous volumes of data within a Dedicated SQL pool.
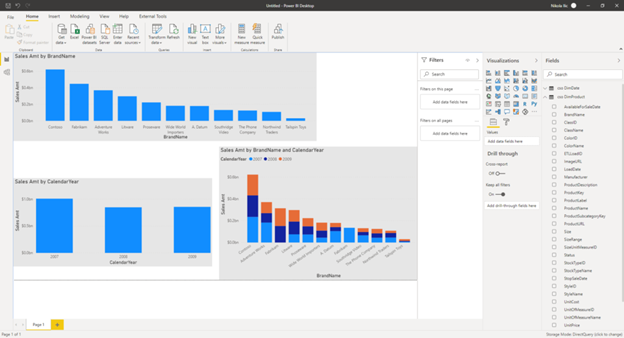
So, I’ve created an explicit measure for calculating the sum of Sales Amount, and put three simple visuals on the report canvas: one showing total sales amount per year, the other showing total sales amount per brand, and the last one showing sales amount broken down by both brand and year:
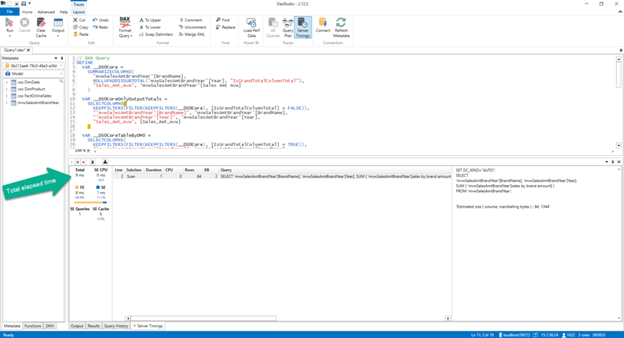
Now, I will connect to a DAX Studio, so I can get more insight into what is going on in the background. If I turn on Server Timings from the top ribbon, I can paste my DAX code and check the SQL query that was generated in the background, and the total time elapsed to retrieve the results:
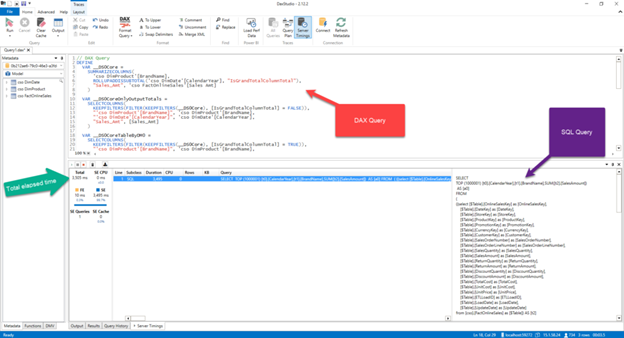
So, this works pretty much the same as with the SQL Server. Don’t leave now, I promise we will add some more ingredients to improve the metrics. Then, what can we do in order to speed up data retrieval?
The first, and the most important thing is: you need to know your analytic workloads! That means, if you know that there are a lot of queries targeting these three tables and requesting the same figures (sales amount per brand/year), you can do two things:
- Create an aggregated table and set it in Import mode, reaping the benefit of using the Composite model. This is the most desirable scenario, and you should tend to use it whenever your aggregated table can fit into the data model size within Power BI. Using this concept, your aggregated table will be stored in Power BI cache memory, optimally compressed, while your huge table with all the details will continue to reside in the Synapse Dedicated SQL pool
- Create a Materialized view in the Synapse Dedicated SQL pool. Essentially, you would also aggregate the data, but you will not import it in Power BI, as you will target this view using DirectQuery mode. A materialized view is nothing more than a virtual table – but unlike a “standard” view, that computes data each time you use it, a materialized view pre-computes, stores and maintains its data in a Dedicated SQL pool like a regular table! So, you’re getting a faster performance for your most frequent workloads, but as a trade-off, you’re paying the price for the additional storage
Now, I’ve created a Materialized view in my Synapse Dedicated SQL pool, using the following T-SQL code:
CREATE MATERIALIZED VIEW mvwSalesAmtBrandYear WITH (DISTRIBUTION=HASH(BrandName)) AS
SELECT  SUM(f.[SalesAmount]) AS [SalesAmount]
       ,p.[BrandName]
       ,YEAR(d.[DateKey]) AS [Year]
FROM    [cso].[FactOnlineSales] AS f
INNER JOIN    [cso].[DimProduct] AS p ON f.[ProductKey] = p.[ProductKey]
INNER JOIN    [cso].[DimDate]    AS d on f.[DateKey] = d.[DateKey]
GROUP BY p.[BrandName]
        ,YEAR(d.[DateKey])
Let’s go to Power BI Desktop and add this view to our data model, and switch our visuals to target the Materialized view for the required data. Now, if I check the Server Timings within the DAX Studio, I can notice significant improvement:

As you can notice, we got exactly the same numbers, within exactly the same visuals, 10x faster! And just because we had a pre-aggregated data in the Synapse Dedicated SQL pool.
One final thing to check is what would happen if we import Materialized view in Power BI:
And if I refresh the visuals, I’m getting the following results:
Instead of 3.505ms in the first run, my visuals are now being rendered in 9ms! I’ll let you do the math…In this final run, there is no “regular” SQL query in the window on the right, as now data is being stored and retrieved directly from the Tabular model in Power BI.
As I already mentioned, you could handle aggregations also within the Power BI Desktop Model view, but that’s a whole different topic, which is out of the scope of this series.
Here in this demo, I wanted to show you how you can seamlessly integrate Synapse Analytics Dedicated SQL pool and Power BI.
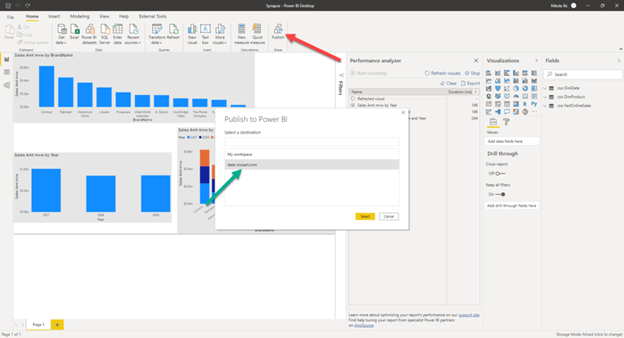
Once I’m done with my work in Power BI Desktop, I can publish the report to a Power BI workspace:
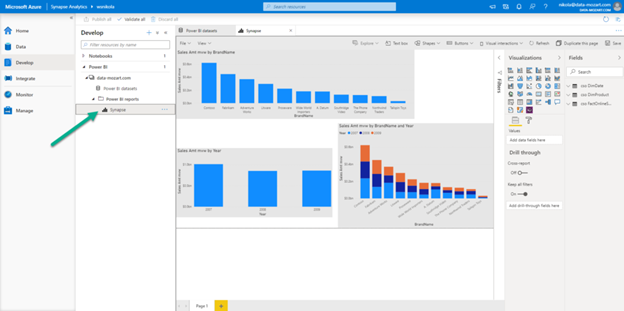
And, as you may recall from our previous demo, since I’ve linked my Power BI workspace to a Synapse Analytics Studio, I can access my report directly from there! Not just that, I can interact with the report, and if I want to make some changes, I can even save it directly from Synapse Analytics Studio! How awesome is that!
Again, let me emphasize the key takeaway from this blog series – when used together, Synapse and Power BI unlock indefinite possibilities for calibrating your data workloads!
Conclusion
In this article, we examined different ways of integration between Synapse Analytics and Power BI, in those scenarios when you are working with relational data, stored in a way typical for traditional data warehouses.
We proved that you don’t need to give up on tradition, even if you plan to switch your workloads to a Synapse. On the contrary, you can take advantage of it and build a modern data solution, based on established and decades-proven concepts of traditional data warehousing. You can refer to this article if you are interested to learn more about best practices when using a Dedicated SQL pool as a data source for your Power BI reports.
Beginning the next article, we will focus in-depth on different integration layers between Power BI and Synapse, in terms of handling semi-structured (data stored in files) and non-structured data (Azure CosmosDB), using Serverless SQL pool within Synapse Analytics.
Thanks for reading!
Last Updated on November 21, 2020 by Nikola