In this series of Power BI 101 articles, I’ll try to cover and explain different foundational concepts related to Power BI, such as data shaping, data profiling, and data modeling.
Understanding these concepts is essential in order to create optimal business intelligence solutions. Once you master these general concepts, you will be able to build scalable and flexible Power BI reporting solutions, that will add real business value to their existing environments.
In the previous article of the Power BI 101 series, I’ve explained what is data profiling, why you should pay attention to it, and how you can benefit when applying proper techniques for checking and enhancing the quality of your data.

Shape it, shape it, baby!
Data shaping is the phase that you should perform once you get familiar with your data, and become aware of possible pitfalls within the data you are planning to use in your business intelligence solution (I’ve intentionally used the term “Business Intelligence” instead of “Power BI”, as this is a general concept that should be used outside of Power BI solutions too).
In most simple words, data shaping is the process of consolidation of the data, BEFORE it becomes part of your data model. The key thing to keep in mind is the word: BEFORE! So, one would perform data shaping before the data goes into the report itself.
Data shaping can be done at different places, and, depending on where you apply data shaping techniques, at different points in time during the data preparation process.
WHERE should I perform data shaping?
First, let’s check WHERE data shaping can be done:
- Source Database – This is the most obvious choice and in most cases the most desirable scenario. It is based on traditional data warehousing principles of Extracting-Transforming-Loading (ETL) data.
In this scenario, you define what data you want to extract (not all data from the database is needed, and it’s usually not a good idea to import all the data). Then, you decide if your data needs to be transformed along the way, to better suit your reporting needs – for example, do you want to perform currency conversion, or do you need to conform city names (New York, NY, NYC).
Additionally, you should specify user-friendly names for your columns and attributes, and decide if you need to aggregate data before it’s loaded into a data model.
- Power Query – it’s the built-in tool within Power BI, that enables you to perform all kinds of transformations to your data. According to Microsoft’s official documentation, you can apply more than 300 different transformations, and that number constantly increasing!
For some data sources (like Excel files, for example), there is no option to transform data on the source side. Therefore, Power Query is the obvious choice for this, and many other “non-database” data sources.

The most important consideration when you perform different data shaping steps in Power Query is if the query folds! I will write about query folding in one of the separate articles, but at this moment, it is important to know just what query folding is.
In most simplified words, query folding is the process where Power Query “translates” your request to a single statement that the data source “understands”, making your requests more efficient to execute.
Understanding the concept of query folding is extremely important for the data shaping process. If you are working with relational databases’ data sources, you should then consider performing all your data shaping on the source side, and loading your data into Power BI in one single step (if possible from one single database object, like database view), instead of applying additional transformations after your data is loaded, as this can break query folding and make your data load/data refresh inefficient!
As a rule of thumb – you should push all data shaping and transformations as close as possible to a data source!
- Data model – the last, and definitely the most undesired option, is to perform data shaping on the data model itself. This is the scenario you want to avoid, and it is usually a consequence of inadequate and poor planning. That means, for example, you can create calculated columns using DAX, but you should be aware that it is not an optimal solution – calculated columns are additional overhead for the Tabular engine in the background, as they can’t be optimally compressed.
Power Query = Powerful Data Shaping
Now, as we have drawn a big picture and did an overview of data shaping in general, if you read this article, I assume you are interested in data shaping for Power BI specifically. Therefore, I want to explain Power BI data shaping in more depth.

As we previously learned, Power BI provides you with a powerful tool for performing data shaping tasks. Once you are in Power BI Desktop, you can click Transform data under the Home tab to open Power Query editor:

There are a whole bunch of available transformations to bring your data into optimal shape, such as renaming columns and tables, changing data types, removing columns, filtering rows, replacing values, promoting first rows to headers, pivoting/unpivoting columns, etc. We will focus on a few that you will probably use very often.
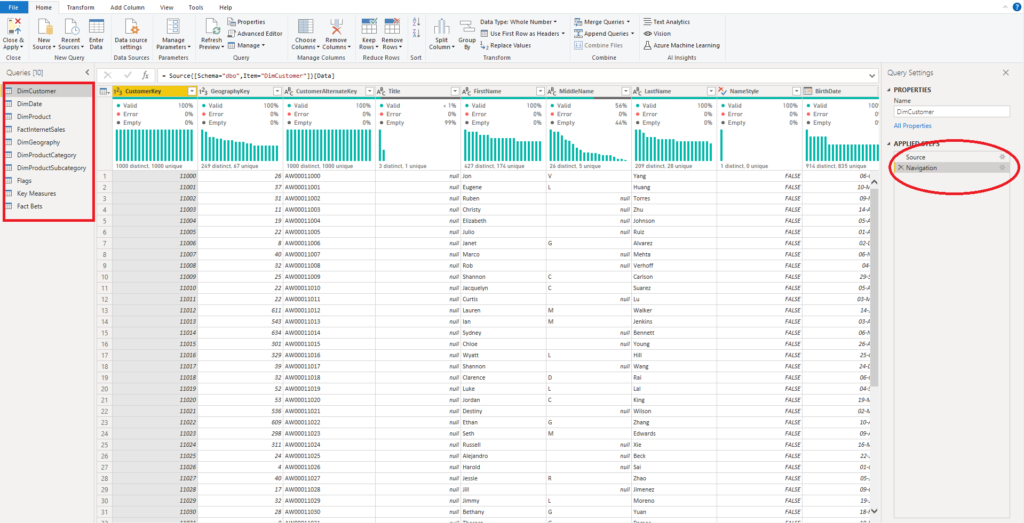
In the illustration above, on the left-hand side, you see a list of all tables/queries/functions from your data model, while on the right side you see all transformation steps applied on the specific table/query. Transformation steps are being recorded in the order you applied them, and that is important to keep in mind, because you should aim to apply similar transformations within one single step, instead of switching often between the transformations.
For example, if you want to filter the data from your columns, you should apply all filtering conditions in one single step:
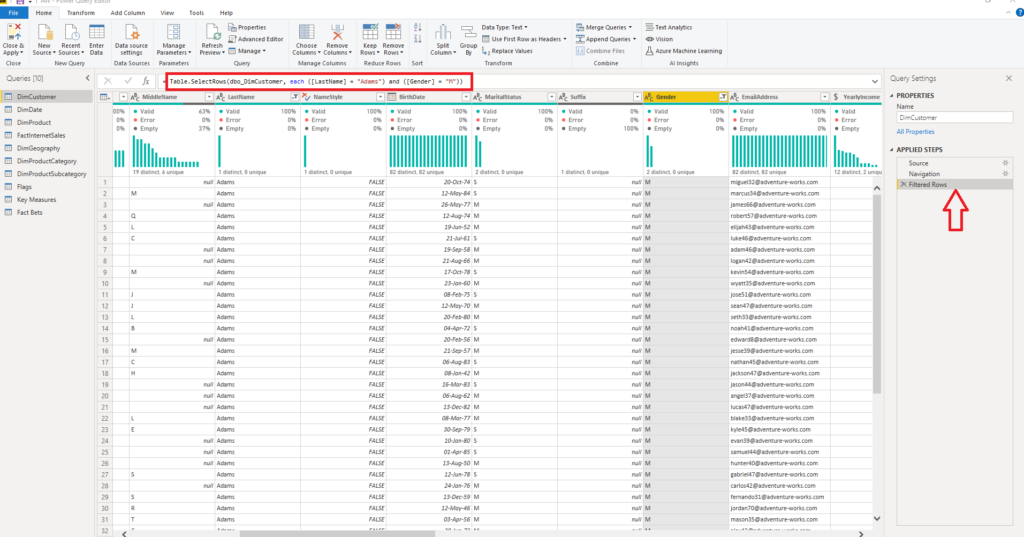
In the illustration above, I’ve filtered my DimCustomer table, to keep only customers with the last name Adams and the male gender. You can see that Power Query applied both those filtering conditions in one statement and consequentially created one transformation step on the left.
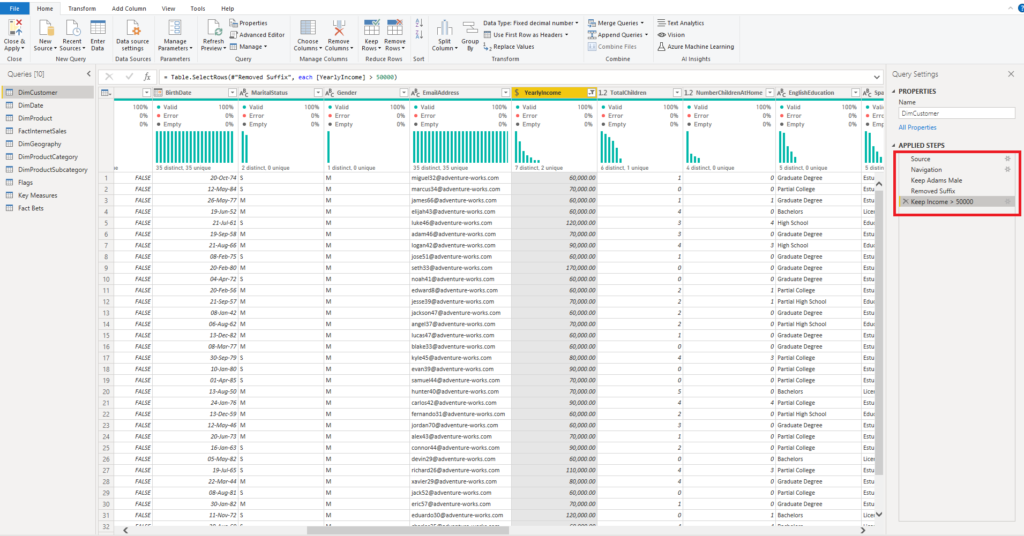
Now, imagine that I want to remove a column Suffix from my data model, and then I want to filter all male Adams customers with yearly income >50.000.

As you can notice, we now have an additional step for filtering the YearlyIncome column. And that’s a bad practice, which you should avoid. Whenever possible, apply all similar actions within one step, as that will improve the efficiency of your data loading/data refresh process.
Another bad practice that can be seen here is the naming of the transformation steps. It might not look that bad if you work on your own in the Power BI, and you have less than 10 transformation steps. But imagine the scenario when you see 30+ transformation steps, with names such as: Removed Columns1, Filtered Rows1, Changed Type1, Filtered Rows2, Removed Columns 2, etc. You would need to open every single step to determine which transformations had been applied!
Therefore, don’t be lazy, and rename each of the steps in a human-readable manner:
You must admit that it looks way more convenient now!
Frequently used transformations
As I already mentioned, the Power Query offers you more than 300 ways to shape your data. Of course, there is no way you would use all of them. Like in any other tool, there are some features that you are using more frequently than the others.
So, when it comes to Power Query, you can see the list of “most frequently used” transformations if you right-click on the specific column in your table:
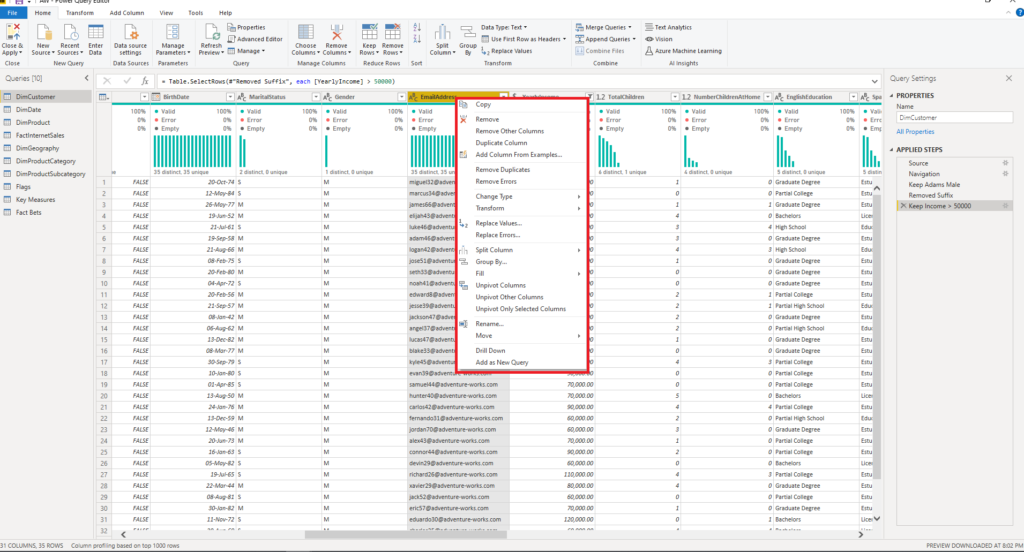
These options will do the job in 80-90% of situations, but in case you need to perform some advanced transformations, or even to handwrite M code to achieve your goal, here is the good news: you can also do that in Power Query!
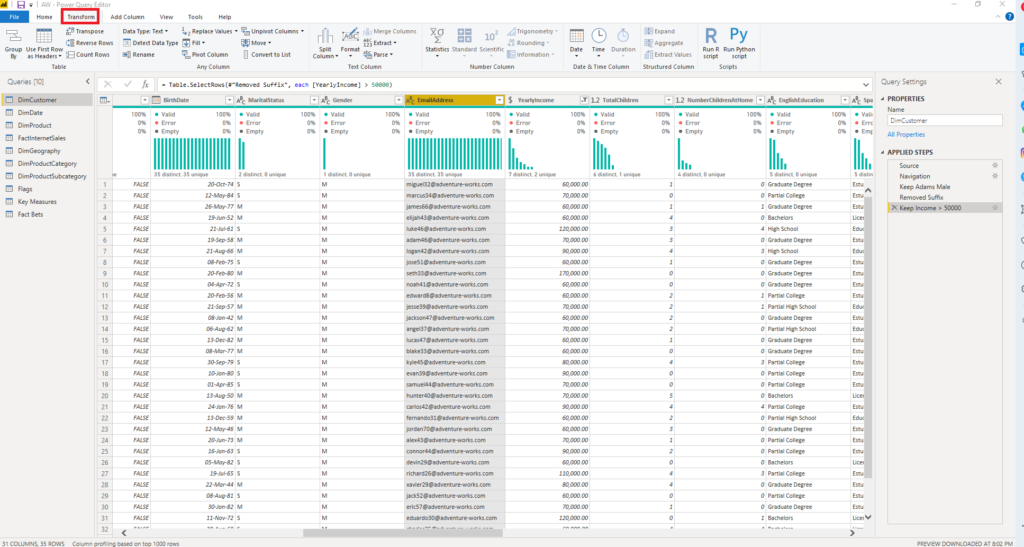
Transform tab offers a whole new range of advanced features, both in terms of data content manipulation (replacing values, formatting values, etc.), and data structure enhancement (pivoting/unpivoting columns, splitting columns, transposing table, etc.):
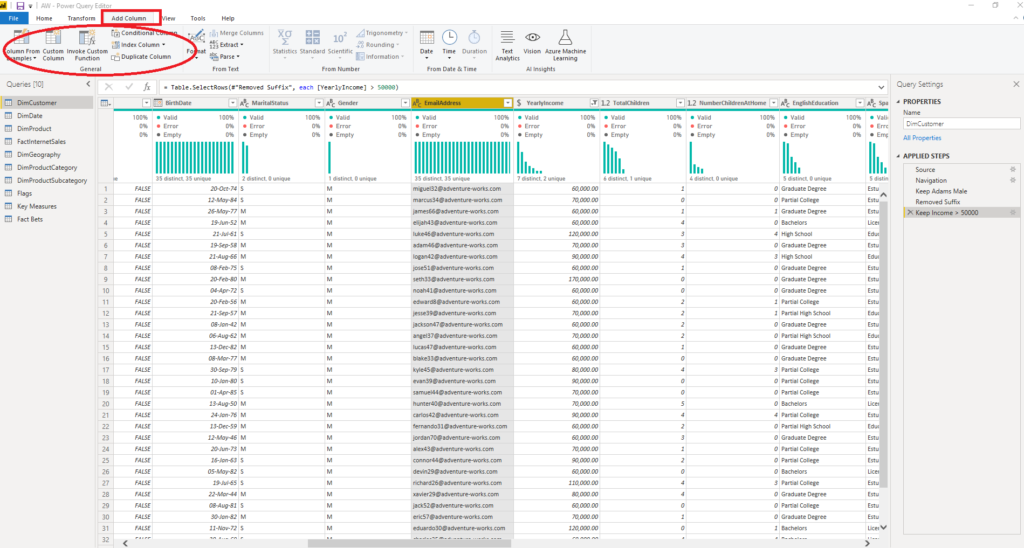
Let’s not forget the Add Column tab, which offers you a possibility to apply a whole bunch of different techniques to enhance your data model with new columns that can bring additional business value to your existing data model.
The best way to learn how specific Power Query transformations perform in reality is to – use them! Test, try and see which of the techniques and transformations satisfy your business needs in the most effective way.
Conclusion
Data shaping is one of the key concepts to be digested, in order to be able to create optimal data solutions. Understanding this concept and applying it in real-life projects, sticking with some of the best practices we examined in this article, will enhance your data models and help them become more robust, scalable, and reusable.
In synergy with data profiling and data modeling phases, proper data shaping provides substantial quality to your business intelligence solution, and Power BI reports as part of it.
Thanks for reading!
Last Updated on October 22, 2020 by Nikola