

Once upon a time, your old scary DBA walked into your office with a red-colored face and asked you furiously: “What the hell you’ve done with your Power BI report?! It killed all of our workloads!!!”
You knew why he was angry, even before he started screaming at you. It’s because of “that” report which uses DirectQuery because your users wanted “near real-time” data…
I’ve already written why you should reconsider using DirectQuery, and in which scenarios (maybe) it makes sense to go that path.
However, it appeared that your DBA is not that “bad” as you might think. He offered to help you in optimizing your most exhaustive SQL queries, and he just wants you to send him those queries…
Oh, wait, how can I send him SQL queries, when I don’t “see” them in Power BI?! Don’t worry, there are multiple ways to capture the SQL queries generated by the Power BI engine.
SQL Server Profiler – for old-fashioned folks!

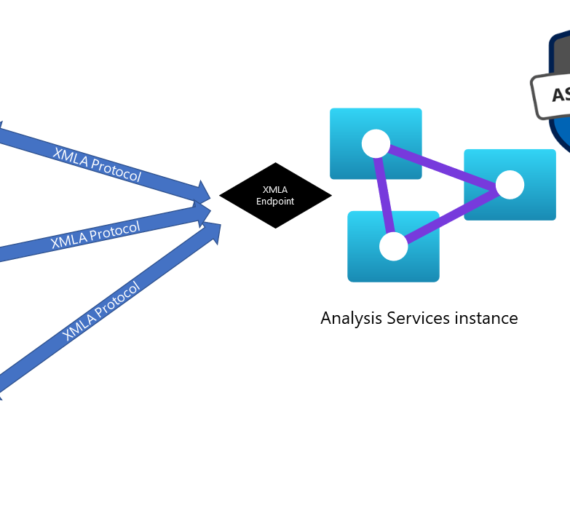
Before I show you how you can use good old SQL Server Management Studio (SSMS) and its built-in feature SQL Server Profiler, let me briefly explain what happens in the background: Power BI Desktop spins up a local instance of Analysis Service Tabular. So, you can trace this instance like any other event, using SQL Server Profiler.
As usual, I will use sample Contoso database in all of the examples.
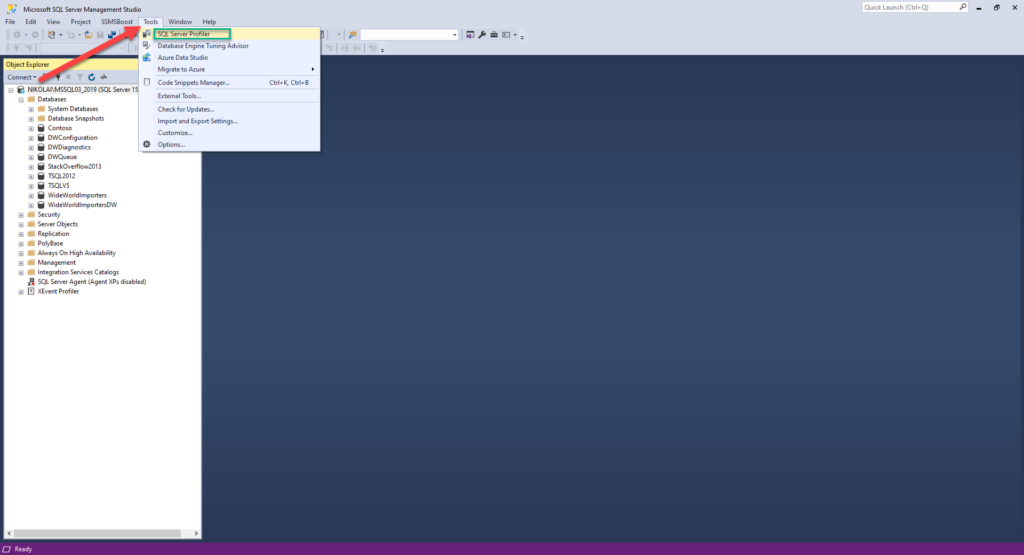
The first thing you want to do is to turn on SQL Server Profiler, under Tools bar in SSMS:
My Power BI report is fairly simple, it contains only three visuals:
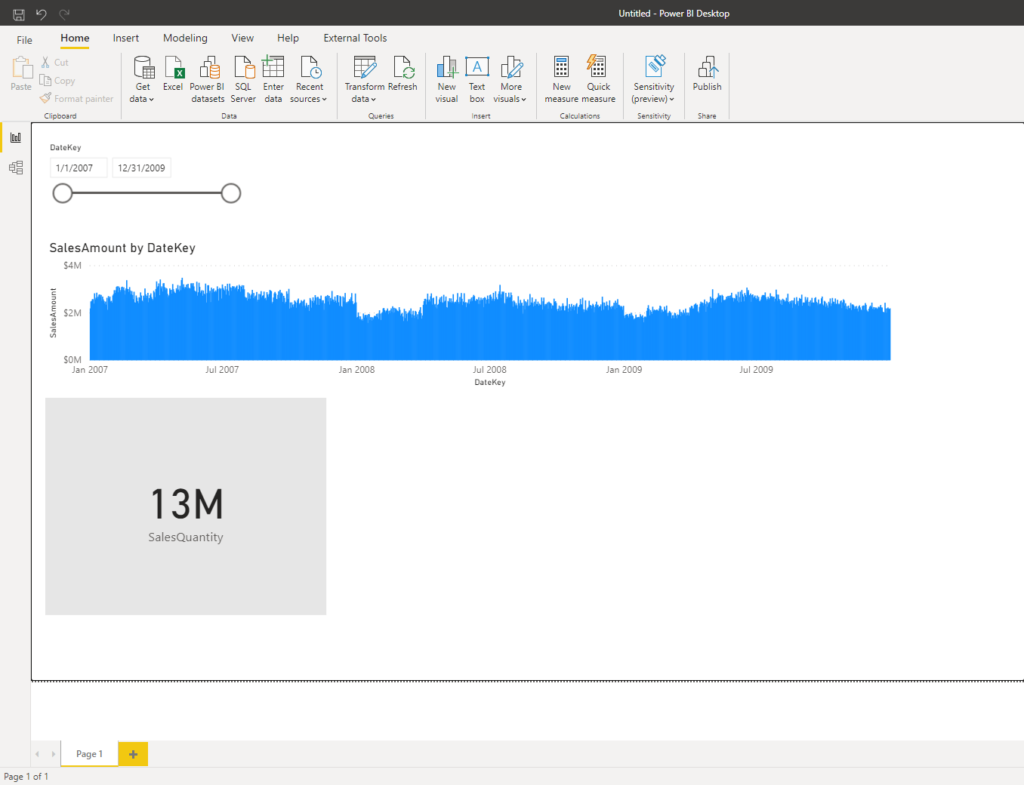
The most important thing to keep in mind regarding DirectQuery is – whenever you interact with the report, each and every visual will fire the query to a data source, even if you don’t interact with that specific visual! In my example, each time I do something on my report, two separate queries will be sent to the underlying Contoso SQL database.
Let’s turn on SQL Server Profiler and check what is going on:
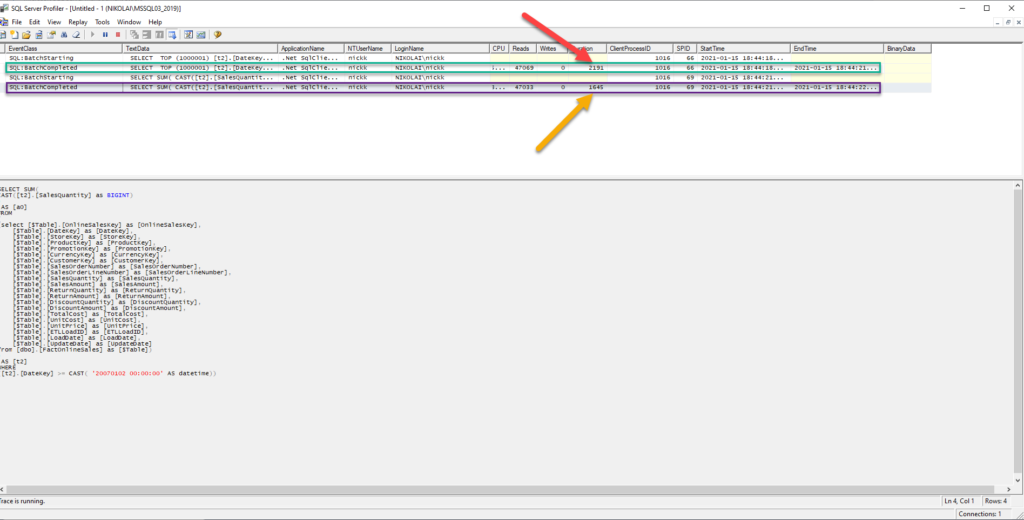
Here, you can see that when I changed the value of my Dates slicer, Power BI fired two separate queries (for each of our visuals)! You can see under SQL: BatchCompleted event class more details about each of these queries: how long did it take to execute, how many reads were made, etc.
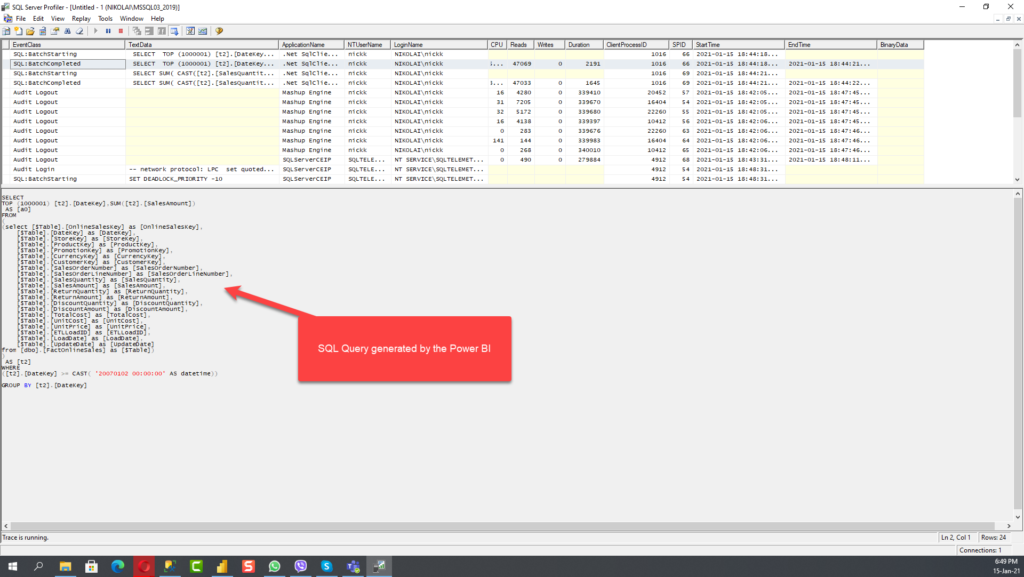
But, the most important thing is that you can capture the SQL generated by Power BI:
Now, you can copy this query and send it to your DBA, so he can decide if there is room for performance improvement (maybe adding indexes or something else).
In any case, you are now ready to assist in finding the SQL query that affects regular workload.
DAX Studio – Easy and elegant solution!

In case you’re not familiar with SQL Server Profiler and other “traditional” tools (when I say traditional, I mean tools that your DBA likes:))), you can leverage the Performance Analyzer feature within Power BI Desktop itself, in synergy with DAX Studio, to achieve the same outcome!
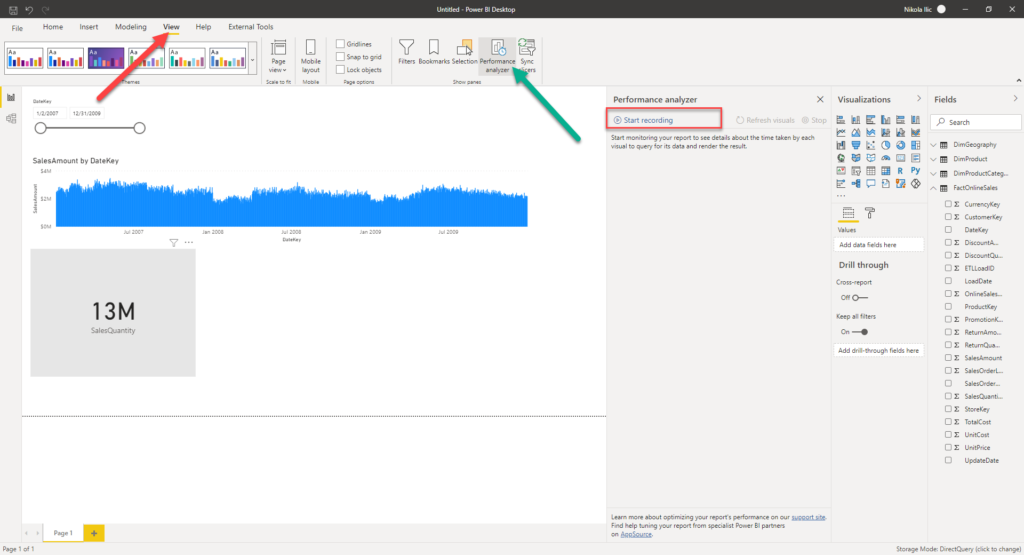
Just refresh the visuals, and you should be able to see total times for every single visual on your report canvas:
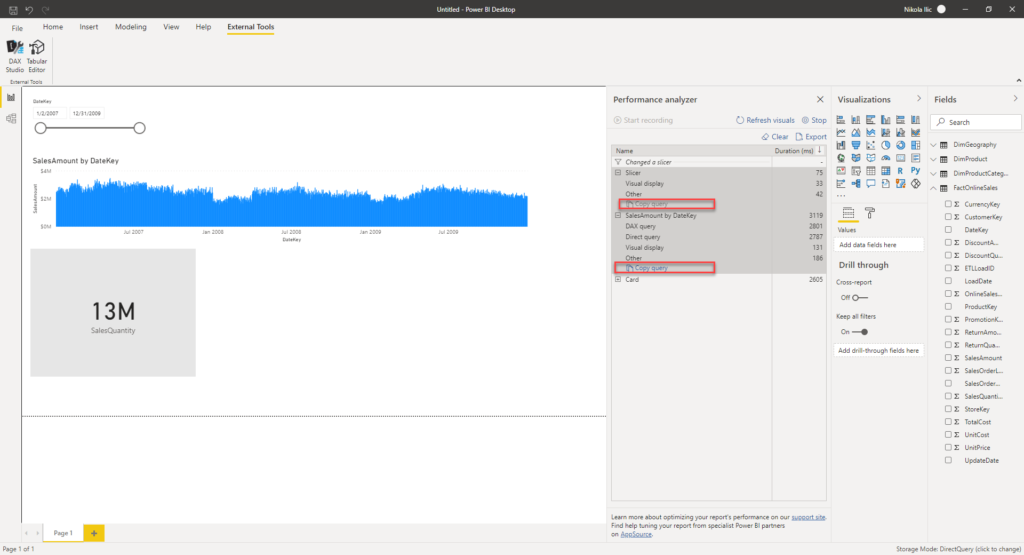
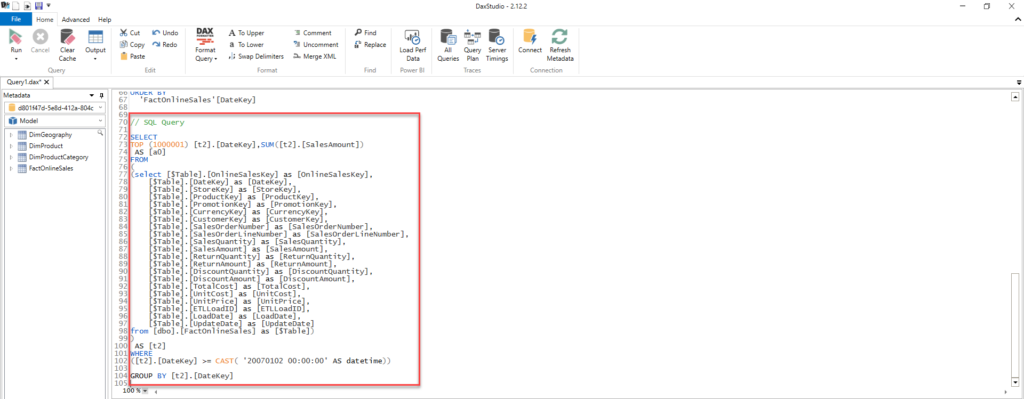
Select Copy Query option and go straight to a DAX Studio. Once you paste the copied query into the main window, scroll down and you will see the SQL query! How cool is that!
I have a bonus tip for you! In case you have multiple queries (like we have two in our example, but you will maybe have sometimes more than 10), it can be quite cumbersome to go back and forth, copy and paste queries one by one.
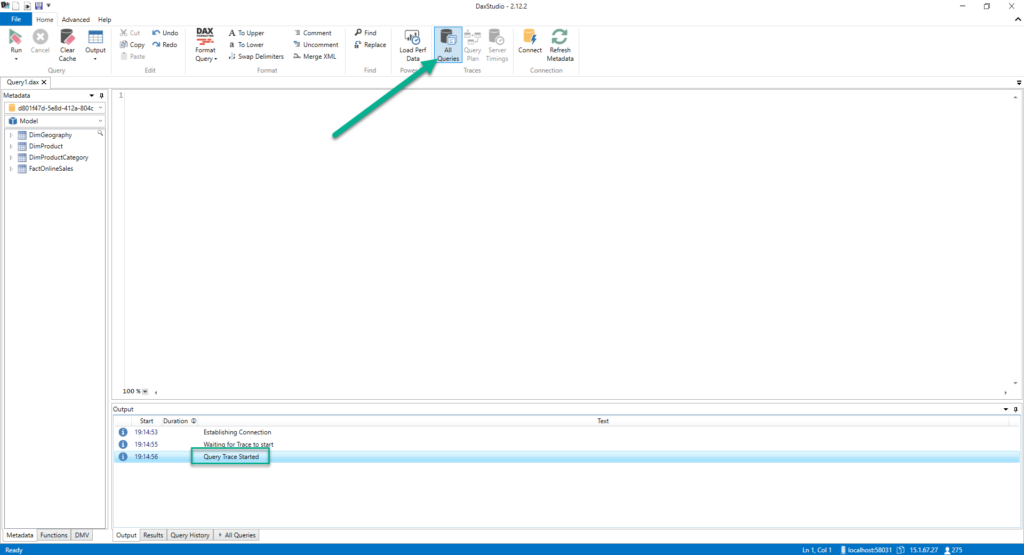
You should enable “All Queries” button within DAX Studio, and wait a few moments until the Query trace starts:
Now, go back to Power BI Desktop and refresh the visuals. Once it’s done, open DAX Studio again and move to All queries tab:
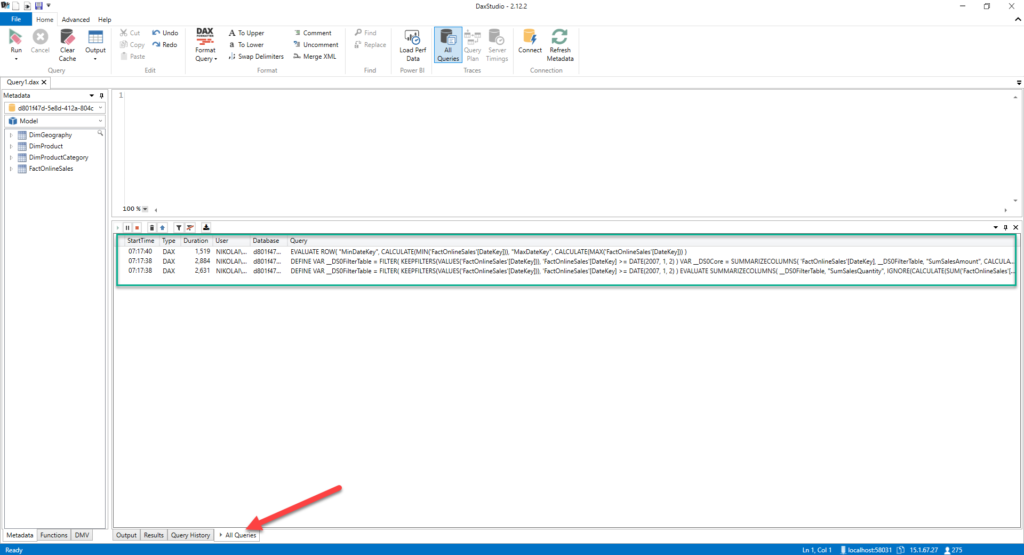
Voila – all my queries are now captured at once! And, once I turn off the All Queries tab and turn on the Server Timings tab, I can click on a specific query:
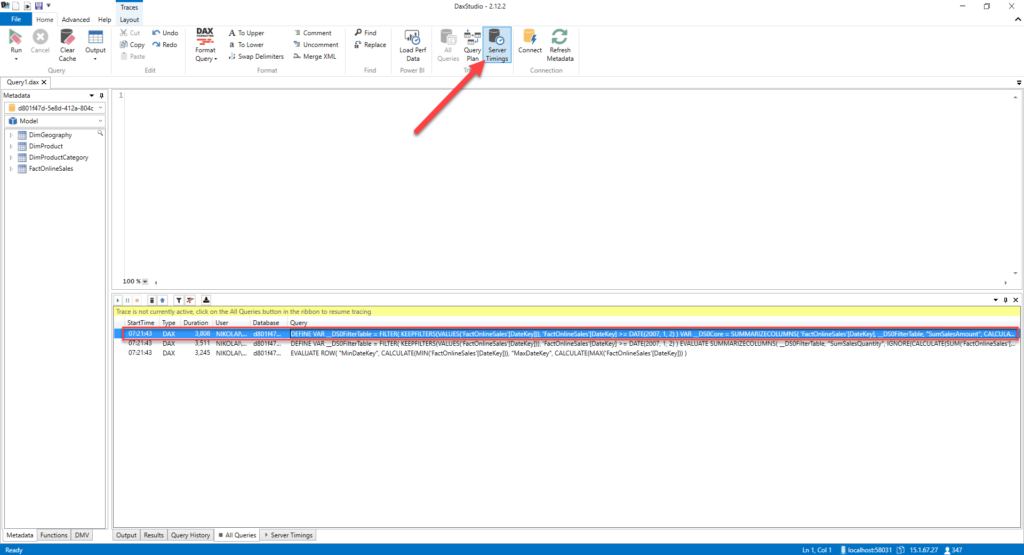
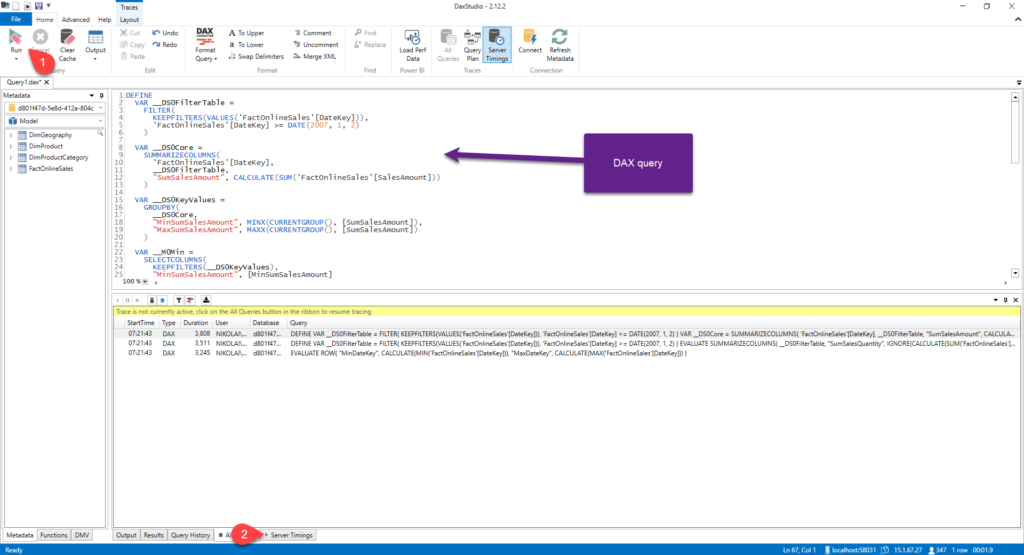
Once I double click the selected query, DAX code will appear in the main window, so I can click on Run, and go to Server Timings tab at the bottom:
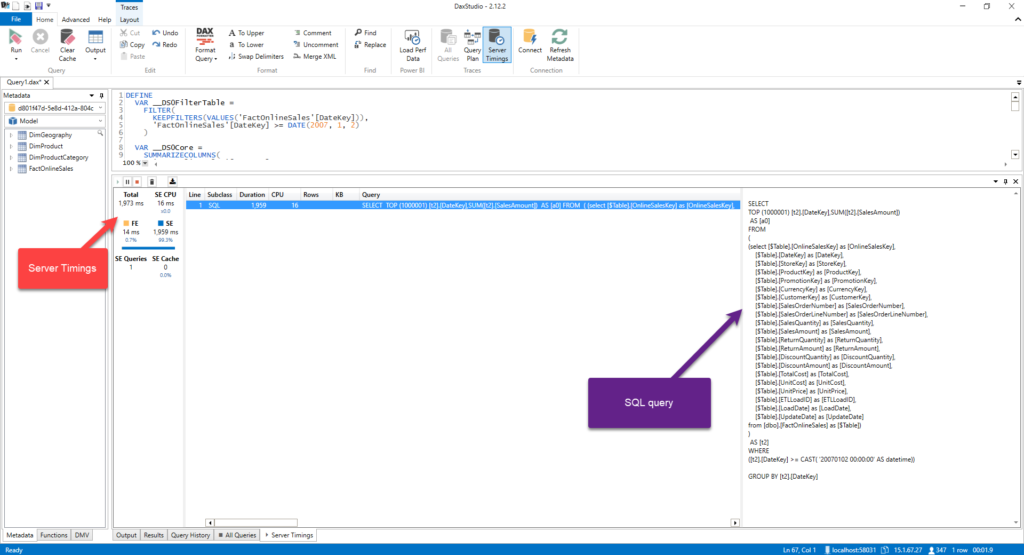
There, you can find not only SQL query generated by the Power BI, but also different metrics related to server performance, such as CPU time. You can also examine how much time needed Formula Engine (FE) and Storage Engine (SE) to satisfy the request.
Conclusion
As you may see, there are different ways to capture SQL queries generated by the Power BI.
You don’t need to worry anymore – next time your DBA comes at your desk, put a smile on your face, as you can now provide her/him with all the necessary information for fine-tuning SQL queries on the source (SQL database) side!
Thanks for reading!
Last Updated on January 15, 2021 by Nikola

Henrik Vestergaard
Hi Mr. Ilic
I have Dax studio Version 3.2.1 connected to a PBIX with a few tables imported from Adventureworks, import mode.
1. When I hit Dax studie > All queries it returns “This type Of CollectionView does not support changes to its SourceCollection from a thread different from the Dispatcher thread.” Do you know why?
2. In which window do you copy the Performance analyzer DAX code into, to get it to show both the DAX query AND the folded SQL?
regards, Henrik
Henrik Vestergaard
Forget question 1, “This type Of CollectionView does not support changes to its SourceCollection from a thread different from the Dispatcher thread.” – Dax studio has to be started as admin!
But question 2?
Nikola
Hi Henrik,
Answer to question 2: you copy the query into a regular window in DAX Studio. If it contains DirectQuery query, during the paste process it should prompt you if you want to paste DAX query only, or both DAX and DirectQuery, as described here: https://daxstudio.org/docs/features/multiple-queries-detected/
Hope this helps.
Best,
Nikola