

A few weeks ago, I was working on a request from our Customer Support department. Essentially, the business request was to enable supervisors to dynamically filter the tasks that need to be performed.
Since supervisors also have their own tasks, they should be able to dynamically switch views between their own tasks, and tasks from all representatives.
USERNAME() & USERPRINCIPALNAME() functions
As usual, DAX offers handy solution to your challenges. This time, I will use one of the information functions…Or to be more precise, not one, but two of them, which are very similar, but still produce different results in different environments.
Let’s start with the USERNAME() function. This function will return you the domain name and user name of the current connection. So, if I create measures like this:
My User = USERNAME()
My User Principal = USERPRINCIPALNAME()
And put it in a simple card visuals, here’s what I get:
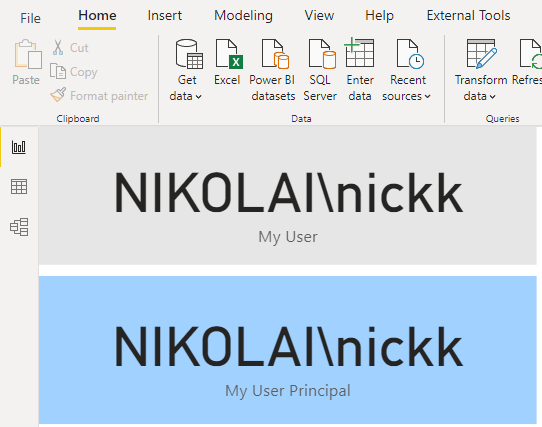
USERPRINCIPALNAME() will return the UPN (User Principal Name). Depending on your settings, in Power BI Desktop, the result can be exactly the same as for the USERNAME() function (as in my case), or it can return the email address of the user that is signed in to Power BI Desktop.
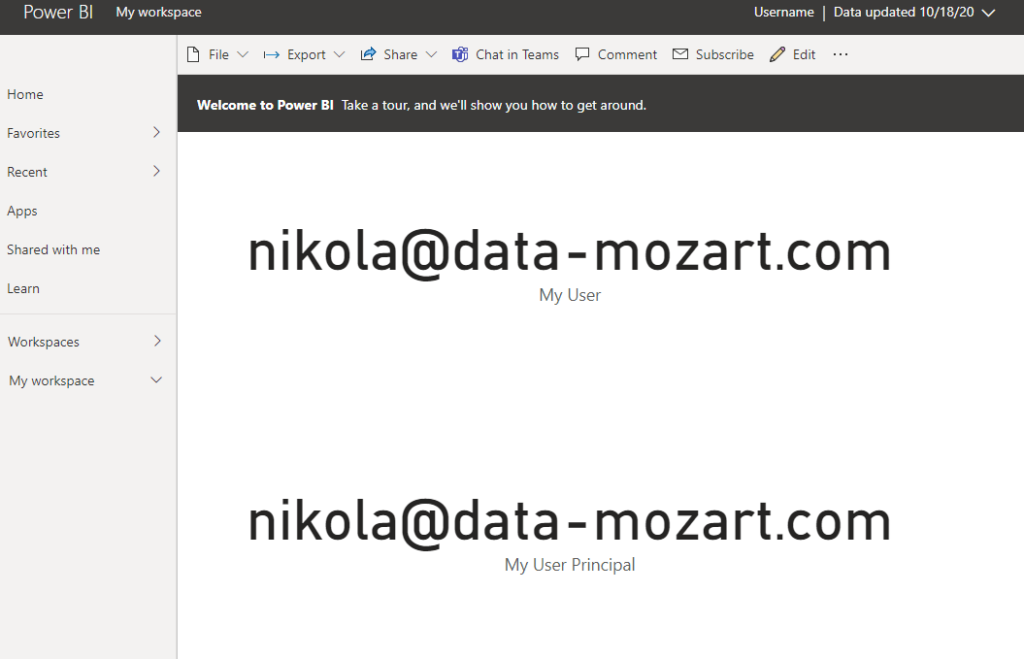
However, once you publish your report to Power BI Service, both functions will behave the same and return the email address as a value:
Solving the original problem
Now, going back to my original problem, here is how we can leverage these functions to find an elegant solution.
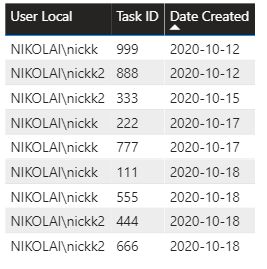
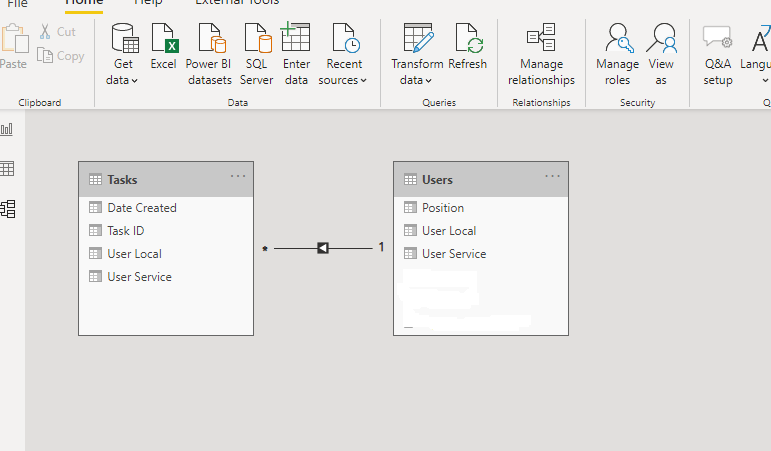
Here is a table with data related to tasks. As you can see, I have a user to whom the task is assigned, Task ID, and the date when the task was created.
The other table contains data about users (I’ve created a dummy second user, just to mimic the real scenario):
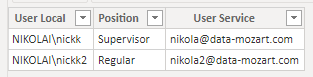
Two tables are connected via User Local column, as you can see in the following illustration:
The most important step is to define a measure which will calculate “my” tasks – and when I say “my”, I’m referring to a tasks for the user who is browsing the report.
The following measure will help us to achieve this:
My Tasks = CALCULATE(
                    COUNTROWS(Tasks),
                    KEEPFILTERS(Users[User Local] = USERNAME()
                    )
                    )
Using KEEPFILTERS() function, we are modifying the default behavior of the CALCULATE function, as filter arguments defined within the CALCULATE function will replace all existing filters on the specified columns.
Applying KEEPFILTERS, if the CALCULATE filters replace the current context, KEEPFILTERS will add filters to the current context.
That being said, if I put this measure to a card visual, I’m getting the following result:
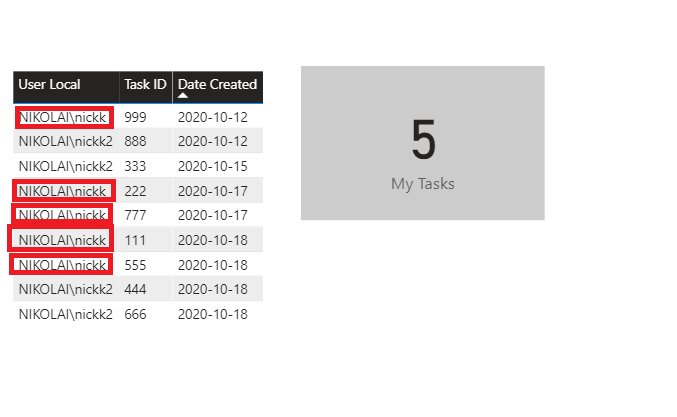
Since I’m logged in as NIKOLAI\nickk, I see that 5 tasks had been assigned to me, which is correct.
Final polishing for better experience
Now, I want to enable my supervisor user to choose what he wants to see in the report: either all tasks or only those tasks assigned to her/him. To achieve this, I will use bookmarks and make some tweaking within my report page.
The first step is to create a copy of the existing table and apply a filter on it, to display only rows where the value of My Tasks measure is greater than 0:
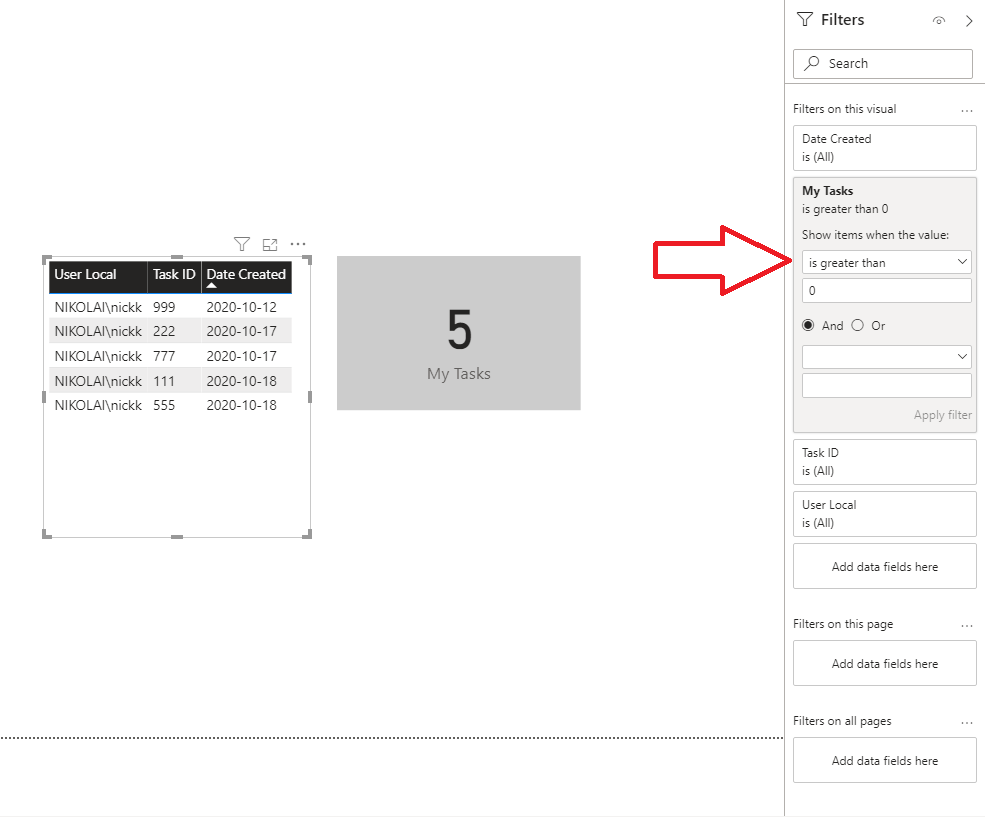
I’ve put this new table exactly over the old one, which shows all tasks. I will just switch the headings’ background color so that users could be able to distinguish the tables based on colors also.
And here comes the final polishing of my solution: I will put a button on the report canvas, to enable my user to dynamically switch between two different views. Or, even better, I will put two buttons one over the other to save the space on the report page, at the same time preserving the full functionality of the bookmark actions.
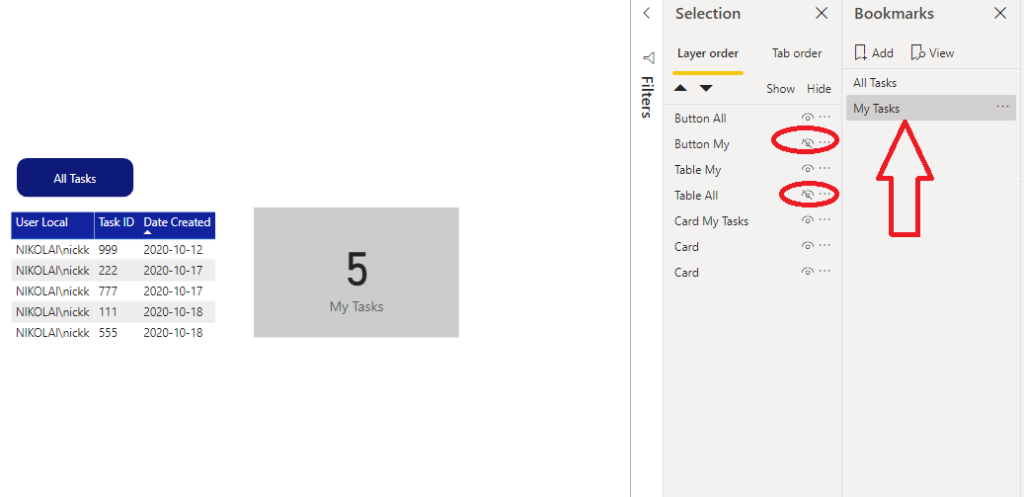
The final step is to create bookmarks and define proper actions for each of them:
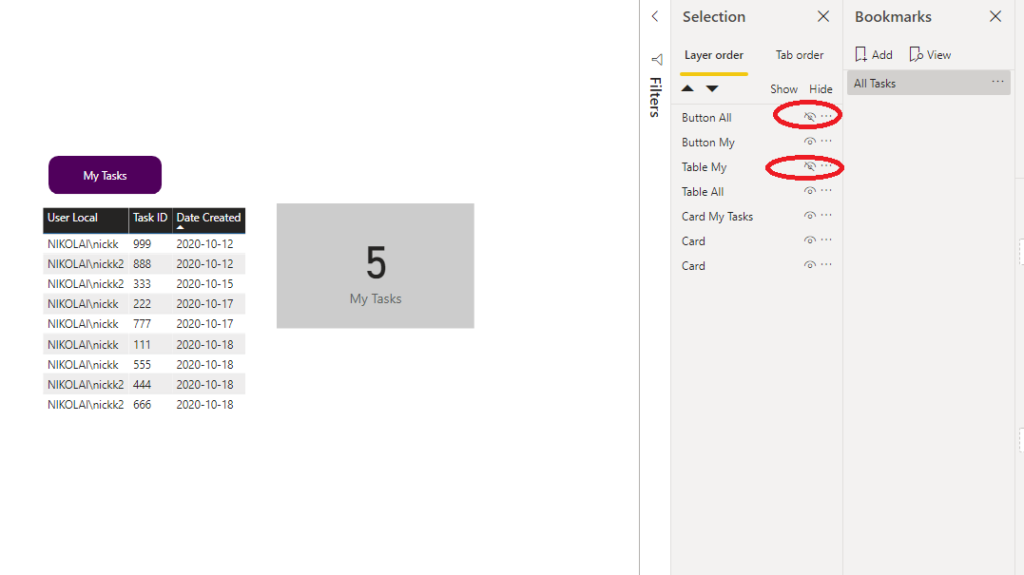
The “All Tasks” bookmark will have two visuals hidden (please see the illustration above), while the “My Tasks” bookmark will apply similar logic, but in the opposite direction:
Finally, let’s define actions for our buttons so that we enable navigating between the two bookmarks we’ve just created:
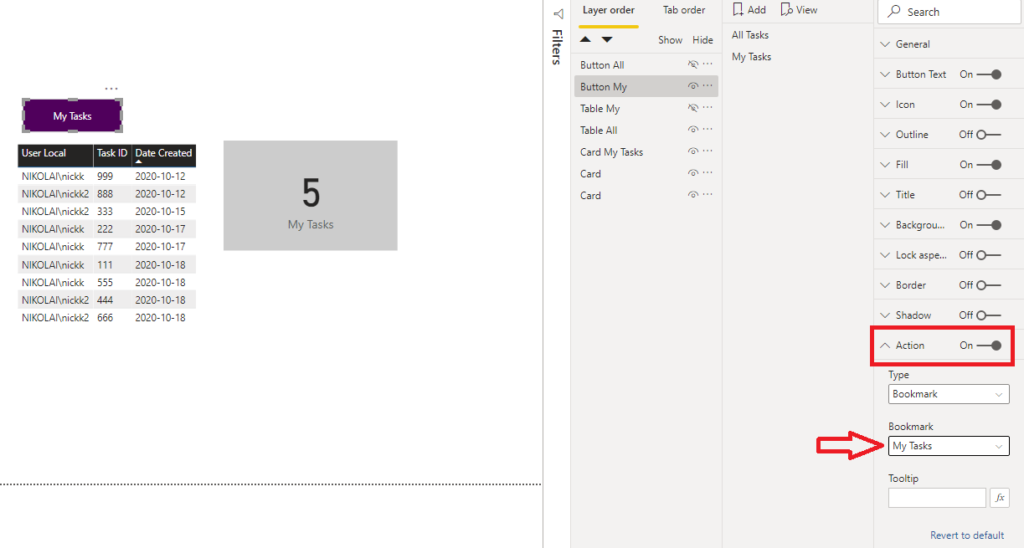
And once we’re done with that, here is how our final solution looks:
Before we conclude, one important remark: in order for this trick to work in Power BI Service, you need to switch the function in My Tasks measure, and use User Service instead of User Local:
My Tasks = CALCULATE(
                    COUNTROWS(Tasks),
                    KEEPFILTERS(Users[User Service] = USERNAME()
                    )
                    )
Conclusion
At first glance, the original request seemed tricky and challenging. However, by applying some basic but useful DAX functions, and with little tweaking using bookmarks, we were able to provide our users with an elegant, yet effective solution.
Thanks for reading!
Last Updated on October 19, 2020 by Nikola

Ferdinand Santos
Hi Nikola,
Thank you! I will be using this approach in my upcoming project.
Comment on the following;
“Before we conclude, one important remark: in order for this trick to work in Power BI Service, you need to switch the function in My Tasks measure, and use USERPRINCIPALNAME() instead of USERNAME():”
Shouldn’t it say “use User Service instead of User Local”?
Best regards,
Ferdinand
Nikola
Hey Ferdinand,
Thanks for spotting this, you are completely right! Just updated in the article:)
Thanks again!
Nikola
Roland Szirmai
Hi Nikola,
I was just exploring this option last week, and I’m so happy that GITC pointed me here! Really great example – and more importantly I can copy-paste this 🙂 “I’m not lazy, just efficient”, right?
One thing, which in my case helps a bit more is the below (sorry for the formatting in advance):
My Customers =
VAR user = USERNAME()
VAR uName = LOOKUPVALUE(‘User Directory'[Surname],’User Directory'[E-mail],user)
RETURN
CALCULATE(
COUNTROWS(Customers),
//KEEPFILTERS(
CONTAINSSTRING( Customers[Sales Rep Search], uName)
)
The reason behind that is we can have multiple SalesReps linked to a single Customer. Of course, this makes it a bit more challenging to apply page level filters (or maybe I’m doing something wrong), but can apply this filter on each visual on the page.
With the bookmarks and buttons of course!
Again, great stuff, and thanks!
Regards,
Roland
Nikola
Hey Roland,
Thanks for expanding on this, really great use-case, I like it! And, yes, “we are not lazy, just efficient”😁😎
Best,
Nikola