
If you follow my blog regularly, you might have noticed that I’m a big fan of Field parameters. This feature, introduced in May 2022, significantly reduced complexity and development efforts when dealing with some pretty common business scenarios.
I’ve already written how you can leverage Field parameters to bring more life to your Power BI reports. However, it’s not only about data visualization, as this feature may also be used to solve some of the data modeling challenges in a very elegant way.
Before I show you one extremely handy use case for Field parameters that I’ve recently implemented, let’s first explain what are Field Params and what happens behind the scenes once you start using this feature.
In a nutshell, Field params enables you to perform two actions:
1. Dynamically change the attribute for slicing and dicing the data in the visual – meaning, dynamically switch between different columns
2. Dynamically change the metrics displayed in the visual – meaning, dynamically switch between different measures
I hear you, I hear you…Nikola, we could have done this prior to Field Params as well…Yes, that’s true, but instead of TREATAS complexity, or writing complex and verbose SWITCH statements in DAX, you can now set everything up with just a few clicks and without writing a single line of DAX code!
Looking under the hood
Let’s have a quick look under the hood of Field Params creation.
Once you drag the columns and/or measures in the Field Params window, Power BI will automatically create a new table in your data model. You may also choose to automatically create a slicer containing values from the Field Params and put it on the report page.

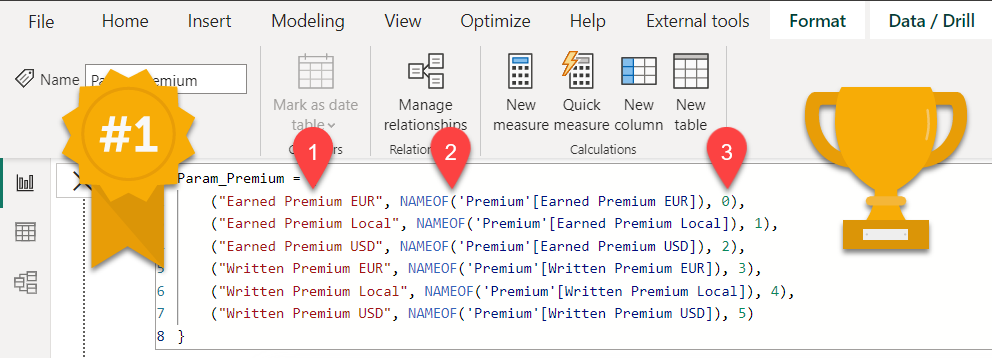
This table consists of three built-in columns – one is visible to an end-user, while the remaining two are hidden by default.
The first one, the name of the column that’s going to be displayed in the slicer, is the label exposed to a consumer. You can change the name of the column later, without the need to change the whole logic in the background.
This is possible because of the second column in the table, called Fields. This column leverages NAMEOF DAX function. NAMEOF function returns the fully qualified name of the model object. Why is this important? Let’s say that you want to change the column name from Brand to Brand name…You can do that without violating the Fields Param structure, as the NAMEOF function will still return the new name of the object. The displayed name stays unchanged, but it will refer to an underlying object with a different name.
The third column is a numeric one and represents the order of the elements within Fields Params, starting from 0.
Ok, these 3 are provided out-of-the-box once you create Field Params. However, as this is nothing else but the table, you can also manually extend this table with additional columns.
If you’re wondering why this may be interesting, stay tuned and I show you how this “extendability” may be used to solve some data modeling challenges.
Setting the stage
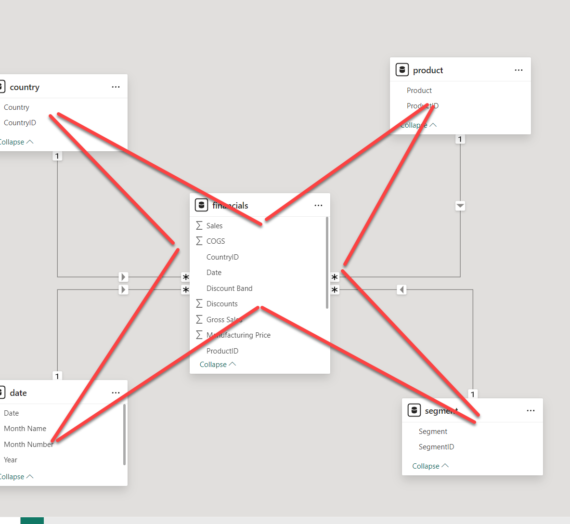
My data model is fairly simple. I have a table containing data about various insurance products. For each product, users should be able to see earned and/or written premium (explaining the difference between these two KPIs is out of the scope of this article). Additionally, each of these KPIs might be displayed in local currency, EUR or USD:
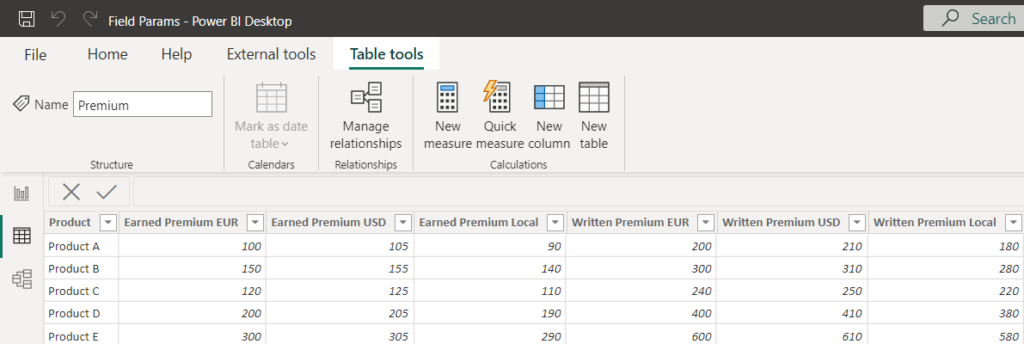
The idea is to enable users to slice and dice the data based on different currencies (EUR, USD, local), and/or different KPIs (earned vs written).

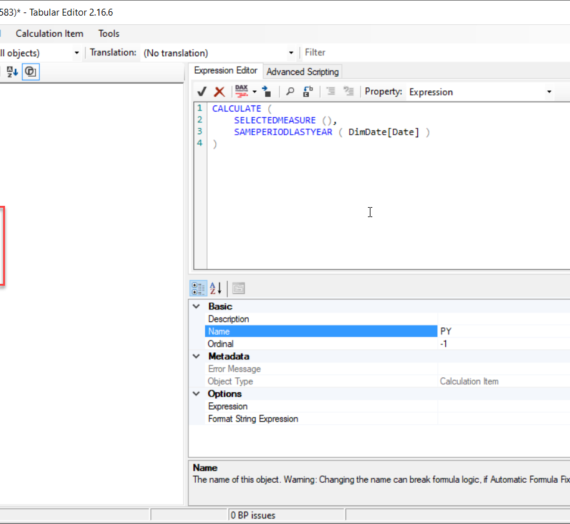
In the old client’s solution, this dynamic selection was handled by using some verbose DAX: a combination of the SWITCH statement and the SELECTEDVALUE function. This solution is not only complex, but it’s also hard to maintain: imagine that you want to add a new currency in the scope, or a new KPI. You would need to find all the measures where the logic has been applied, and adjust the measures’ definitions.
Field parameters to the rescue!
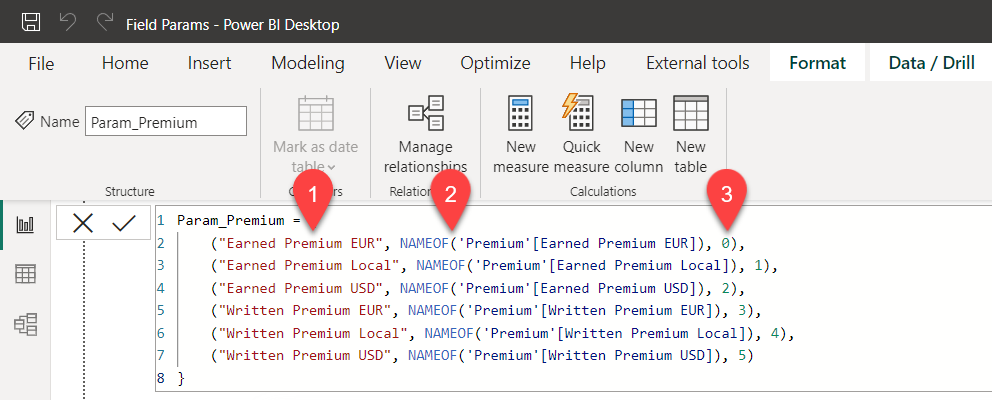
Or, you can use Field parameters to filter the data based on the user’s selection! Let’s extend the Field parameters table that we previously created:

The first added column represents the currency of the certain option, while the second column represents the KPI (Premium type). I’ll rename these columns in my Param_Premium table to Currency and Premium Type respectively.
Let’s now open the Model view and establish relationships between our dimension tables (Currency and Premium Type) and our Field params table (Param_Premium):

Next, let’s remove all the individual columns from our table visual, and put the “column” from the Field parameter table:
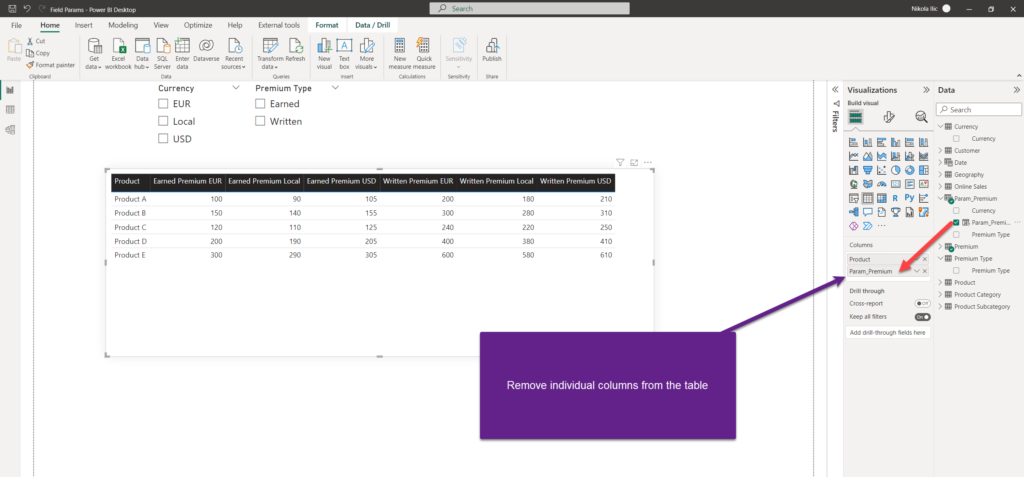
At first glance, it looks exactly the same as in the previous case. But, once I start playing around with the slicers…just look what happens!

Works like a charm!
Conclusion
The Field parameters are amazing! This feature not only reduces the development effort for many common tasks in Power BI, and enriches the data visualization aspect of Power BI reports – as you witnessed, we’ve leveraged Field parameters for data modeling purposes and enabled our report users to have full flexibility in the way they want data displayed. By extending our data model with FIeld parameters logic, we provided a possibility to dynamically control data on the report page.
Thanks for reading!
Last Updated on March 11, 2023 by Nikola
Inoussa
Nice, how to get your articles when you send them?
Sreeni
Nice
Peter
Is it possible to SUM the output of this Columns somehow?
Igor
What if I don’t know how many columns I will have in total and can not pass the complete list of column list explicitly? Is there a way to iterate over column names and thus calculate the new table?
Nikola
Hi Igor,
Unfortunately not (at least at his moment). Field parameters require your manual input to specify included elements.
Borja
I don’t know how to sum this columns
Diego
Awesome! Is it possible to do this but with a line graph?