

A few months ago, I wrote a blog post about dynamic filtering in Power BI – and how to display different measures within one visual, depending on the user’s selection – without using bookmarks!
Last week, I’ve got a similar request from my client. In fact, this time the request was the other way around – they want to see the same metric (measure), but from different perspectives – for example, total sales amount per country and brand name, depending on user’s choice.
Again, this could have been done using bookmarks and switching between different page states. However, I’ve wanted to find a different, flexible, and more scalable solution – just in case that in the future they want to extend the list of possible “perspectives”, by adding, for example, customer gender, or region to this list.
I like to call this solution: DAXis – because we play with DAX to achieve dynamic axis:)
Setting up the stage
While searching for possible solutions, I’ve come across this great blog post from Kasper de Jonge, which basically gave me an idea of how to handle this request.
As usual, I will use Contoso sample database for demo purposes.
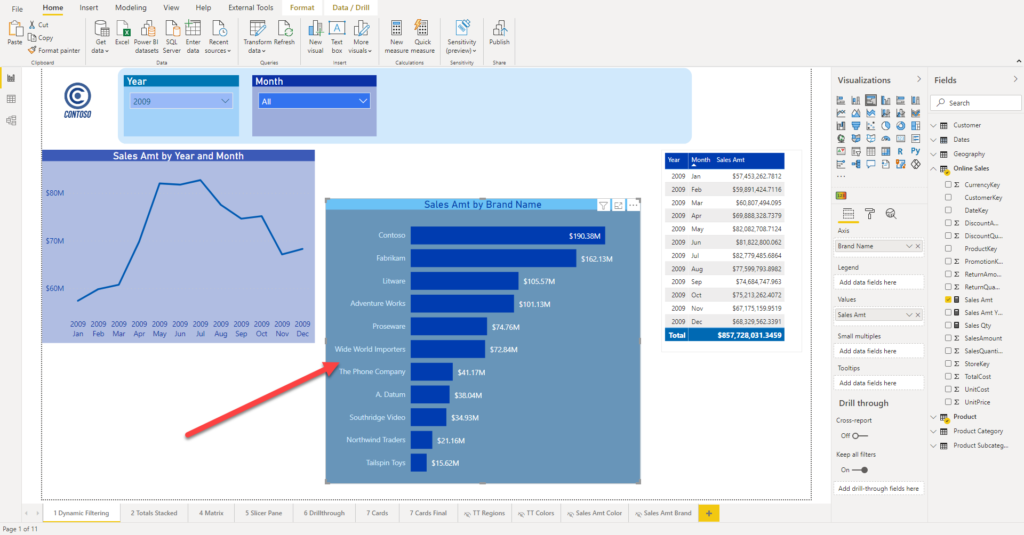
In this illustration, you can see that my visual shows total sales amount per brand name. The idea is to “somehow” enable user to switch the axis to country, persisting existing measure in the visual. No bookmarks allowed:)
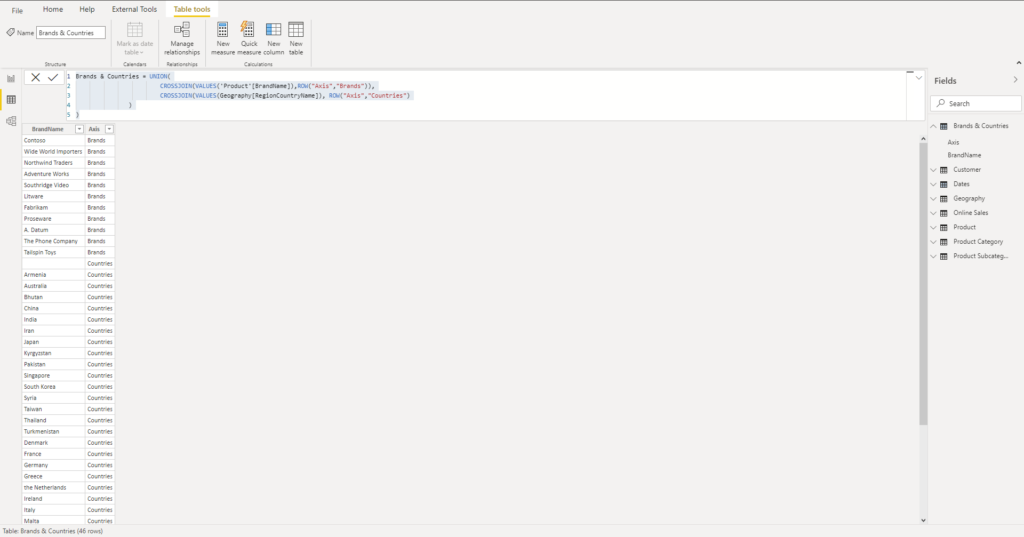
The first step is to generate a new table, that will in essence be a Cartesian product of all distinct values from brands and countries columns from our data model. This table will be later used for building the axis for our visual.
Brands & Countries = UNION(
                        CROSSJOIN(VALUES('Product'[BrandName]),ROW("Axis","Brands")),
                        CROSSJOIN(VALUES(Geography[RegionCountryName]), ROW("Axis","Countries")
               )
)
I’ve just renamed BrandName column to “Value”, as it includes not only brands, but also countries.
Going back to our report, let’s put the Axis from this table in the slicer, and BrandName as the axis in our visual:
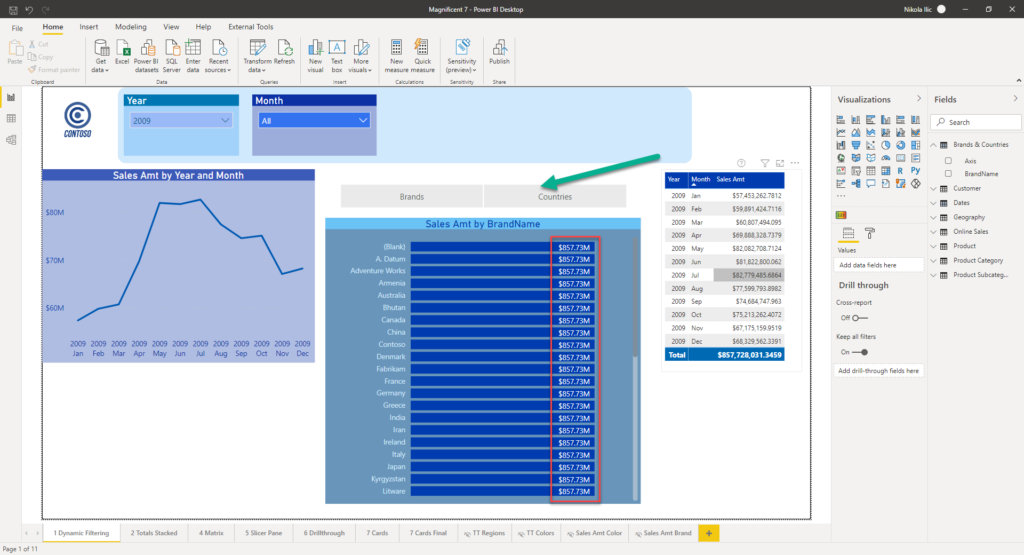
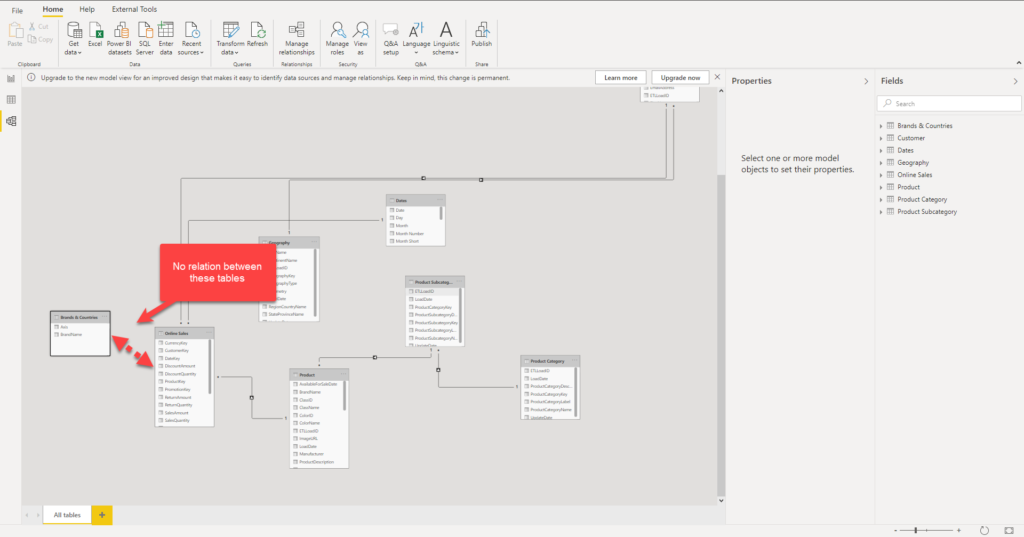
As you can spot, we are getting grand total for each axis category. That’s because our main measure (Sales Amt) is summing values coming from the Online Sales table, and there is no relationship between this table and our newly created Brands & Countries table.
So, our main measure (Sales Amt), needs to be rewritten in order to display correct results. We will leverage the usage of TREATAS DAX function. In the most simple way, TREATAS applies the result of a table expression as filters to columns from an unrelated table. This function comes with some limitations, but it should work in our specific scenario:
Sales Amt TREATAS =
   IF(
       HASONEVALUE('Brands & Countries'[Axis]),
          SWITCH(VALUES('Brands & Countries'[Axis])
                 ,"Countries", CALCULATE(SUM('Online Sales'[SalesAmount])
                                      ,TREATAS(VALUES('Brands & Countries'[Value])
                                      ,Geography[RegionCountryName]))
                 ,"Brands",    CALCULATE(SUM('Online Sales'[SalesAmount])
                                      ,TREATAS(VALUES('Brands & Countries'[Value])
                                      ,'Product'[BrandName]))
)
)
In this case, TREATAS will push filters from our newly created table to a “real” dimension table! And, once I drag this new measure to a visual, I’m able to dynamically change the y-axis based on user’s selection within the slicer:
How cool is that! Thanks to Kasper for the brilliant idea:)
Conclusion
As you may witnessed, we found a very cool and elegant solution to a common business request.
As for almost any problem, not just Power BI related, there are multiple valid and legitimate solutions. We could handle this request using buttons and bookmarks, but in the longer run, I believe that this solution with a dynamic axis and separate table offers more scalability and is easier to maintain.
Thanks for reading!
Last Updated on February 3, 2021 by Nikola


Bibin Bastian
Very neat technique
Erik
Very interesting blogpost!
I am now getting curious if it is possible to choose both dimensions and put them both in a different column so the data will be grouped by both chosen dimensions.
Nick
great stuff, this seems like an ideal solution. thanks