

This blog post is part of the “Data Modeling” series, created together with my friend and well-known Power BI expert – Tom Martens
Table of contents
- PRELUDE TO DATA MODELING WITH POWER BI
- THE POWER BI DATA MODEL
- Tables, columns and some things related
- Concept of extended tables
- Calculated columns and measures
- The danger of the one-table solution
- RELATIONSHIPS
- Regular vs Limited relationships
- Circular dependencies
- Role-playing dimensions
- Bi-directional relationships
- PARENT-CHILD HIERARCHIES
- AGGREGATIONS
- OUT-OF-THE-BOX THINKING
- Disconnected tables
- A different approach to the event-in-progress problem
Have you ever been to a theatre? When I’ve heard the term “Role-playing dimensions” for the first time, my first association was – theatre! Probably because of the words “role” and “playing”:)…And, I still like to think about role-playing dimensions that way.
You know those performances when one actor or actress transforms themselves and get into multiple different characters. Yes, the “actor” in our Data modeling “show” is a dimension table, while characters are multiple columns from the fact table…
And, as in the real theatre, where you can hire two actors and each of them plays a single role, you may also rely on one actor to cover both roles!
Before I show you how this story about actors and roles reflects in the data modeling world, I’d like to emphasize that the “Role-playing dimension” is not a concept exclusively related to Power BI. It’s a universal data modeling technique that comes from Kimball’s methodology.
Simply said, it’s the situation when you use one same dimension for creating multiple relationships to your fact table. Typical usage of role-playing dimension concept is with Date dimension, as in many cases your fact table will contain multiple date fields. For example, in the betting industry, there are fields DateBetPlaced and DateBetProcessed, which don’t need to be identical (and in most cases are not). So, let’s say that the business request is to analyze data both on DateBetPlaced and DateBetProcessed.
Two roles – two actors! Solution with multiple references of one dimension
Let’s first examine the situation where we “hire” two actors and each of them plays one single role. In this solution, we’ll create two copies of exactly the same Date dimension and relate DateKey to DateBetPlaced in the first case, and to DateBetProcessed in the second case.
Something like this:
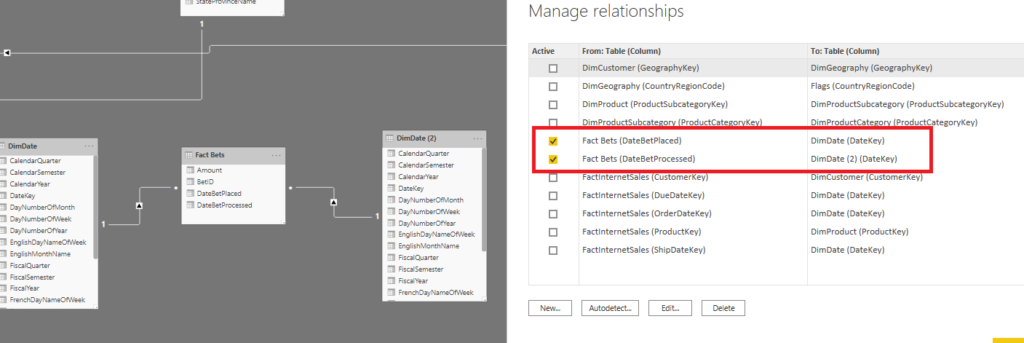
As you see, each date field from the fact table relates to its own Date dimension. And we say that each of these references “plays” its role in the model.
What would be the benefits of this decision?
- If you’re dealing with a relatively small model, you can quickly “hire” a new “actor” – import a new role-playing dimension in the model, create the relationship and you’re ready to go
- You will have just one measure to be sliced and diced by different dimension roles separately
Every benefit (or let’s say almost every benefit) comes with a price. So, let’s examine the downsides of this solution.
- If your model is large and you have multiple role-playing dimensions to manage, then you’ll end up importing basically the same dimension table several times which is not efficient. Additionally, each of these tables has its own memory footprint, so the overall data model size will be higher
- Having a bunch of different role-playing dimensions as separate tables all through the data model can be quite confusing for the end-user, which means more time needed to train the end-users. It is also quite hard to maintain such a big model with lots of role-playing dimensions
Two roles – one actor! Solution with one dimension and multiple relationships
If I decide to “hire” one “actor” to cover both roles in my data modeling theatre, instead of keeping multiple references of one same dimension, I can relate one single dimension multiple times to a fact table.
Therefore, I will just delete the redundant Date dimension from my data model and simply connect DateKey from the Date dimension to the DateBetProcessed field in my fact table.
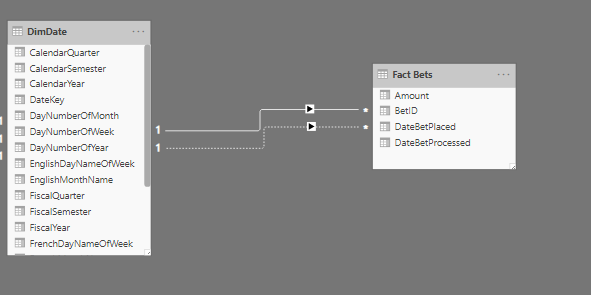
What happened here? Power BI created a relationship, but as you notice, this relationship is marked with a dotted line. That’s because Power BI allows only one active relationship between two tables and in my case, it’s between DateKey and DateBetPlaced. So, when I put that on the report canvas, I get something like this:
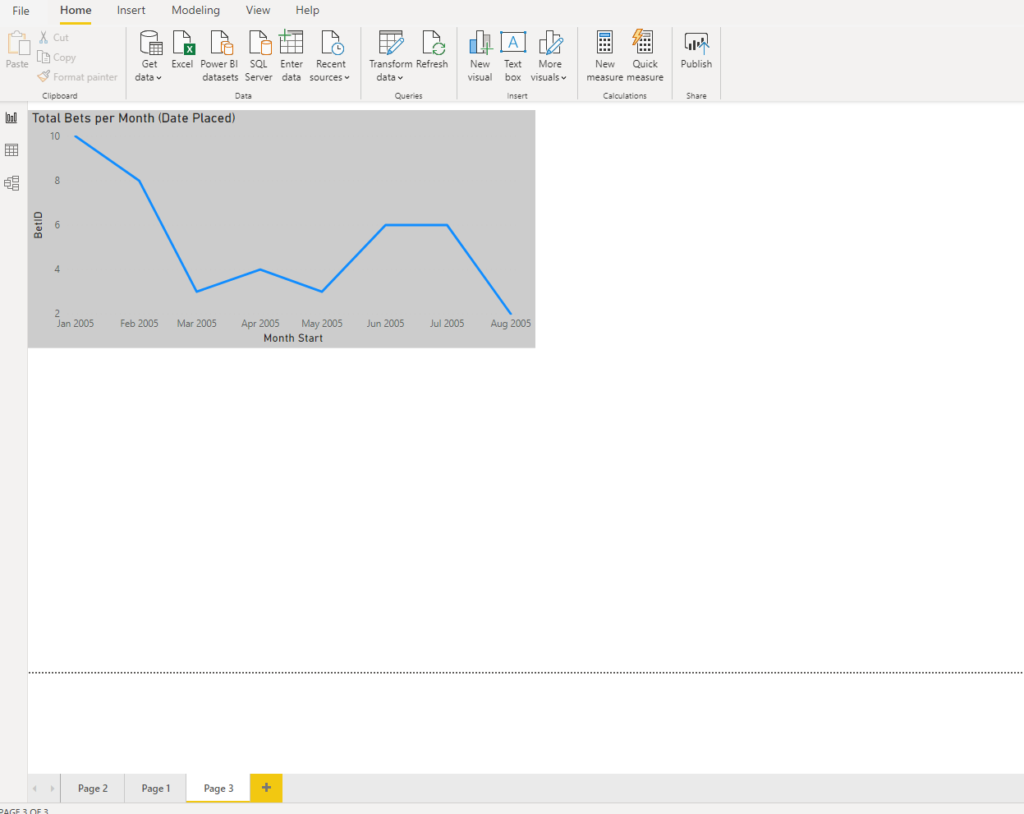
I can see the total number of bets per month, but since my active relationship is between DateKey and DateBetPlaced, I am seeing totals based on dates when the bet was placed!
What if I want to see, instead of how many bets were placed, how many bets were processed per month. Here comes DAX function USERELATIONSHIP to the rescue! This function enables us to define which relationship should be active for a specific calculation.
So, when I write the following measure:
Bets Processed = CALCULATE(
                    COUNT('Fact Bets'[BetID]),
                    USERELATIONSHIP(DimDate[DateKey],'Fact Bets'[DateBetProcessed])
)
I’m explicitly saying to Power BI: here, I don’t want you to use default active relationship (DateKey – DateBetPlaced). Instead, I want you to switch to using another relationship (DateKey – DateBetProcessed) and make this relationship active for this calculation only!
Here are the results:
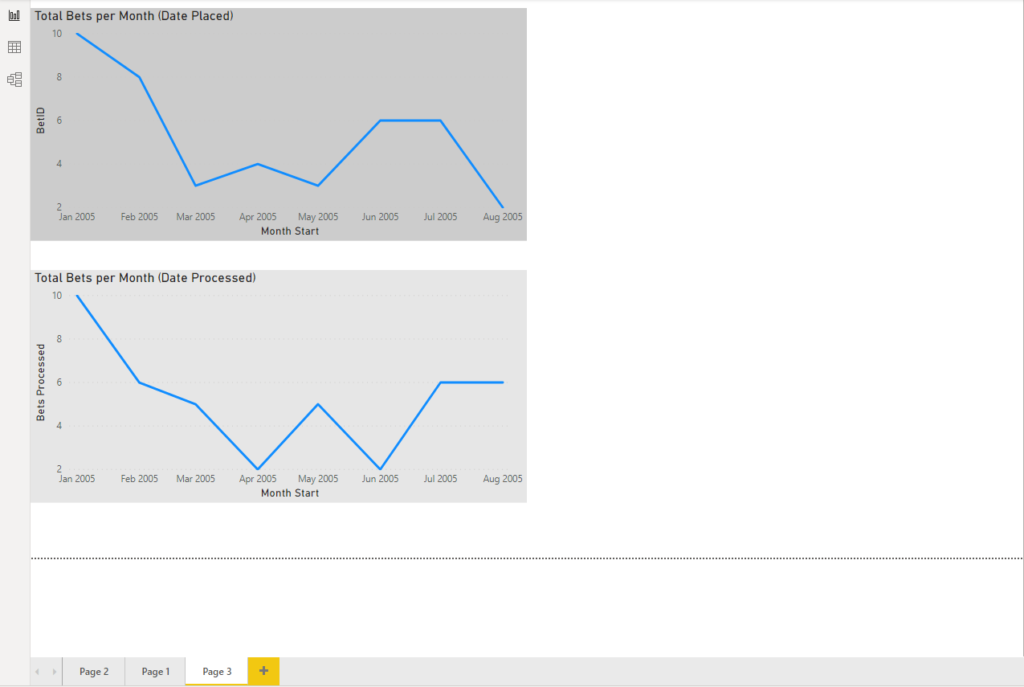
As you may notice, lines are different, based on the relationship used in calculations.
This solution provides multiple obvious benefits:
- You can compare measures in the same visual, as you’ll have only one date dimension
- Data model is not just more efficient in terms of memory consumption, but it also looks way more cleaner
However, there is no one single solution to rule them all, so the main downside here is:
- In large models, creating tens or even hundreds of measures to support different roles can be time consuming and comes with the maintenance headache. And who likes headaches:)?
Conclusion
As in most challenges related to data modeling, there is no single solution to rule them all. When would you want to use the “two roles – two actors” vs “two roles – one actor” approach, really depends on the specific use case and you should carefully evaluate which option makes more sense for you.
In general, I’d recommend using the “two roles – one actor” approach, as it brings much more advantages over creating redundant tables that will clutter your data model.
Thanks for reading!
Last Updated on November 15, 2025 by Nikola


Paul Olding
Nice piece.
I find this a really interesting question and have come to the opposite conclusion – go with 2 actors as the default. It seems this puts me out of step with most experts on the topic but my reasoning is all about ease of use for self-service. I find that a big benefit of 2 actors is you can name the columns: Bet Placed Month, Bet Processed Year, etc etc. Much clearer for the end user to build a visual, and much clearer for the report consumer to have a visual with Title and axis labelled unambiguously.
To me the extra training of end users comes with the 1 actor approach. Having to explain that if you want to slice by date you have to pick the right measure, but you can choose any measure if you want to slice by product is what confuses. Also, ending up with a visual that, for example, counts bets by product that then mentions (Date Processed) in the Title when the date is totally irrelevant leads to confusion too.
Nikola
No issues with the “2 actors” approach at all! It just depends on a specific use case, and evaluating all pros and cons that come with any of these two solutions in that specific case.
DAX variables, virtual relationships, and iterators in Power BI | by Nikola Ilic | Dec, 2022 - Techno Blender
[…] in a role-playing dimension scenario. Unlike in one of the previous articles, where I explained how to handle role-playing dimensions using the USERELATIONSHIP() function to change the active relationship between the tables, I’ll […]
Dan Meissner
If you need both actors on stage at the same time, then of course you need to use the two actor scenario. Displaying how many orders made in 2022 (order date) ended up being shipped in 2023 (shipping date) is better done with two actors.