
This article is part of the series related to mastering the DP-600 certification exam: Implementing Analytics Solutions Using Microsoft Fabric
Table of contents
Power BI is an awesome tool for many different reasons. One of them is that it provides a whole range of features and functionalities that enable you to go above and beyond regular use cases and enrich your solutions to satisfy various business requirements.
One of these features will quickly become your best friend in complex data modeling tasks – say “hello” to Calculation Groups!
What are the Calculation Groups?
Instead of giving you a “dry” definition of the calculation groups, I’ll try to share a “descriptive” version: Imagine that you have a fact table containing 10 different metrics, such as: sales amount, sales quantity, discount amount, return quantity, and so on. Now, as every “pro” Power BI developer, you’ll go and create 10 explicit measures for each of these metrics.
The next step is to provide your business users with additional information, for example: what was my sales amount in the previous quarter? Or, how has my sales quantity developed year-over-year? Or, what is the running total of the return quantity for the selected time period? So, how do you achieve this?
Of course, you’ll write a measure to calculate the sales amount for the previous month/quarter/year…Then, you’ll write the same set of calculations for sales quantity…Then, for return quantity…And, so on…So, you quickly end up with 50 measures in your dataset! And, most of them contain basically redundant logic – you’re just copy/pasting the expression and switching the base measure (sales amount/sales quantity/return quantity).
And, here Calculation groups come to the rescue!
With the Calculation Group, you set a placeholder for the specific base measure (for example, sales amount, sales quantity, etc.), and then you define a set of calculation items that will be applied to that “placeholder measure”!
I know, it sounds a little bit confusing, so let me show you just a simple example of the “placeholder measure” and calculation items:
Placeholder measure:
SELECTEDMEASURE() – evaluates the measure that is currently in the context (for example, sales amount)
Calculation items:
- Month-to-date calculation
CALCULATE(
         SELECTEDMEASURE(),
         DATESMTD(DimDate[Date])
)
- Year-to-date calculation
CALCULATE(
         SELECTEDMEASURE(),
         DATESYTD(DimDate[Date])
)
- Previous year calculation
CALCULATE(
         SELECTEDMEASURE(),
         SAMEPERIODLASTYEAR(DimDate[Date])
)
Creating a Calculation group
Creating Calculation groups can be done in multiple ways. First, you may use Power BI Desktop to create Calculation Groups:

Similarly, you can also create and configure the Calculation Group in Power BI Service:
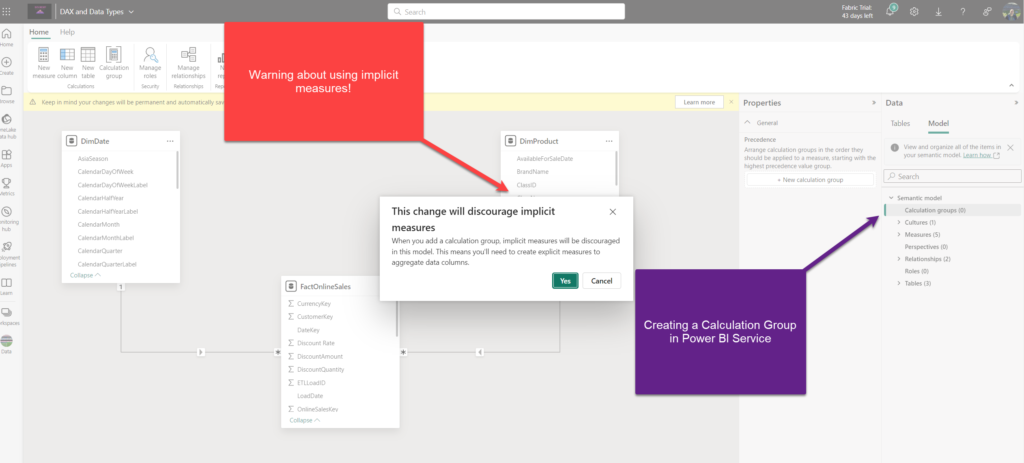
Don’t be scared if you see the warning like in the illustration above. The first important prerequisite for leveraging Calculation Groups, is that you need to use explicit measures! Although, I sincerely hope you are creating explicit measures anyway, nevertheless of the Calculation Group use cases:)
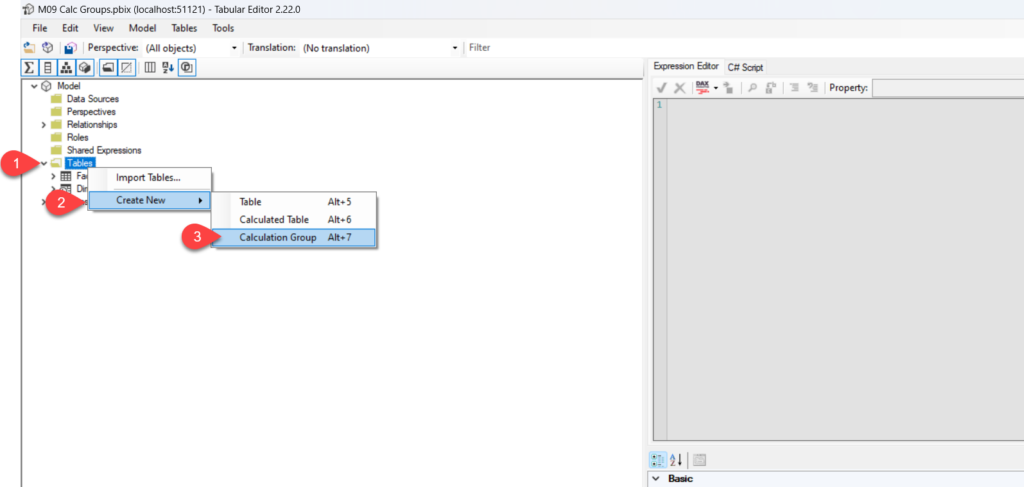
The third option is to use a fantastic external tool, Tabular Editor, for creating Calculation Groups. Creating Calculation Groups in Tabular Editor is a straightforward process. In this example, I’ll use a sample Contoso database and a free version of Tabular Editor external tool (Tabular Editor 2).
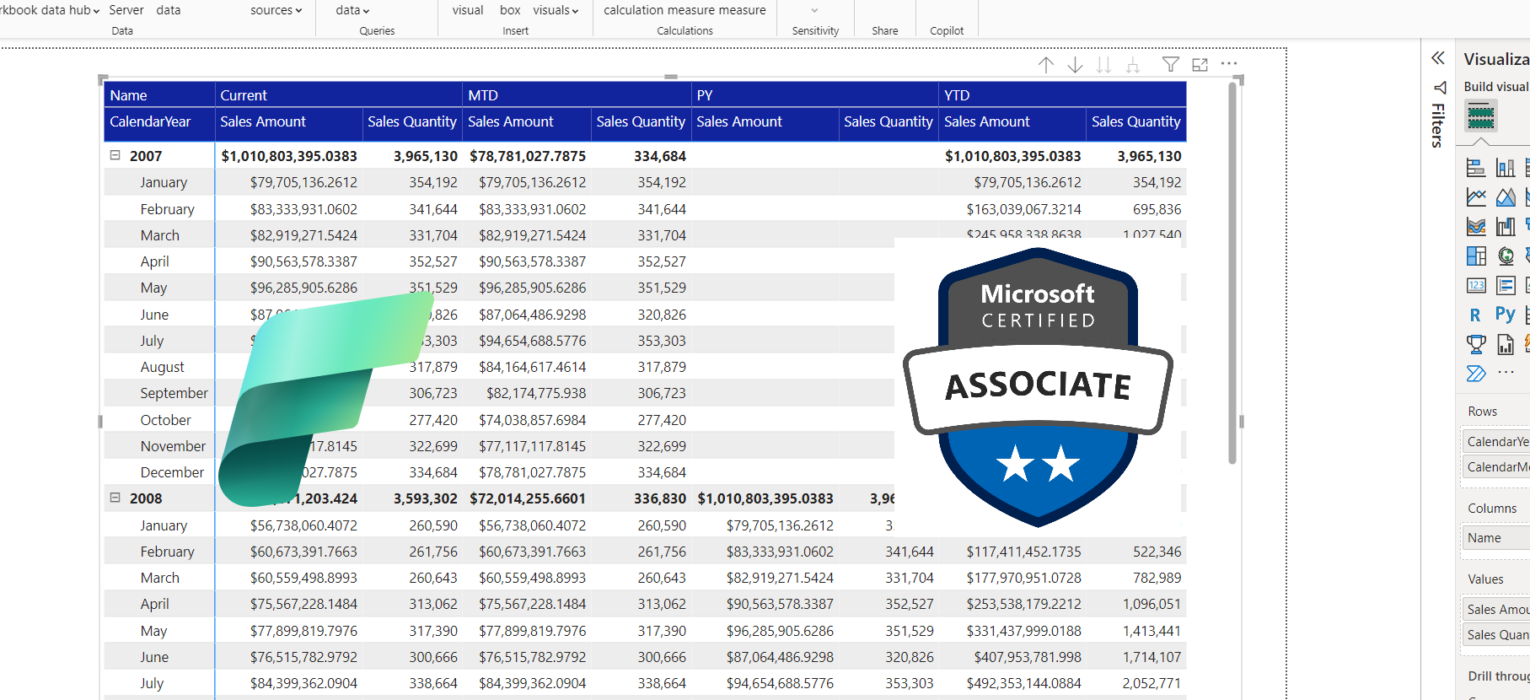
As you see, I have two base measures, Sales Amount and Sales Quantity. Now, if I want to provide information about the values for Month-to-date/Year-to-date/Previous year, I would have written additional 3 measures for Sales Amount, plus additional 3 measures for Sales Quantity.
But, let’s switch to Tabular Editor and define calculation items for our calculation group:
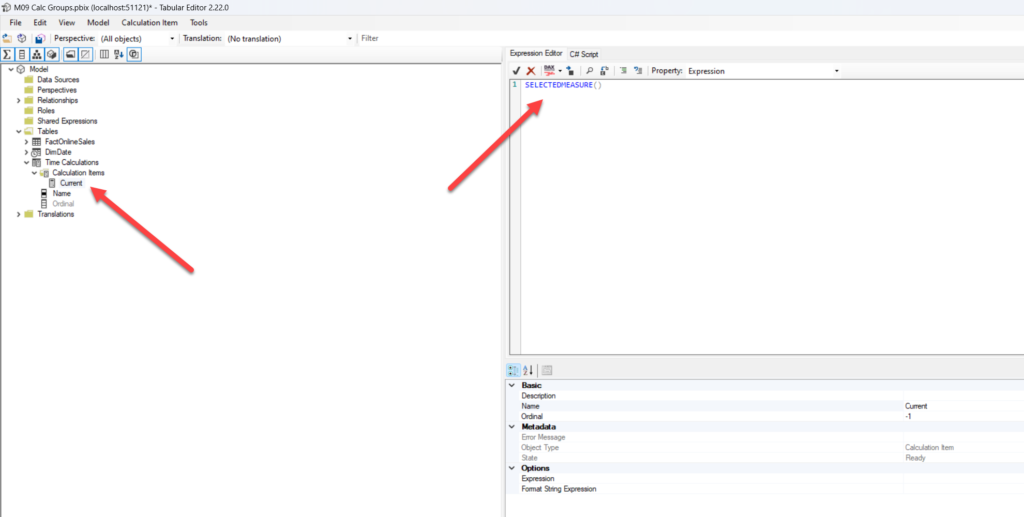
Then, I’ll rename my calculation group to something more meaningful, like Time Calculations, right-click on it, and add a new calculation item, which will basically be my “placeholder measure”:
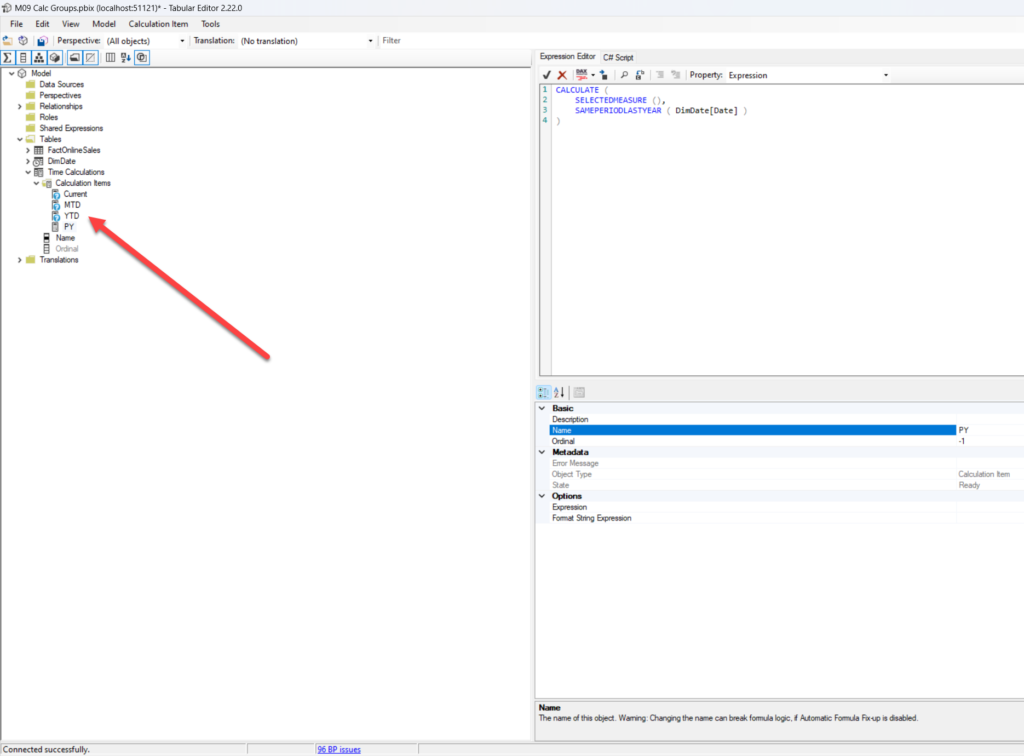
Next, let’s create other calculation items based on our “placeholder measure”:
Once I’m done, I’ll save the changes back to the data model in Power BI Desktop:

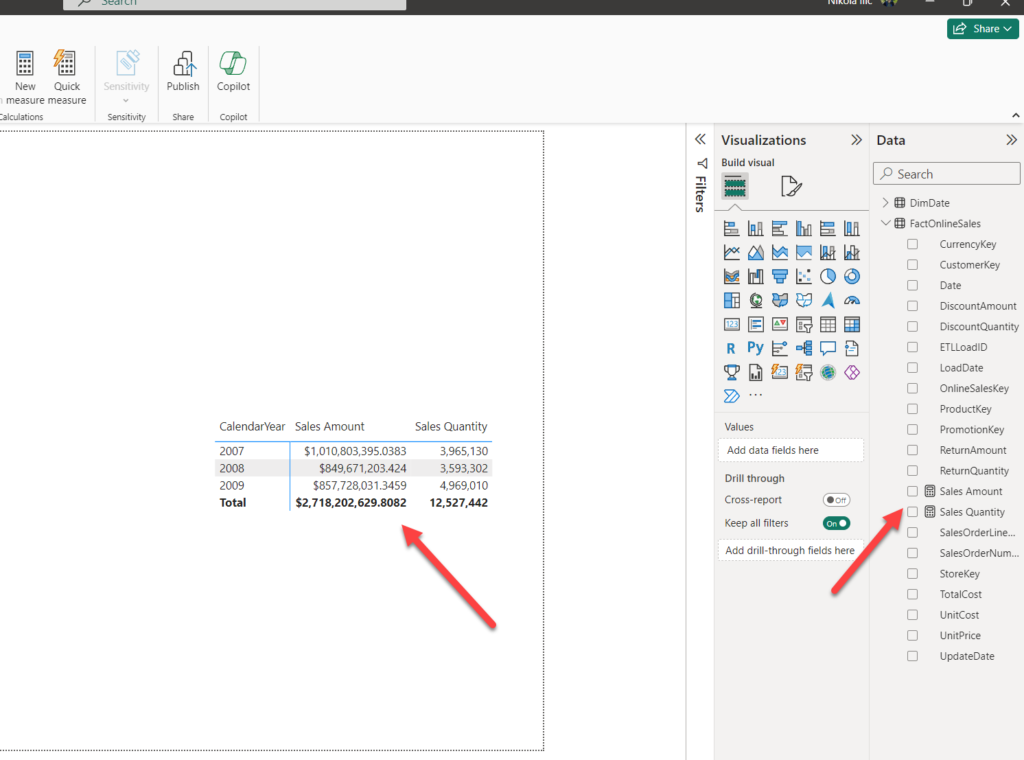
Let’s put our Calculation Group into action and create a simple matrix visual to show the KPIs:
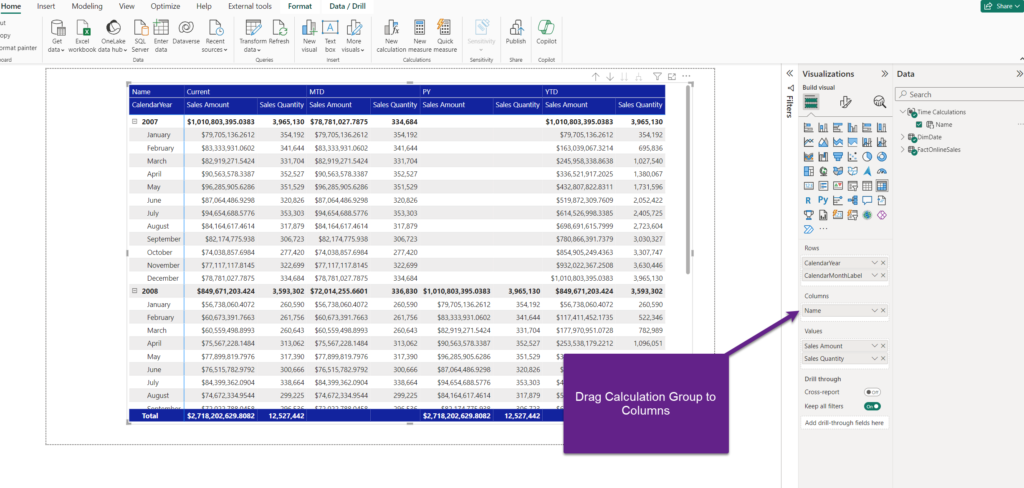
Voila! Once I drag the Calculation Group column to the Columns field of my matrix, I’m able to see all the calculations I defined in the Tabular Editor.
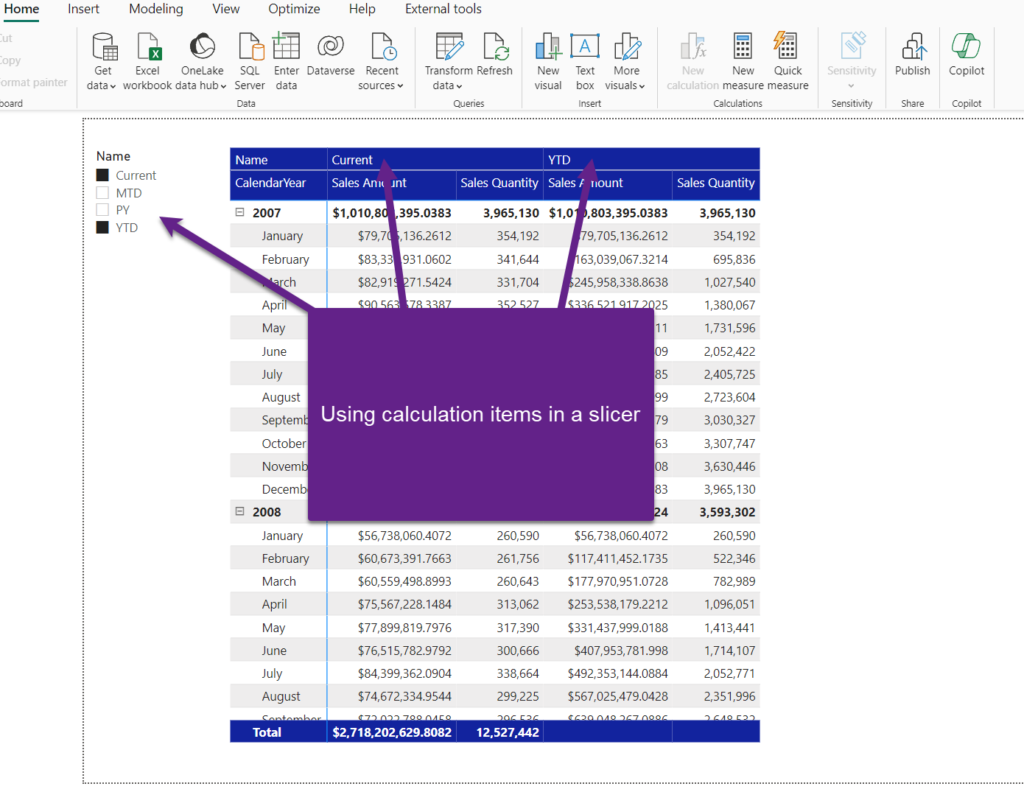
And, there is more to it! I can use this column in a slicer, so that users can select which metric(s) they want to see in the visual:
And, it’s not over yet! I can also create multiple Calculation Groups and provide report users with even more flexibility for analyzing the data, while at the same time reducing the data model complexity and redundancy.
In the following illustration, you can see that I’ve created another calculation group, called Measure Selector, where I’ve just defined two calculation items based on my base measures:
SUM(FactOnlineSales[SalesQuantity])
SUM(FactOnlineSales[SalesAmount])

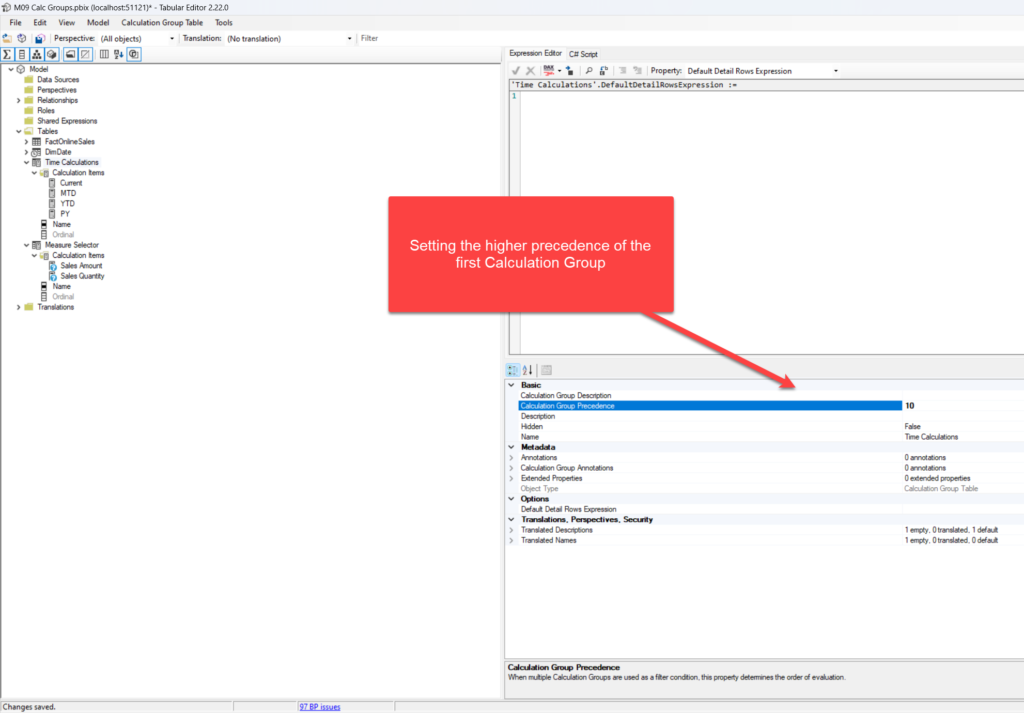
The important thing here is to set the proper precedence of the calculation groups! This is the property that defines the order of evaluation of the calculation groups, when you have multiple calculation groups in your data model. So, I’ll set the precedence of the Time Calculations group to 10 (higher precedence than the Measure Selector group):
Finally, let’s move on to Power BI Desktop and check how two Calculation Groups work in synergy:
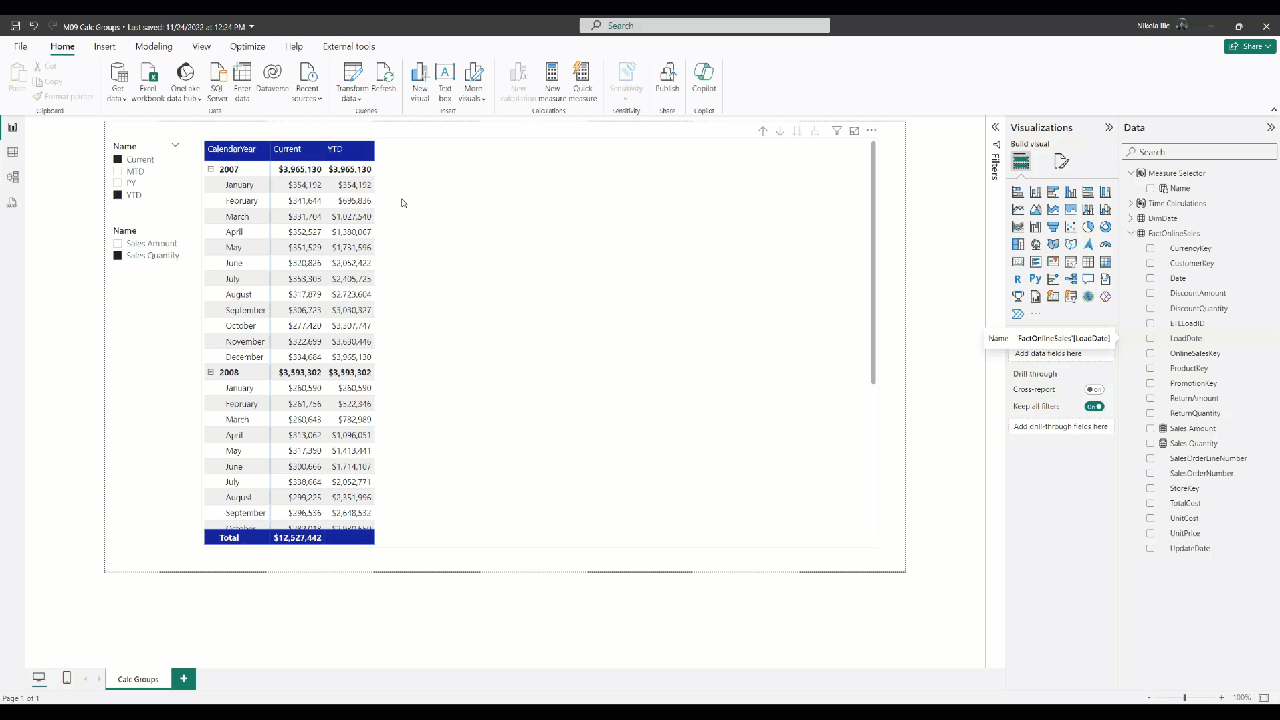
Amazing! So, instead of creating dozens of measures and bloating our data model with redundant data, we were able to achieve the same outcome by leveraging the Calculation Groups feature in Power BI!
Remark: Similar behavior with switching between different measures (Sales Amount and Sales Quantity) in the matrix visual can also be achieved with the Field parameters feature, which we will examine in the next article.
Conclusion
Calculation Groups are one of the most powerful features in Power BI! They enable you to reduce data model complexity and redundancy.
This was just a simple showcase of what Calculation Groups can do for you. Of course, there are many more possible use cases and scenarios.
If you’re interested to learn more about Calculation Groups, I suggest starting with SQLBI series of articles. Also, Bernat Agullo Rosello (x) has a series of fantastic blog posts and presentations, showing very creative ways of implementing Calculation Groups in Power BI.
Thanks for reading!
Last Updated on May 4, 2024 by Nikola


Ivan Veselinovic
Great article Nikola, as always! Calculation groups and field parameters are very useful features and I try to use them as much as possible. Even though it looks quite complex at the beginning it is actually very simple when you use to it.
However, there are some situations when I couldn’t figure out how to avoid creation of multiple explicit measurers, no matter how much I tried.
This is the one such situation:
We have new card visuals with key indicators such as Net Sales, Quantity, Gross Margin, … So, more or less standard management report. Of course, we want to compare ACT to LY and BUD.
So, let’s take Net Sales as an example:
1. data field of the new card visual we put Net Sales
2. in the reference labels section of the visual formatting we put variance vs. LY, and vs. BUD
3. and in the detail label of the Reference labels we put variance vs LY and BUD in percentage
I couldn’t find a better solution but to create explicit measures for ACT, LY, BUD, ΔLY, ΔLY%, ΔBUD, ΔBUD%
Step 1:
Selected Measure =
SWITCH(
SELECTEDVALUE( ‘Table for measures selection'[Measure] ),
“Net Sales”, [Net Sales],
“Quantity”, [Quantity],
“Gross Margin”, [Gross Margin],
“Gross Margin %”, [Gross Margin %],
“Number of Customers”, [Number of Customers]
)
Step 2:
ACT =
VAR CurrentYear = MAX( ‘Calendar Table'[Year] )
VAR Result =
CALCULATE(
[Selected Measure],
‘Calendar Table'[Year] = CurrentYear
)
RETURN
[Selected Measure]
Step 3:
For example LY (similar approach for all other measures):
LY =
CALCULATE(
[ACT],
SAMEPERIODLASTYEAR( ‘Calendar Table'[Year] )
)
What do you think, is there a better way of doing it with calculation groups and field parameters?
TAN THIAM HUAT
thanks for the article, do you have the numerical examples for us to go through that Calculation Groups, so that we can follow it step by step?