What are my best-selling products? Which customers spend the most money on my services? Which stores sold the most units of our luxury brand? Answering these, and many more similar questions are one of the most common requests when creating Power BI reports.
In order to enable proper business decisions based on answers to a questions specified above, we need to identify the respective values and sort them accordingly.
DAX offers two different functions for dealing with sorting – RANKX and TOPN. As you can intuitively conclude, the TOPN function can help you identify, let’s say, the top 5 most selling products, or top 10 customers who bought the most items last year. However, TOPN is out of the scope in this article, as we will focus on the RANKX function…
Understanding Static ranking
Static ranking assigns a ranking to a specific value, and that ranking doesn’t change – nevertheless if you are filtering the results or not! Let’s see how that looks on a real example, using (as usual) a sample Contoso database.
For starters, let’s create an explicit measure in our FactOnlineSales table to calculate the sales amount:
Sales Amt = SUM(FactOnlineSales[SalesAmount])
Now, in order to see which products brought us the most money, we need to create a new column within the DimProduct table. This column will be used to assign a ranking to a specific product, based on the sales amount:
Rank Product Sales Amt = RANKX(
                            DimProduct,
                            [Sales Amt]
                            )
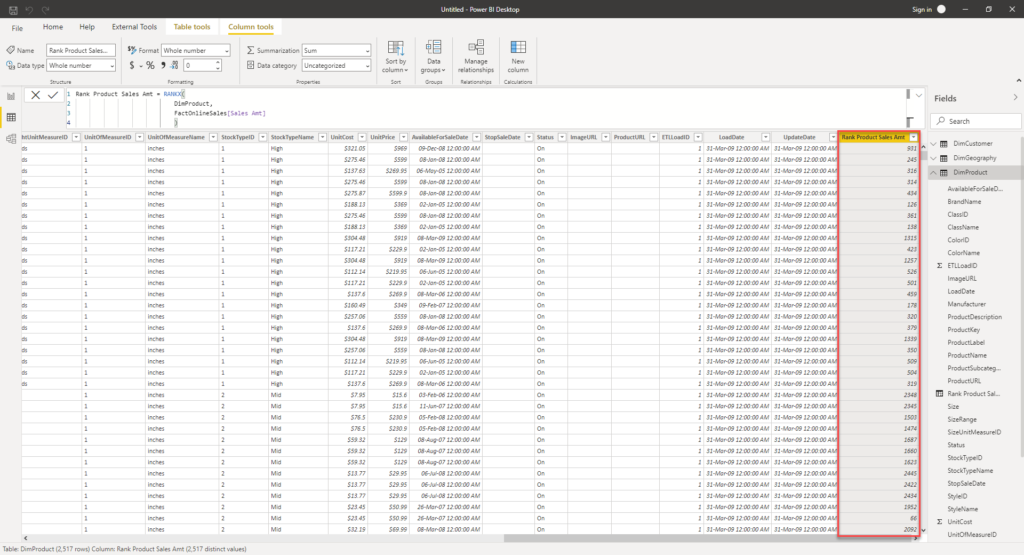
As you can notice, Power BI assigned rankings to our rows, depending on the sales amount value.
Let’s take advantage of this calculation and check which products had the largest sales amount:

Oh, I like those LCDs, they really brought a lot of money in! That looks really good, as I can quickly spot which products performed best.
However, what if I’m curious to know the performance of specific brands. Let’s add a slicer and see the figures for the Contoso brand only:
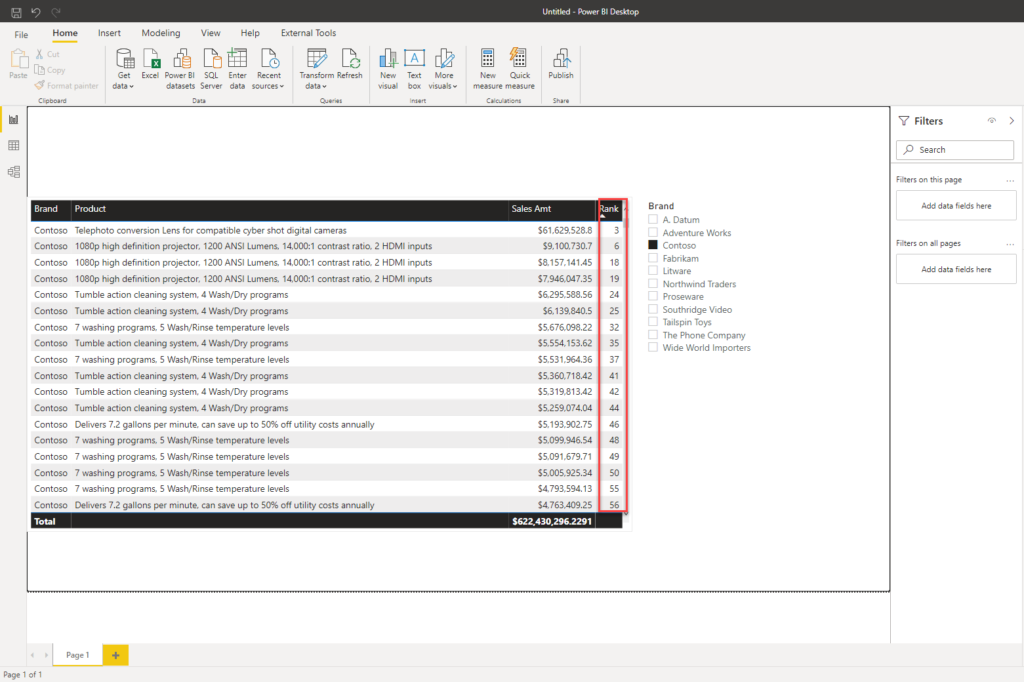
Oops, where are my number 1, 2, 4, 5…? This looks kind of weird to me, isn’t it? If you’re asking yourself: what the hell happened? Just go back to the beginning of the article, where I explicitly said: ranking doesn’t change – nevertheless if you are filtering the results or not! So, the Telephoto conversion lens will always be number 3 (unless the underlying data changes), filter applied or not!
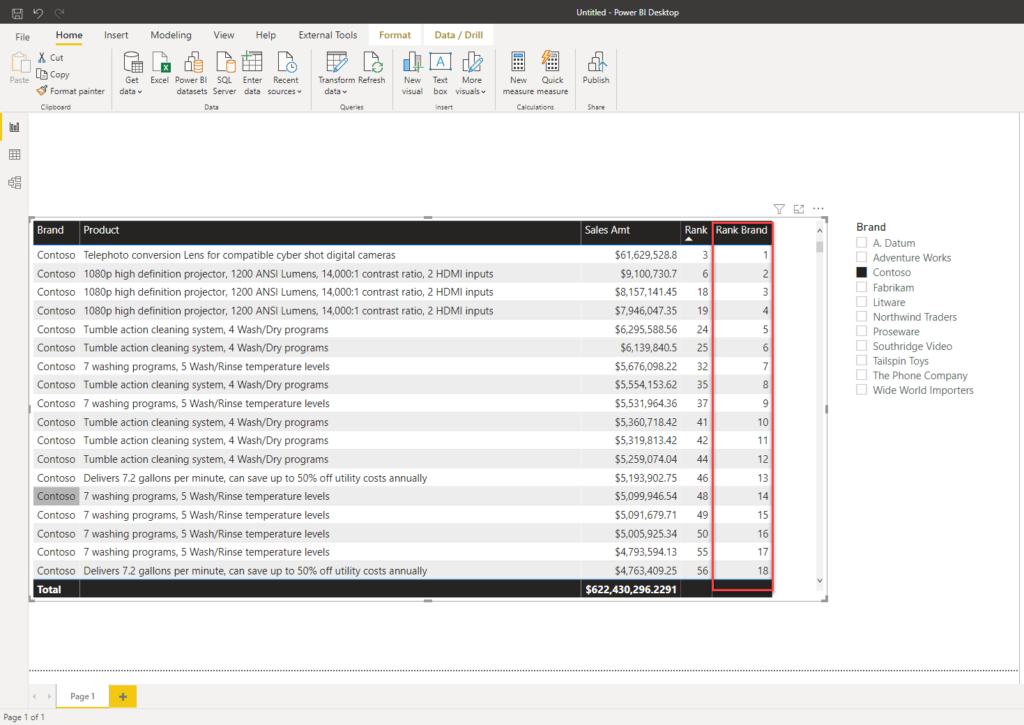
So, let’s adjust our calculation to set a proper calculation within the specific Brand:
Rank Product Brand = RANKX(
                           ALLEXCEPT(DimProduct,DimProduct[BrandName]),
                           [Sales Amt]
                    )
Here, ALLEXCEPT function will remove the filters on the DimProduct table and keep only the filters for the BrandName column, and we will get different results now:
This works fine, but this solution is far from perfect. Just imagine creating a separate calculated column for every single slicer – that would be quite cumbersome and tedious work to do! Not to mention that it would enlarge your data model, as all calculated columns are being evaluated and materialized with each data refresh, and they consume a certain portion of memory!
Understanding Dynamic ranking
Whenever you hear the term dynamic in Power BI, you should assume that you’ll have to deal with measures, instead of columns. That being said, if you want to apply dynamic ranking in your Power BI report, it means that the value of the ranking would be computed on the fly and assigned depending on the current filter context.
So, let’s create our measure that will perform exactly what we need to dynamically calculate the rankings:
Rank Product Measure = IF(
                            ISINSCOPE(DimProduct[ProductDescription]),
                                IF(
                                    NOT ISBLANK([Sales Amt]),
                                    RANKX(
                                        ALLSELECTED(DimProduct),
                                        [Sales Amt]
                                    )
                                )
                        )
Now, if we take a look at our table, you will see that ranking will be assigned based on the user’s interaction with the report:
You can see in this short video that my measure will dynamically adjust based on the user’s selection: if no value is selected within the slicer, it will behave exactly like our first calculated column. On the other hand, once I’ve selected a specific brand within the slicer, the measure will display the same results as our second calculated column!
Finally, let’s see what happens if we select multiple brands within the slicer:
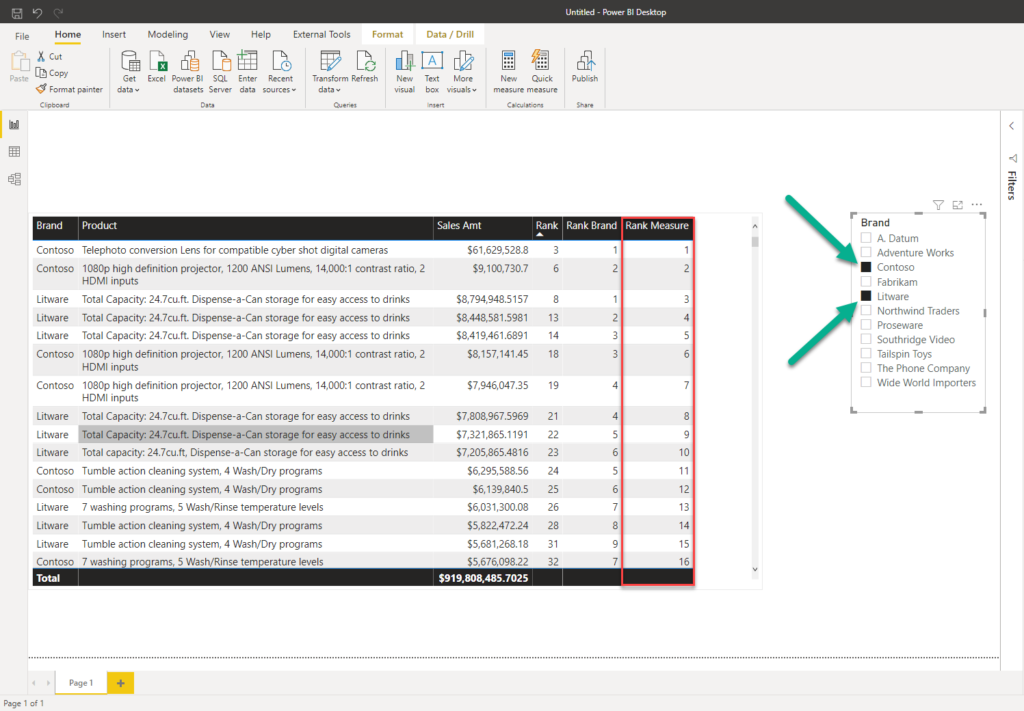
As I’ve selected both Contoso and Litware, our measure will be evaluated in a current filter context and rankings will be assigned according to it – Contoso and Litware now represent the subset to which we are applying our measure!
Conclusion
Handling requests related to rankings are quite common in most business scenarios, and understanding the difference between static and dynamic ranking is absolutely necessary in order to apply proper calculations.
There is no one single correct solution for this requirement – you should talk to your users and check what they conceive as the criteria for assigning the rankings. In any case, you should tend to apply dynamic rankings if possible, as this will ensure not just more flexibility, but it will also reduce the size of your data model and maintenance headache.
Thanks for reading!
Last Updated on January 2, 2021 by Nikola