

When I talk to people who are not deep into the Power BI world, I often get the impression that they think of Power BI as a visualization tool exclusively. While that is true to a certain extent, it seems to me that they are not seeing the bigger picture – or maybe it’s better to say – they see just a tip of an iceberg! This tip of an iceberg is those shiny dashboards, KPI arrows, fancy AI stuff, and so on.
However, there is a lot more to it, as the real thing is under the surface…
In this series of articles, I’ll show you how Power BI can be used to create a fully-fledged analytic solution. Starting from the raw data, which doesn’t provide any useful information, to building, not just nice-looking visualizations, but extracting insights that can be used to define proper actions – something that we call informed decision making.
When I talk to people who are not deep into the Power BI world, I often get the impression that they think of Power BI as a visualization tool exclusively. While that is true to a certain extent, it seems to me that they are not seeing the bigger picture – or maybe it’s better to say – they see just a tip of an iceberg! This tip of an iceberg is those shiny dashboards, KPI arrows, fancy AI stuff, and so on.
However, there is a lot more to it, as the real thing is under the surface…

This underneath portion, which consists of multiple individual, but cohesive parts, enables the above-the-surface piece to shine!
In this series of articles, I’ll show you how Power BI can be used to create a fully-fledged analytic solution. Starting from the raw data, which doesn’t provide any useful information, to building, not just nice-looking visualizations, but extracting insights that can be used to define proper actions – something that we call informed decision making.
Setting the stage
In this series of articles, I’ll use an open dataset that contains data about car collisions in NYC, and can be found here. This dataset contains ~1.8 million rows. Each row represents one accident that happened in NYC, where at least one person was injured/killed, or the overall damage was at least 1000$. Data comes in the CSV file, containing 29 columns.

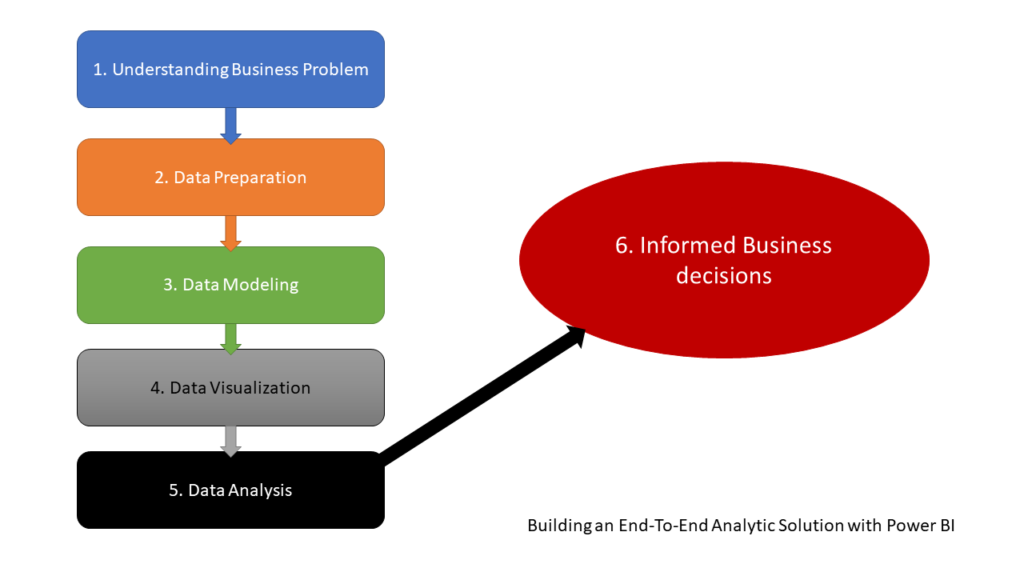
Now, before we start building our solution, we need to define the workflow and identify specific stages in the process. So, the first and most important task is to set the steps necessary to create a final outcome. Here is my list:
- Understanding Business Problem – this is the starting point, as without understanding the business problem, our solution won’t be able to address business needs. Do I want to increase the sales? Is customer retention my main goal? What will happen if I discard some services in the next quarter? These are some typical examples of the business questions that need to be answered using data insights. In this example, our “business” problem is to identify critical locations for collisions, and try to prevent accidents in the future
- Data Preparation – in this stage, we need to perform some steps to make our data ready for further digest. Starting with data profiling, so we can identify possible outliers and anomalies, then applying various data shaping techniques to prepare the data BEFORE it becomes part of our data model
- Data Modeling – As we are building an analytic solution, data model must satisfy (or at least SHOULD satisfy) some general postulates related to data modeling. For most analytical systems, including Power BI, dimensional modeling is the way to go – so, we need to decompose our original wide fact table and leverage Star-schema concept to establish the proper data model
- Data Visualization – this is the stage that folks from the beginning of the article will like most:)…It’s time to please our eyes with numbers and display them using convenient Power BI visuals
- Data Analysis – having a nice visual is fine, but it needs to provide some insight to a person looking at it. Therefore, the main purpose of this phase is to provide the insight – for example, what are the peak hours for car accidents in NYC? What are the most risky locations? How many pedestrians were injured in Queens? And, so on…
- Informed business decisions – this is an optional phase and could’ve been excluded from this solution and left completely to business stakeholders. But, hey, let’s play our Data Analyst role till the end and give some recommendations based on the insights we obtained in the previous phase!
1. Understanding Business Problem
The first and most important step for building your (successful) analytic solution, in order to serve its purpose and be adopted by the users, is to give answers to key business questions. No one needs pretty dashboards and cool visuals if they don’t provide insight and help decision-makers understand what is happening and why.
How can I increase my sales? Why did so many customers leave us in the previous quarter? What can I do to improve the delivery process? When is the best period to target the market with promotions?
These are just a few most frequent questions asked by business stakeholders. Not just that – maybe an insight into the underlying data can help users identify completely new patterns and ask a question: are we solving the right problem?

Therefore, it is extremely important to identify the key questions at the very beginning, so we can shape and model our data to answer those questions in the most effective way.
For our dataset, we don’t have to deal with “classic” business questions- as there are no sales, products, promotions… However, it doesn’t make it less “worth”, let alone allowing us to skip some of the steps defined above. Some of our “business” questions could be:
- What are the riskiest locations in the city?
- Which time of the day is the most critical?
- What is the percentage of pedestrians among all injured persons?
- Which city boroughs have the highest rate of accidents?
- What car types are most frequently involved in the accidents?
The final goal in finding the answers to these questions would be to identify the key indicators that cause collisions (Data Analysis stage), and somehow try to act and prevent future accidents, or at least reduce their number (making informed decisions).
Conclusion
Power BI is much more than a visualization tool! Keep repeating this sentence, and don’t forget the illustration of the iceberg from the beginning.
In this article, we laid the theoretical background and explained the concepts which are the key pillars of every successful analytic solution. In the next part, we will start exploring our dataset, try to identify the possible anomalies, check if some parts of the dataset need to be enhanced or restructured, and finally shape the data in the form that will enable us to build an efficient data model for the subsequent phases in the process.
Thanks for reading!
Last Updated on July 16, 2021 by Nikola


christopher majka
Looking forward to this series of posts – very relevant for any Power BI user out there!
Nikola
Thanks Christopher, glad to hear that you find the article useful! Hope you’ll enjoy the rest of the series:)
Anil
Thank you so much for the wonderful explanation about BI. I am curious to learn thoroughly. How can I get the next parts, please. Regards