

You know that I’m a huge Power BI evangelist. One of the things I like most regarding Power BI is that it gives you the flexibility to tell the story with your data in multiple different ways. Basically, you’re not limited to ready-made solutions only (nevertheless that those solutions are quite often sophisticated enough to satisfy all your reporting needs).
With some creativity and a little tweaking here and there, you can create an unforgettable experience for your users. And they will appreciate you because of that!
Simple request – simple solution!
A few weeks ago, I was working on a report for our Sales department. Guys from Sales are not very demanding when it comes to reporting design – they want to see their numbers as quickly as possible, and don’t pay too much attention to the visual look.
Essentially, they would be grateful for having something like this:
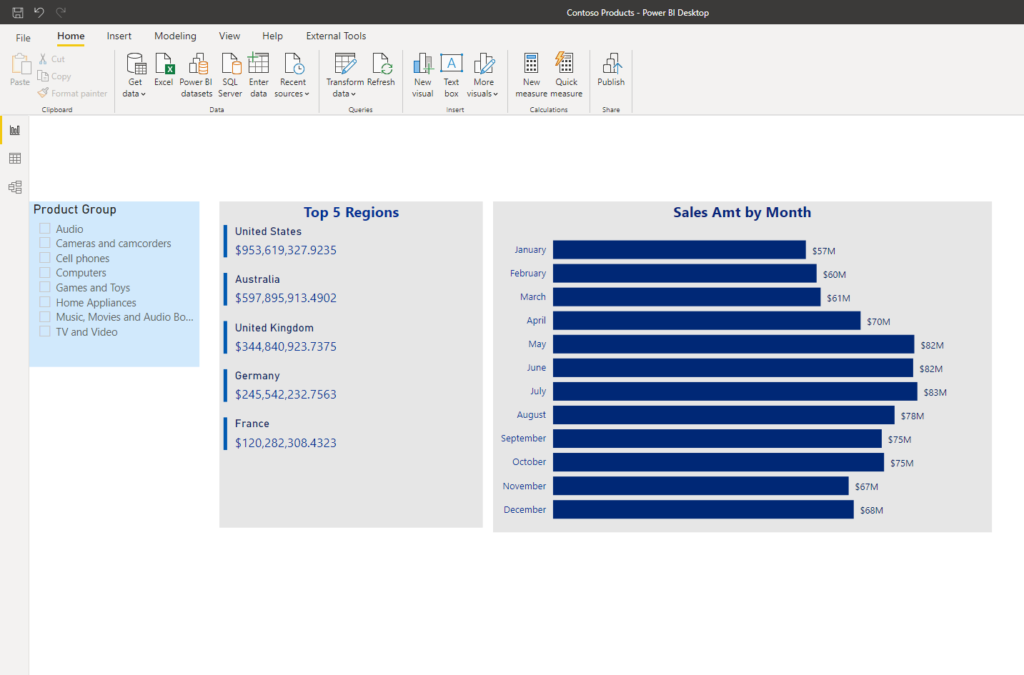
So, two simple visuals, and a slicer for slicing and dicing the data. And there is nothing wrong with it! But, since I’ve had some additional time to invest in this report’s development, I’ve decided to offer them a much more eye-pleasing solution…
As usual, I’m using a Contoso sample database in all of my examples.
Take advantage of using PowerPoint
When I want to create a nice report background, I like using PowerPoint. This gives me the possibility to group all ideas, visuals’ placeholders, text boxes, etc. in one single place. Working this way will also reduce the number of visuals on my Power BI report canvas, and consequentially, the time needed for the report rendering.
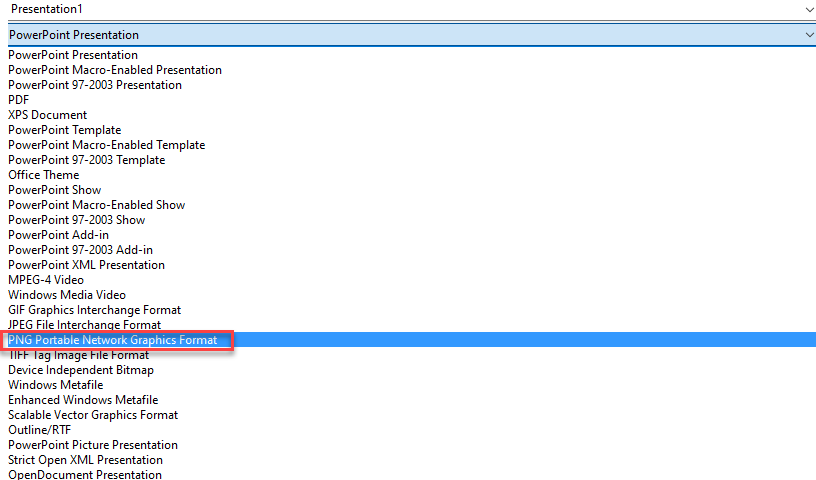
Using PowerPoint, you are substituting multiple visuals with only one! The trick is – as soon as you create your desired background, just save it as a .png or .jpeg file:
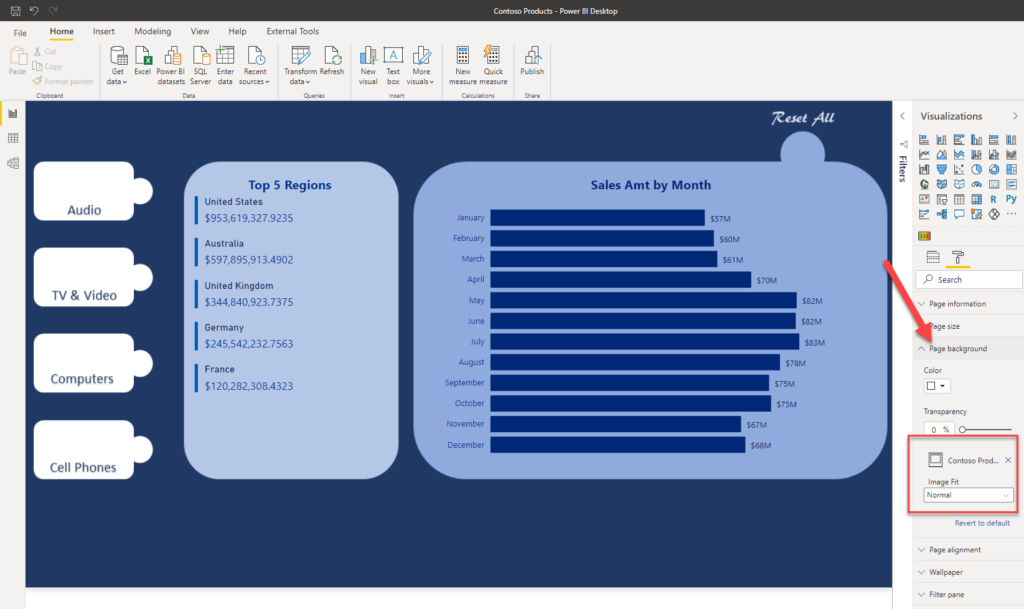
By the way, here is how my report background will look like:

Let me just briefly explain the idea for the new report look. Two large placeholders in the middle of the canvas will contain the main visuals. On the left-hand side is where the magic happens!
I’ve decided to put images and use them instead of plain simple slicer visual. This way, my users will have an app-like experience, like they are navigating through a website.
Bookmarks hold the key!
Bookmarks are one of the coolest features in Power BI! Essentially, what Bookmark does, it captures the current state of the report, so you can use it as a reference in your actions through buttons, images, shapes… This will basically give you a possibility to create an app-like experience for your report and make it look interactive.
There are really dozen use cases where you can apply bookmarking, and this is one of them.
The first step is to put our background created with PowerPoint, as a background image in Power BI:
Now, I will insert icons in the placeholders on the left. These icons will be used to navigate the user between various bookmarks:
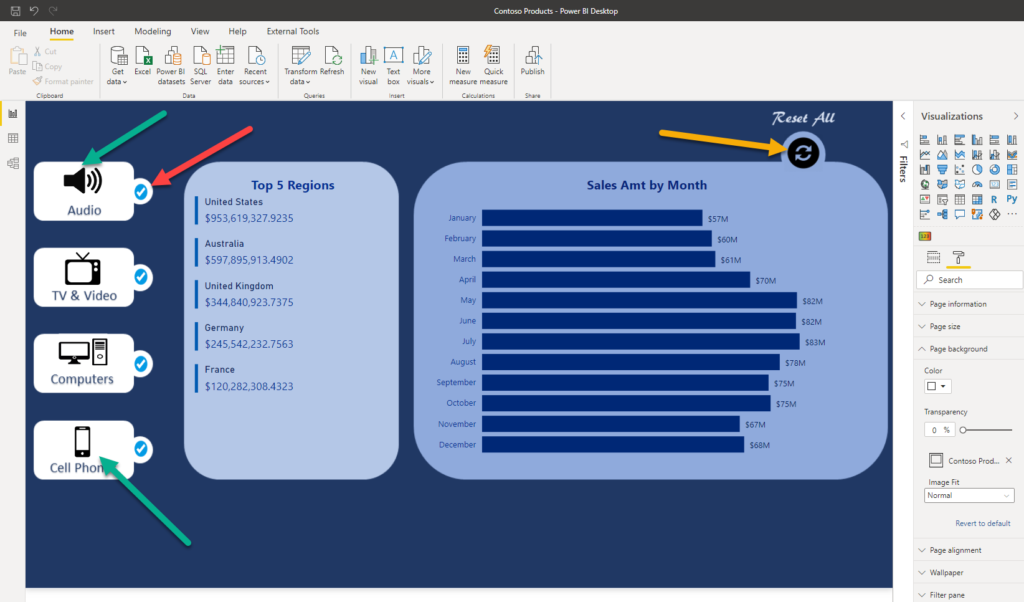
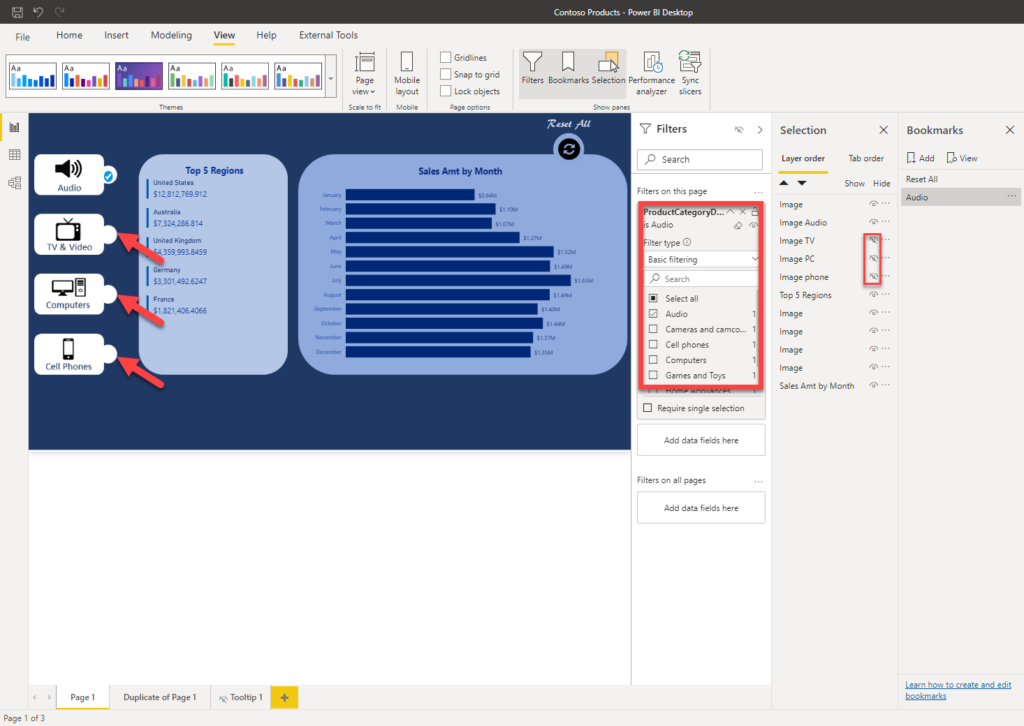
Short explanation about the images used in the report:
- Images marked with the green arrow will be used as “slicers”
- Images marked with the red arrow will be used to indicate which “slicer” is currently applied
- The image marked with the yellow arrow will help us to revert to the starting point and see data for all product categories (no slicers applied)
The first bookmark I’m creating will capture the default look of the report – all product categories included:

The most important thing here is to leave the Data option checked, as that will capture the current state of the page, including all filters applied (in our case, no filters had been applied)!
Let’s now create a view for the Audio product category. I will hide all images except for Audio. The key thing here is to apply the filter in the Filters pane, in order to show data for the Audio product category only!
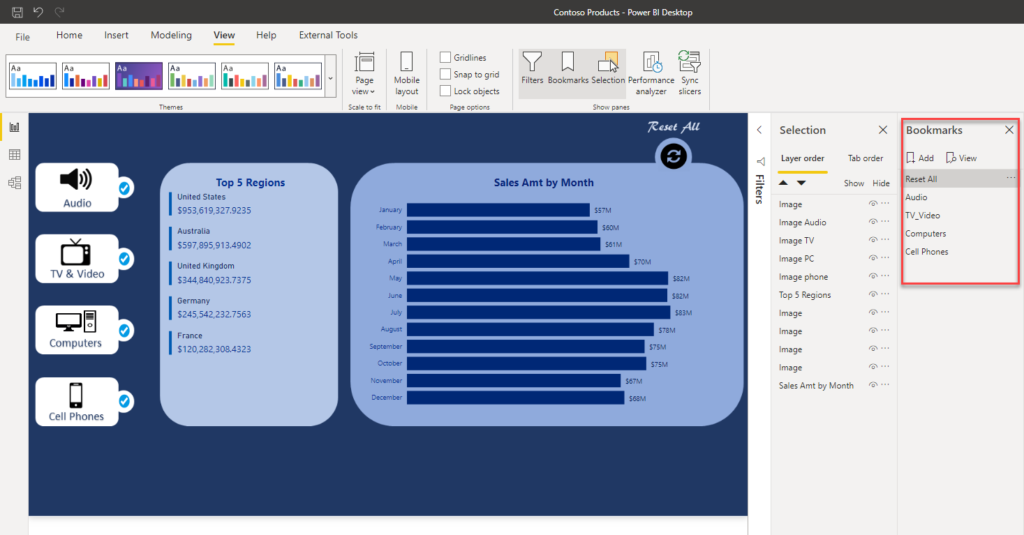
Again, leave the Data option checked when creating a bookmark. Repeat the same steps for the other product categories, so the final look of Bookmarks pane will remind to something like this:
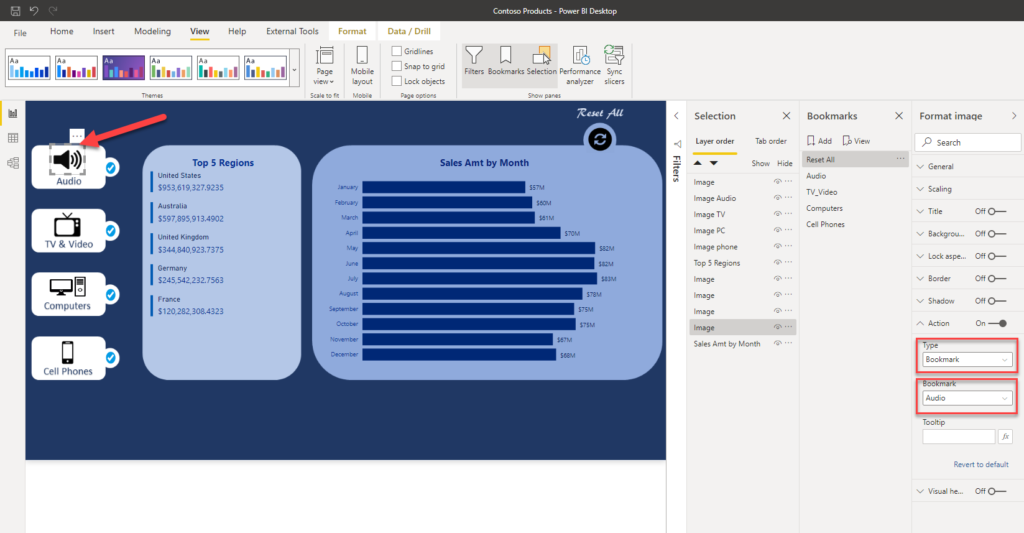
Now, we need to specify actions for our images, so they work as a navigation between different bookmarks. Let me show you how it’s done for the Audio product category, and you can then easily follow the same pattern for the remaining categories:
The final step is to hide the Filters pane from our users, as they don’t need to know how the report works under the hood:
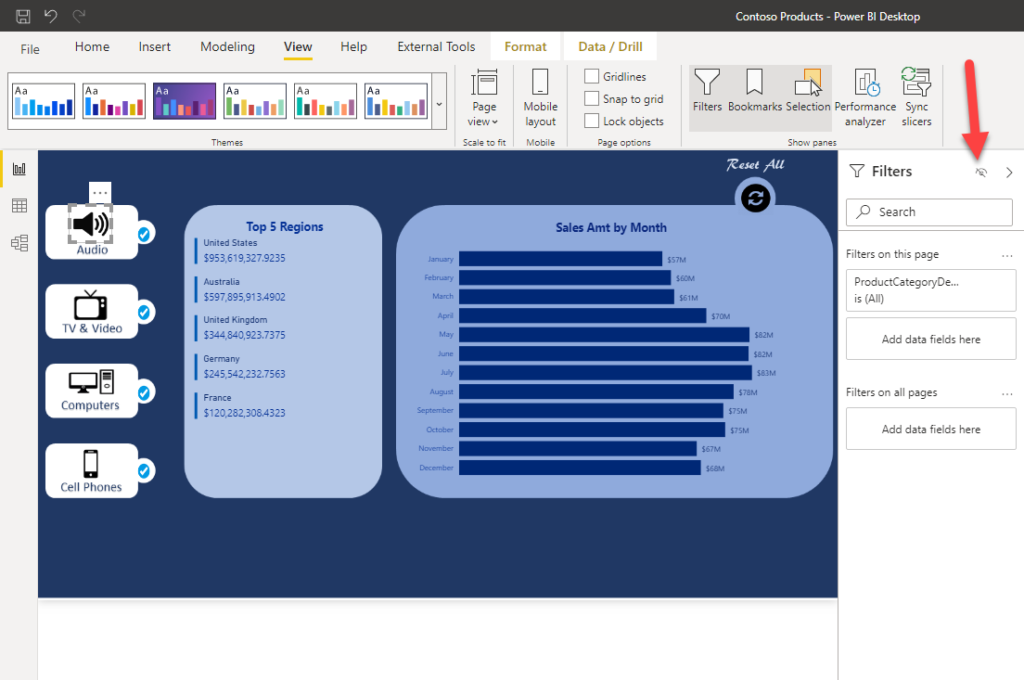
After I published my report to Power BI Service, here is how it looks:
If you ask me, that looks much better comparing to our starting point:)
Conclusion
As I’ve already said many times, Power BI is so powerful when it comes to flexibility. You’ve just seen how some basic background formatting, clever usage of bookmarks and images, can push your report to a whole new level.
I don’t need to say that my Sales team was in awe after getting this report. And that is the most important takeaway from this article: always try to put some additional effort, in order to enable your users to enjoy using the report!
Last Updated on October 27, 2020 by Nikola


Weekly Data Round-up 01
[…] Slicing Data with Images in Power BI – Nikola Ilic (DataMozart) has blogged about how to use images for slicing data in Power BI reports here. […]