
This article is the part of the series related to mastering DP-500/DP-600 certification exam: Designing and Implementing Enterprise-Scale Analytics Solutions Using Microsoft Azure and Microsoft Power BI and Implementing Analytics Solutions Using Microsoft Fabric
Table of contents
If you follow my blog on a regular basis, you know that I’m a huge advocate of proper data modeling. In my opinion, it’s the key stage in designing efficient BI solutions (I’ve intentionally omitted Power BI as a specific tool, as data modeling is more of a general concept). I consider it so important, that together with my friend Tom Martens, we decided to debunk the most common data modeling challenges in Power BI and create a series of articles on data modeling topics.
Power BI is a two-edged sword!
Let me explain the bold statement above. Power BI enables you to quickly get up and running – in literally a few minutes, you can transform a plain wide table with a bunch of numbers into nice-looking charts and visuals. And, you don’t need to know a single thing about the Star schema, fact, and dimension tables, relationships, etc. Power BI will get you covered!
However, once the requirements begin to scale, you may find yourself in a desperate position, with a tough decision on how to proceed. I’ll give you a simple analogy:
You can ride a bike without the hands on the steering wheel, because you’re using a cell phone while riding. And, you will reach your destination if there is no traffic, no crossroads, no damaged road, and so on…However, once you face any of these challenges, you’ll probably find yourself on the ground (and, hopefully, not hard injured)!

It’s similar with Power BI – you may “sneak” without data modeling in some very basic scenarios, but sticking with this behavior will come back to haunt you, as soon as things become more complex.
And, this is especially true as the amount of data starts to grow!
You’ve probably heard about “big data” already. And, maybe you’ll think: if I know how to handle big data, I’ll know how to handle large data too…Aren’t they the same?
Big Data <> Large Data
While big data is usually related to a specific set of technologies that rely on distributed processing (such as Hadoop a decade ago, Apache Spark, and the majority of the modern cloud data warehouses), large data refers to a huge number of records in the dataset. And, when I say a huge number – there is no “golden” value, like 100k, 100 million, or 1 billion records…But, in most cases, datasets with less than 1 million rows are not considered large.
Now that we know the difference between “big” and “large” data, let’s examine how Power BI fits these concepts. Under the hood of Power BI (and Analysis Services Tabular) is VertiPaq – a columnar, in-memory database! As VertiPaq keeps the snapshot of the data in cache memory, all the data must reside on a single node – which means that VertiPaq is not a distributed architecture!
Because VertiPaq works in a specific way, datasets also have to be modeled with certain rules in mind, so that the engine can perform in the most optimal way. Before I explain how you should model your data for large datasets, let’s first understand the main characteristics of VertiPaq and how it stores the data.
As already mentioned, VertiPaq is a columnar database. This means that the data in each column is stored physically separated from the data in other columns:
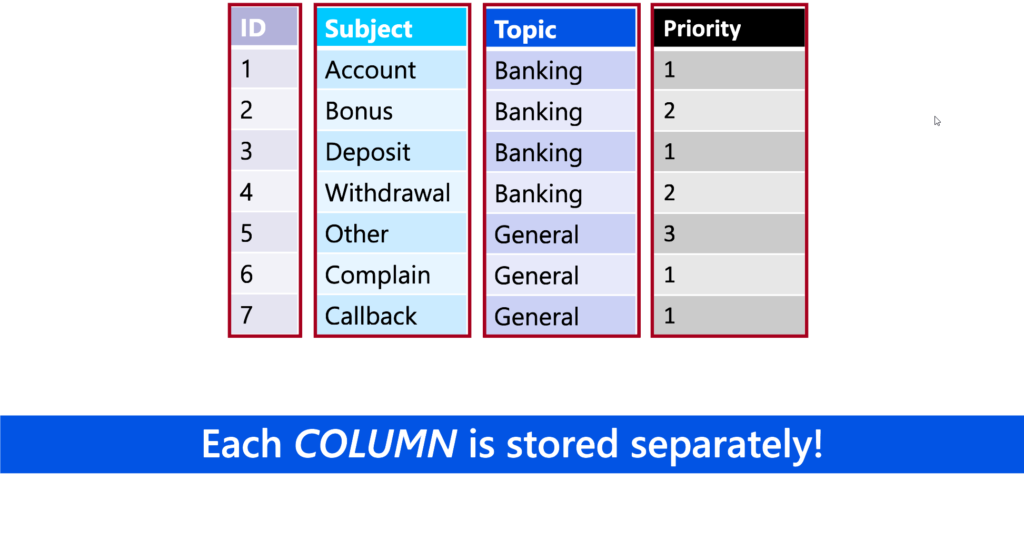
Based on the number of distinct values in the column, which is known as cardinality, data distribution (are there many repeating values in the column?), and data type (numeric vs text), VertiPaq applies specific algorithm to compress the data. With all these points in mind, it’s fair to say that VertiPaq excels in vertical scanning, while it performs much worse when it needs to retrieve the data from multiple different columns.
So, what would be the most desirable data structure for VertiPaq (and, consequentially, Power BI)?
“Tall” vs “Wide” tables
Before we come to answer what is the best approach when designing for performance in Power BI, let’s introduce two types of tables that are the most common in the data modeling process.
When you have a huge number of rows (we are talking about millions of rows), but just a few columns, we’re talking about a “tall” table.
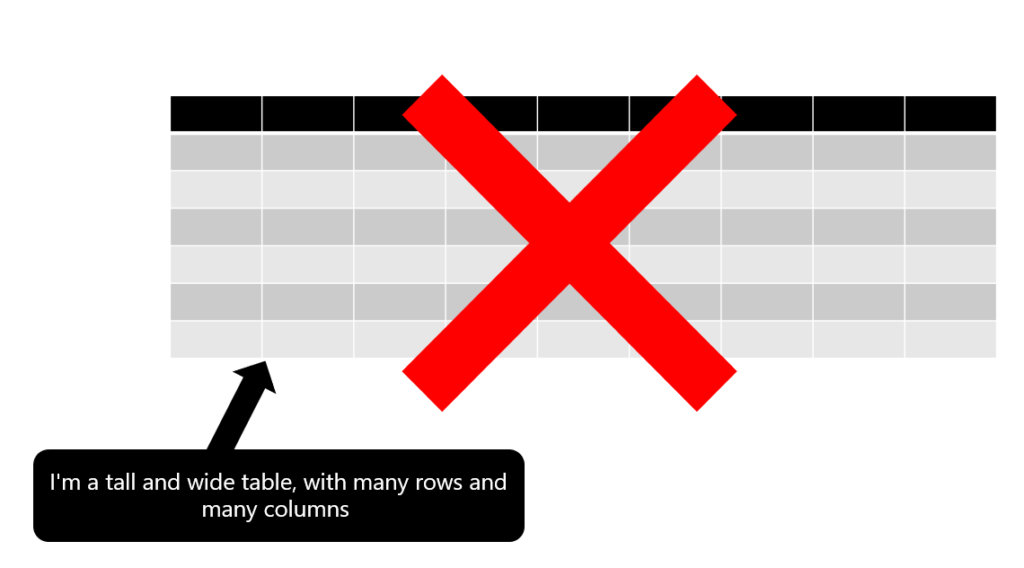
On the flip side, if a table consists of many columns, it’s usually referred to as a “wide” table. There are two scenarios with wide tables: a table contains a lot of columns, but not many rows (dimension tables are a good example); or, a table contains a lot of columns, but also a huge number of rows (“tall” & “wide” at the same time).
Depending on the table “height” in these two scenarios, Power BI will behave differently:
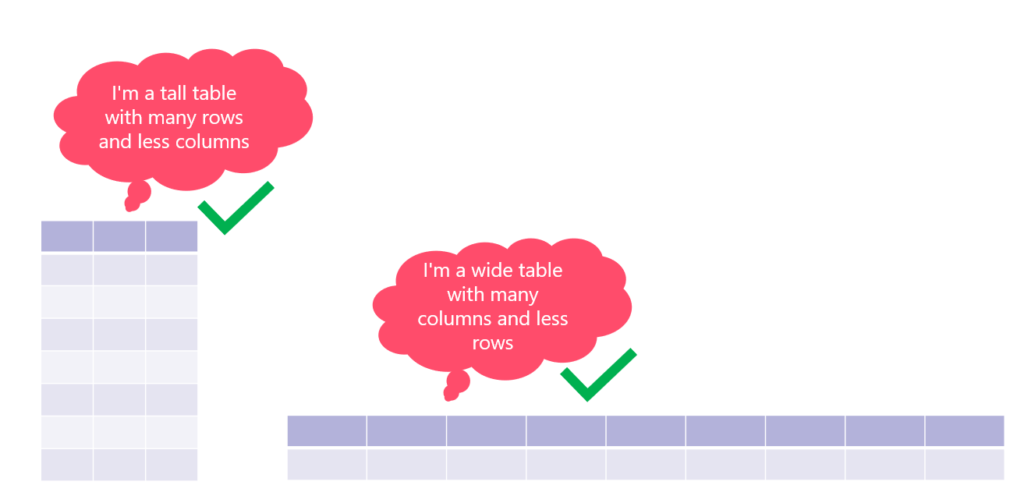
If the table is either “tall” or “wide”, VertiPaq should perform great!
However, if the table is both “tall” and “wide”, that’s usually a “road to hell”…
If you’re wondering: how do these tables become part of the Power BI solution?! Well, a lot of Power BI developers transitioned from Excel, where working with one flat and wide table is a standard way of doing things. Additionally, a lot of developers blindly follow users’ request: “Give me everything!” and include all the columns from the source system, without thinking about the possible consequences…
It’s always better to start small and keep it simple, and then extend the data model with additional tables/columns when the business case requires them.
How to optimize large datasets?
Here is the list of the recommended practices for large datasets optimization:
- Import only necessary data – I know that it sounds obvious, but trust me, in most cases sticking with just this simple rule will make astonishing savings in the data model size
- Reduce the column cardinality – as explained in this article, cardinality is the biggest “enemy” for optimal data compression. There are various techniques for reducing the cardinality levels, such as summarizing the data, splitting columns, etc.
- Aggregate when possible – we will cover aggregations in more depth in one of the next articles. Keep in mind that aggregations reduce the table “height”, so VertiPaq will have to scan a lower amount of data
- Use proper data types – if your users don’t need to analyze data on the hour, minute, or second level of granularity (and probably in 99% of cases they don’t), there is no need to use Date/Time data type. The plain Date data type will be completely fine
- Avoid DAX calculated columns – to put it simple, these columns are not being optimally compressed. Whenever possible, apply calculations on the data source, or eventually in the Power Query
- Turn off the Auto Date/Time option – this is a general recommendation, but it may have a significant impact on the large datasets specifically. If you keep this option turned on, Power BI will automatically create a hidden date table for each date column in your data model
Conclusion
Even though Power BI lets you sneak without proper data modeling to create shiny dashboards in a matter of minutes, I would strongly suggest not taking this shortcut path. As soon as your solution starts to grow, without a well-thought data model, and without sticking with recommended practices when dealing with large datasets, the solution becomes pretty much limited in terms of performance and scalability.
Thanks for reading!
Last Updated on December 17, 2023 by Nikola


Rani
I appreciate how you present the concepts in an easy-to-understand way. Many thanks, Nikola!!