This article is the part of the series related to mastering DP-500 certification exam: Designing and Implementing Enterprise-Scale Analytics Solutions Using Microsoft Azure and Microsoft Power BI
Table of contents
If you carefully follow this series on Mastering DP-500 exam, I’m sure you’ve already realized that I’m a huge advocate of external tools in Power BI! We’ve already learned how to leverage two most popular tools, DAX Studio to troubleshoot the performance of your DAX queries, and Tabular Editor 2, to optimize the data model.
In this article, we’ll examine another handy external tool, which is integrated into DAX Studio – this tool is called VertiPaq Analyzer.

VertiPaq Analyzer was developed by SQLBI.com folks (Marco and Alberto) and can be downloaded directly from their website. However, the much more popular use case of the tool is directly from the DAX Studio, since the VertiPaq Analyzer is integrated into it.
In a nutshell, VertiPaq Analyzer collects the data from various DMVs (Dynamic Management Views) in Analysis Services (don’t forget, Power BI stores the data in the instance of the Analysis Services). Now, you’re probably asking yourselves: what is a DMV?! That’s a good question, so let’s quickly answer it: DMVs are queries that return information about model objects, various server operations, connections, active sessions, and so on. You can run DMVs on your own from different client tools, such as SQL Server Management Studio or Azure Data Studio.
However, it would be a tedious task to write multiple queries and collect and analyze all the data returned by these queries. And, that’s exactly where VertiPaq Analyzer becomes your best friend!
VertiPaq Analyzer collects the data from various Analysis Services DMVs and displays them in a more convenient, easy-to-understand way!
Let’s see how VertiPaq Analyzer may be leveraged to analyze Power BI data model efficiency.

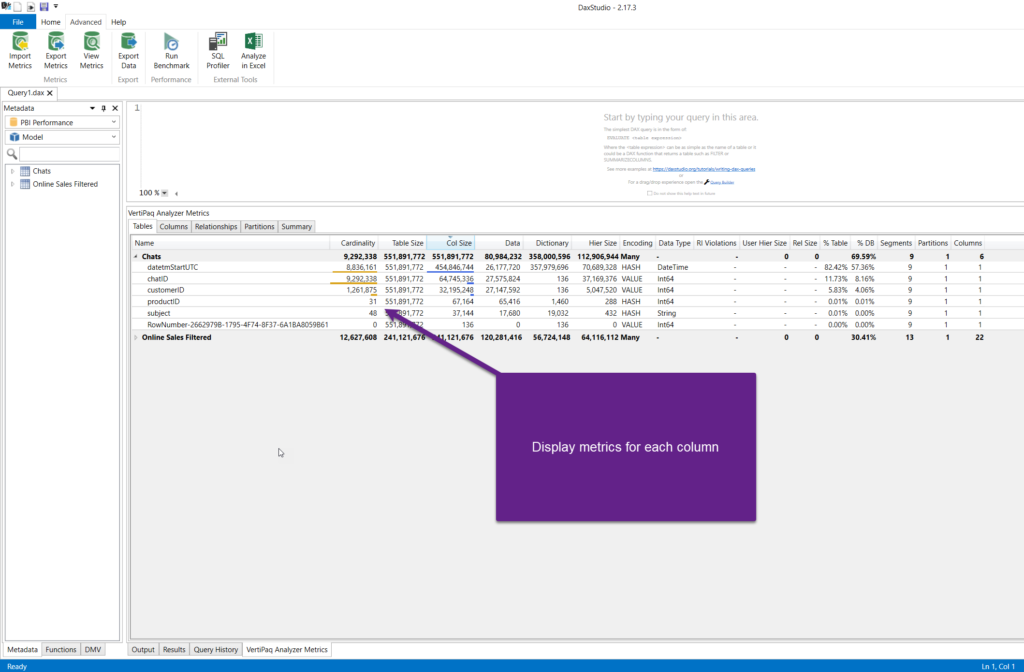
Once I launch DAX Studio from the Power BI Desktop, under the Advanced tab, there is a View Metrics button. As soon as you click on it, you should be able to see various metrics related to your data model. By default, you’ll see the Tables tab, which shows all the tables in the model, including key numbers behind them – for example, the number of rows in the table (Cardinality), Table size, Hierarchy size, and so on. Keep in mind that all these numbers are displayed in bytes, which in our example means that the Chats table takes 551 MB of memory.
If you click on the small arrow next to a table name, you’ll see all the metrics broken down to an individual column level:
And, this is where VertiPaq Analyzer really comes to the rescue! If you’re troubleshooting a poorly performing report, VertiPaq Analyzer will quickly help you identify potential culprits.
You can spot the most expensive model objects in a matter of seconds! Based on the insight, you may decide to stick with the current solution, or try to optimize it. Specific optimization techniques are out of the scope of this article, but you can find a real-life example of reducing the data model size by a whopping 90% with the help of VertiPaq Analyzer in one of my previous articles.
In this case, you may wish to optimize the datetmStartUTC column. It consumes 82% of the table memory because of its high cardinality. Additionally, the chatID column is the surrogate key from the data source system and is not part of any relationship, so that column is also a strong candidate to be removed.
Of course, VertiPaq Analyzer is not a magic wand that will automatically solve your problems and apply optimization techniques for you. But, it’s a great starting point for troubleshooting the model efficiency.
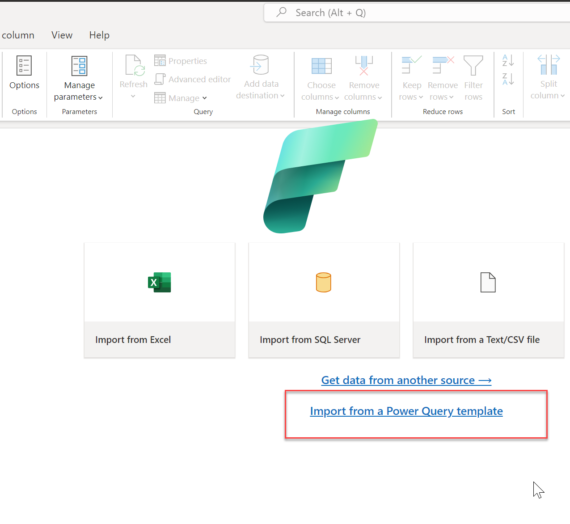
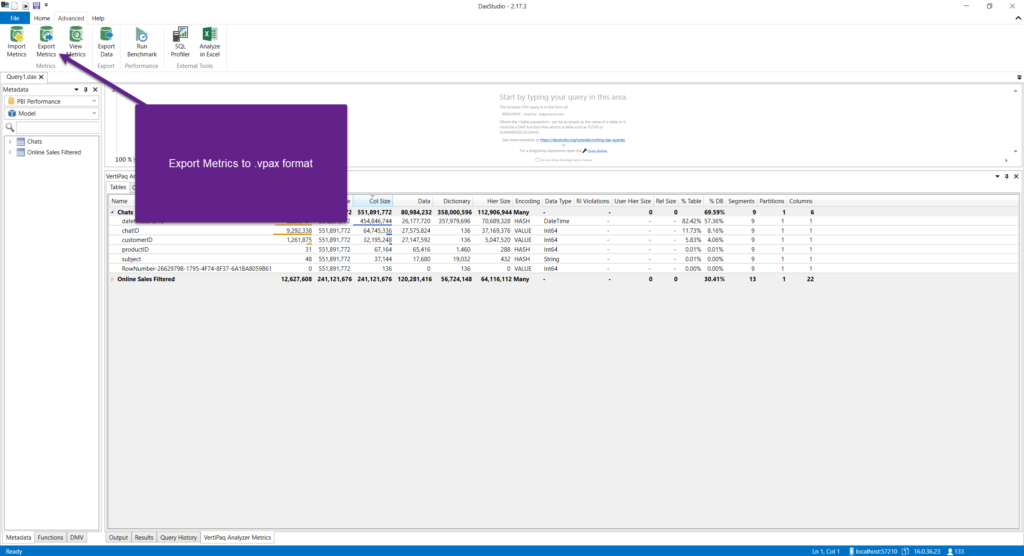
If you want to share the VertiPaq Analyzer metrics with someone else, you can choose to Export Metrics. This will generate a vpax file, that can be then further examined in Excel by someone else. The key advantage of this approach is that no data is included in the vpax file, only the metrics!
Conclusion
As you’ve seen, VertiPaq Analyzer enables you a quick and convenient insight into the data model structures. This insight provides you with a more clear picture of what is happening behind the scenes. Depending on the findings, you may decide to perform various optimization techniques that will increase the overall performance of your Power BI solution.
Thanks for reading!
Last Updated on January 20, 2023 by Nikola