
This article is the part of the series related to mastering DP-600 certification exam: Implementing Analytics Solutions Using Microsoft Fabric
Table of contents
Star schema all the things! This “maxim”, coined by my fellow Data Platform MVP, Koen Verbeeck (X) is something that every Power BI professional should always keep in mind! And, for a good reason. If you are not sure why Star schema should be your preferred choice when designing Power BI semantic models, there are many fantastic resources out there to check out:
- Guy in a Cube video
- Star schema or single table in Power BI (SQLBI)
- Star schema relevance to Power BI models – MS Learn
But, what is a star schema in the first place? I have good and bad news for you:)…The bad news is: I’m not covering it in this article, because this one focuses on explaining how to implement a star schema in Power BI (assuming that you already know what star schema is). The good news is: I’ve already written about it, so go and read this article first, if you’re not sure what star schema represents in the world of data modeling…
Now, let’s get our hands dirty and build a star schema!
Setting the stage
In this blog post, I’m going to use a sample dataset that is provided once you open Power BI Desktop:

Once you connect and load the data into Power BI, let’s do a quick tour and understand the structure of our data model. Although, in full honesty, this can be hardly considered a model, since we have a single table, and no relationships at all!

Let’s shoot for the star!
I’ll first open Power Query Editor, and identify columns that should be considered “descriptive” because they are the best candidates for dimension attributes. A quick look at our dataset, and we can spot at least four “lookup” columns:
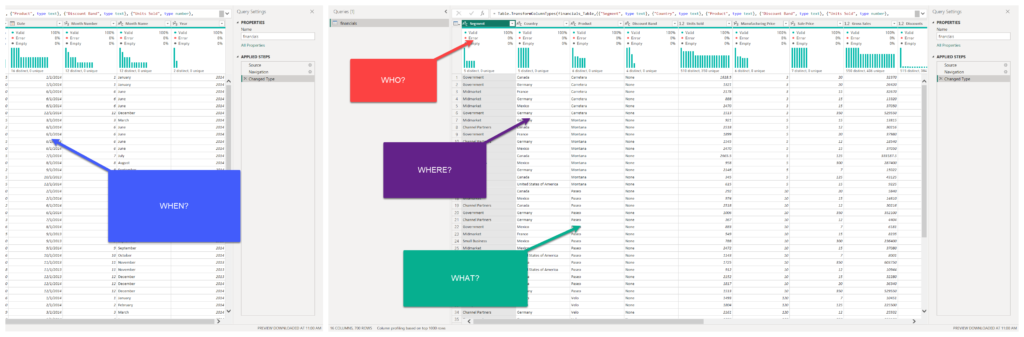
- Segment (Who?)
- Country (Where?)
- Product (What?)
- Date (When?)
Additionally, columns Month Number, Month Name, and Year also should “belong” to the Date column, as they are essentially “describing” the Date column (in which year/month is the particular date).
So, let’s start with the Segment column first. I’ll first duplicate the original “financials” table. I’m not referencing it in the Power Query, because I’ll need to perform merge operations at the later stage.
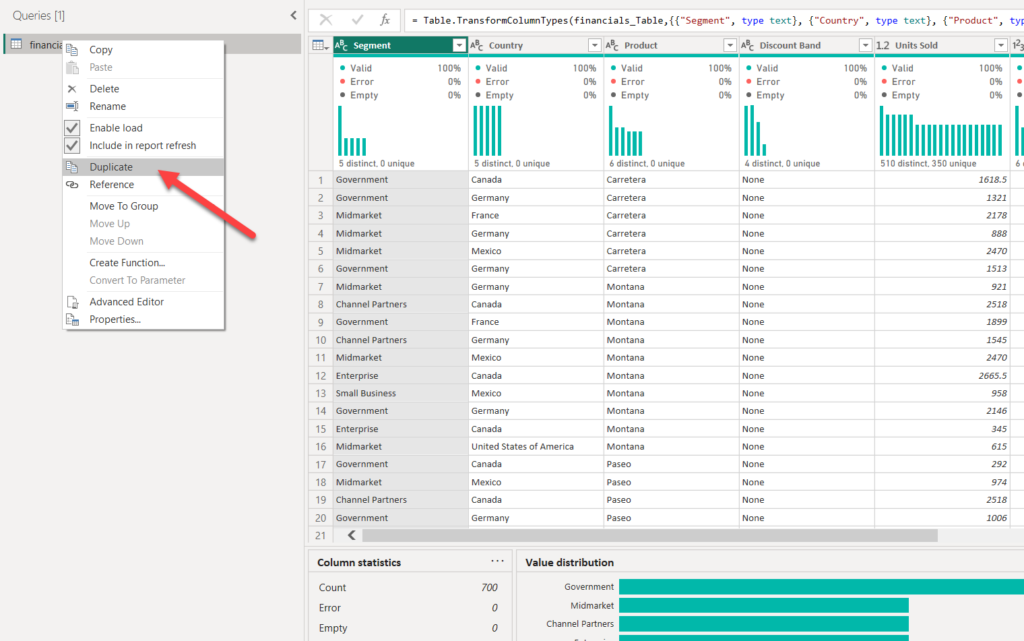
I’ll rename the duplicated query to “segment”. Then I’ll right-click on the Segment column and choose Remove Other Columns:

Once the Segment is the only column remaining in this table, I’ll again right-click on it and choose Remove Duplicates:

Now that I have unique values in the Segment table, let’s stick with the general recommended practices and use integer surrogate keys for establishing relationships in the semantic model. In this case, I could’ve also created a relationship on the existing text column, and that will work fine on this small and simple model. However, it is a general recommendation (and in accordance with Kimball’s principles) to have a numeric surrogate key in a table.
Usually, if you use Power BI to leverage the data coming from the enterprise data warehousing systems, surrogate keys will (presumably) be already part of tables. But, since in this case, we work with the data coming from the CSV file, there is no surrogate key available, and we need to create the “artificial” one in Power Query.
UPDATE 2024-04-20: Thanks to Hsan who brought to my attention that assigning index value in combination with the Merge operation can cause issues when you refresh the data. Therefore, it’s necessary to sort the column BEFORE you apply the index transformation. That way, you ensure that index values will be always assigned in the expected order.

In the Add Column tab on the top, choose Index Column, and then set it to start from 1. Finally, rename the newly created index column to something more meaningful, like SegmentID or SegmentKey.
Congratulations! You’ve just created your first dimension table.

Repeat exactly the same steps for the Country and Product columns, and create dimension tables country and product.
Now, dates…Every single semantic model should have a proper calendar (date) table! Period! In this case, I’ll repeat all the same steps as for our previous dimensions, except creating an index column for the surrogate key, because we will create a relationship on the date column itself.
Once you’re done, you should have the following tables in the semantic model:

Replacing attributes with foreign key values
In the next step, we will bring surrogate keys from dimension tables into our financials table (fact table), and use them as foreign keys in relationships to dimension tables.
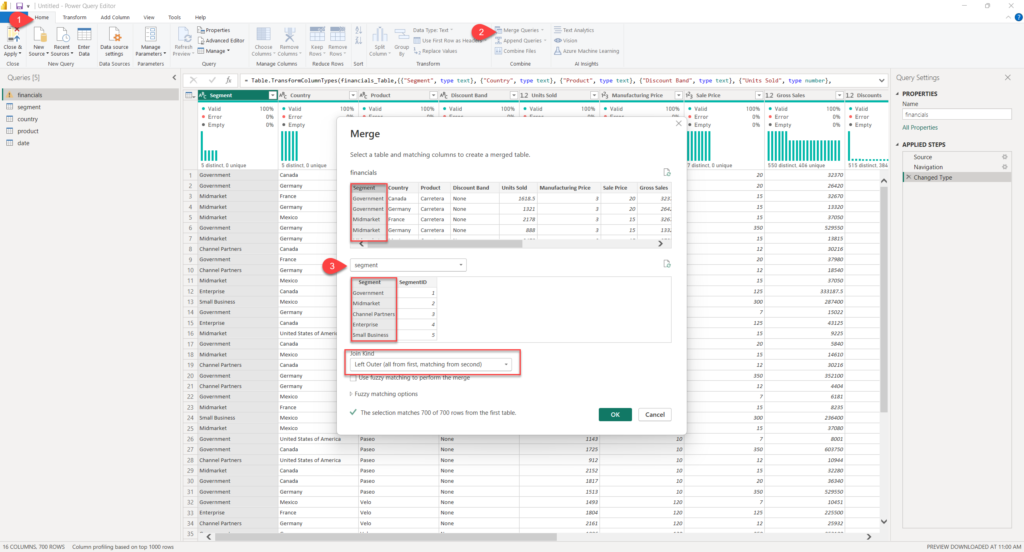
As you may see in the illustration above, we will use the Merge transformation to perform the Left outer join between two of our tables (financials and segment). We are using Left outer join, just in case that there are some rows in the financials table that don’t match on the Segment value with the newly created Segment table, and we don’t want to lose these rows from the financials table.
As soon as you confirm table merge, scroll all the way to the right and identify the segment.1 column. Click on the expand icon in the right corner, and then choose only the SegmentID column. Finally, uncheck the option for keeping the original column name as prefix:

Apply the same steps for country and product tables. DON’T APPLY merge operation for the date table, since our fact table (financials) already contains a date column, which we will use as a relationship key.
Finally, remove the following columns from the financials table:
- Segment
- Country
- Product
- Month Number
- Month Name
- Year
Wrapping up with relationships
It’s time to say goodbye to Power Query Editor and move to Power BI Desktop again. Hit Close&Apply and, once in Power BI Desktop, open the Model view:

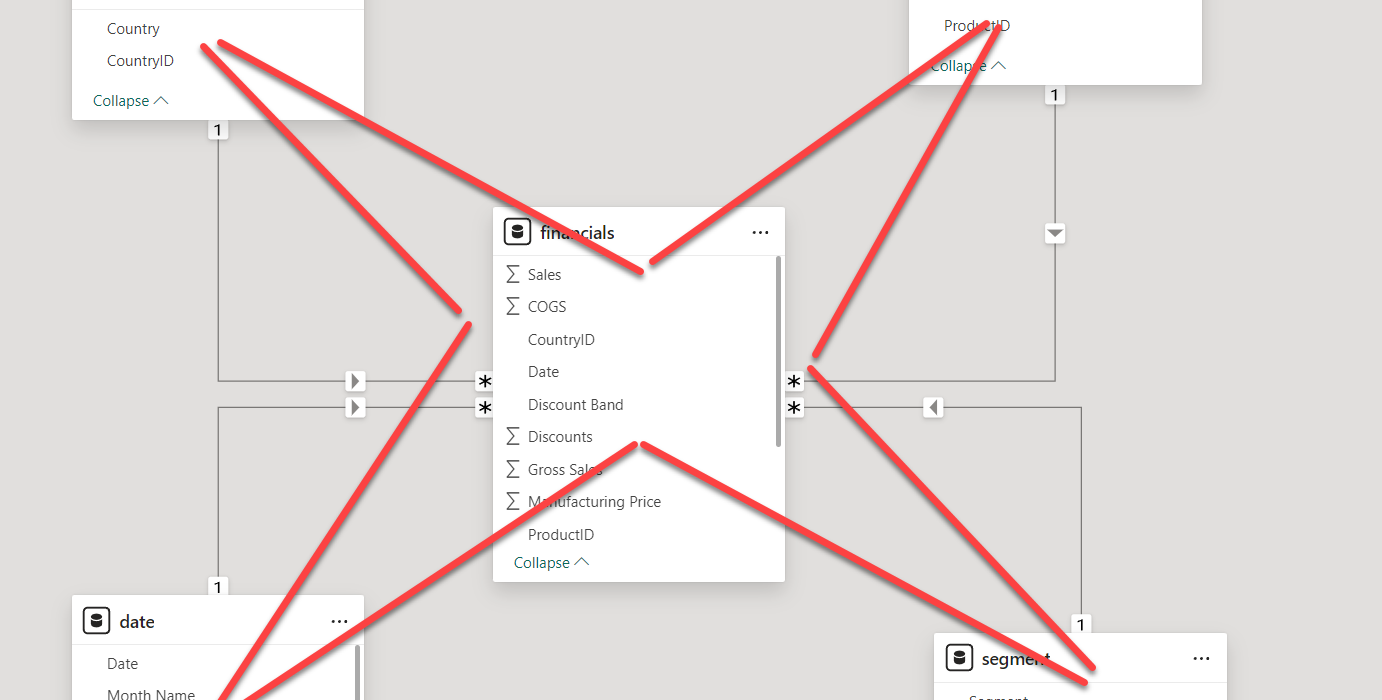
Oh, this looks (almost) like a star! As you may notice, Power BI recognized common fields between fact and dimension tables, except for the date table. So, let’s manually create a relationship between the date table and financials:
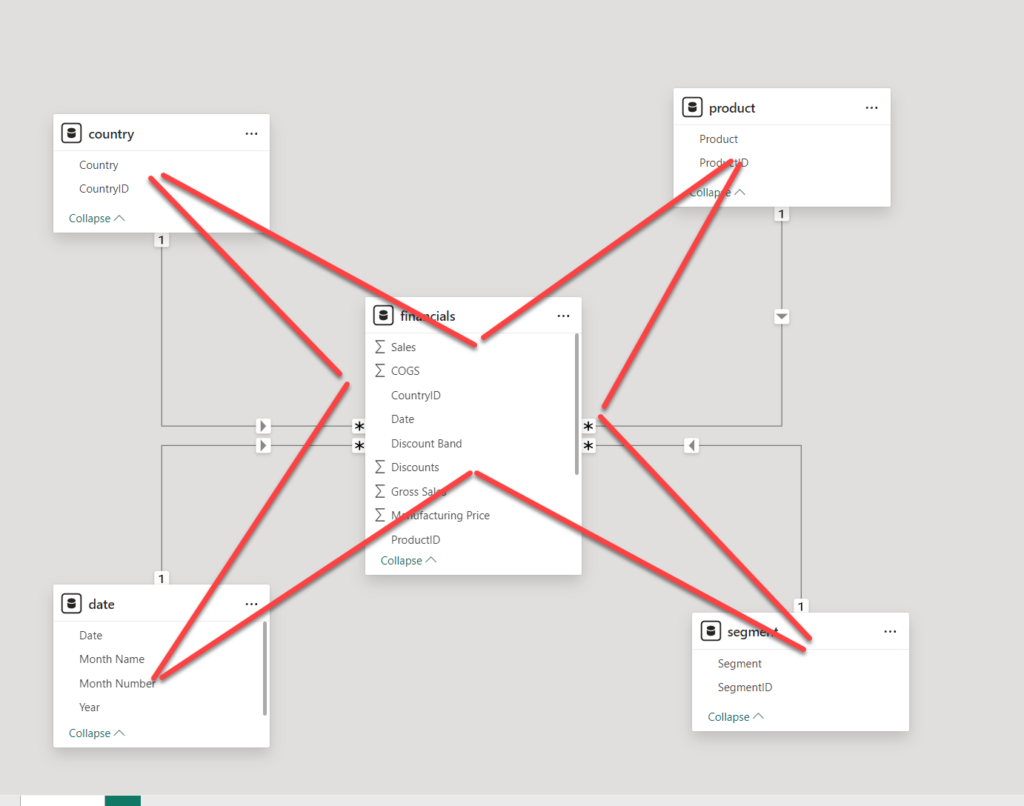
Wait, this reminds me of something:)…Ah, yes, STAR!
Conclusion
As you’ve witnessed, we managed to create a proper semantic model for Power BI in just a few steps, and without writing a single line of code, or performing some complex operations. After you establish star schema, Power BI reports should be more performant, but not only that – you’ll save yourself from the DAX complexity as well.
Thanks for reading!
Last Updated on May 4, 2024 by Nikola


Carlos Cantu
Very clear explanation, thanks for sharing!
Ynte jan
Hello Nikola
You duplicate, but you can reference as well, if you reference the dimension AND the facttablle.
You have to ‘not load’ the bass table then
Nikola
That’s correct, thanks for the hint!