TIQ stands for Time Intelligence Quotient. As “regular” intelligence is usually being measured as IQ, and Time Intelligence is one of the most important topics in data modeling, I decided to start a blog series which will introduce some basic concepts, pros and cons of specific solutions and potential pitfalls to avoid, everything in order to increase your overall TIQ and make your models more robust, scalable and flexible in terms of time analysis
As you may recall from the first part of this series, I emphasized the Date dimension as the most important of all dimensions in the data model. Let me briefly explain my view on this: you can do your business without knowing if a specific group of customers buying your product; you will somehow sneak without knowing if you sold 100 units of product X or 200 units of product Y; but, without knowing general trends over time, you’re definitely lost in your data analysis.
Not that I want to diminish the importance of all dimensions. I would just call Date dimension as “Primus Inter Pares”, or “First Among Equals”. In that sense, I am often calling Date dimension as “Majesty”…

Back to basics – make your model shine like a Star!
Before paying well-deserved attention to the Date dimension, we need to clarify why it is called dimension at all and what that means from a broader perspective.
When it comes to data modeling, there are few concepts that are generally accepted. One of them is dimensional modeling, which is especially important in data modeling for various reporting systems (such as Power BI). Simply said, this concept assumes that you have one or more fact tables and at least one, but usually many dimensions.
Fact tables store data about events that occurred – be it sale transaction, exchange rate, temperature value… In most cases, the fact is a numeric value that can be aggregated in some manner (sum, average, quantity, etc.)
| Sales Amount | Unit Cost | Discount | Gross Profit | Margin |
| 125.000,33 | 11,99 | 0,99 | 25.346,88 | 5,40 |
However, those numbers don’t have valuable meaning unless we put them into some specific context. Let’s say, we want to know the Sales Amount for black colored products. Or, we would like to see Gross Profit broken down per every single month. Or, we wish to analyze how many units we sold in the USA, compared to Europe.
Here come dimensions into play. In the simplest way, dimensions are a descriptive representation of business entities. Sounds overwhelming? Few basic examples will clear the picture in a minute.
Imagine that you have a business entity called Customer. What kind of attributes would you use to describe a customer? First name, last name, a place where she/he lives? Gender, education level? You’re right, all of these can be used to describe a customer. What about the product? Category, type, color…are just a few of the attributes you can use.
Date dimension is the most consistent dimension in data model – while other dimensions can be differently set, based on specific reporting needs, or can be expanded/reduced in a later phase by adding/removing attributes, Date dimension is more or less consistent over every single data model!
In theory, you can add an indefinite number of attributes to a product, while for the date you are limited with a certain amount of attributes (even if you include some specific things, like working day, public holidays, etc.). And those attributes are in perfect hierarchical order: date June 27th, 2020 will always belong to the year 2020, quarter two, and month of June, and it will always be Saturday. You can change Product X to belong to the Luxury category instead of Regular, but for dates, you can’t apply that same logic.
After whole this elaboration on dimensions, our model should look something like this in the end:
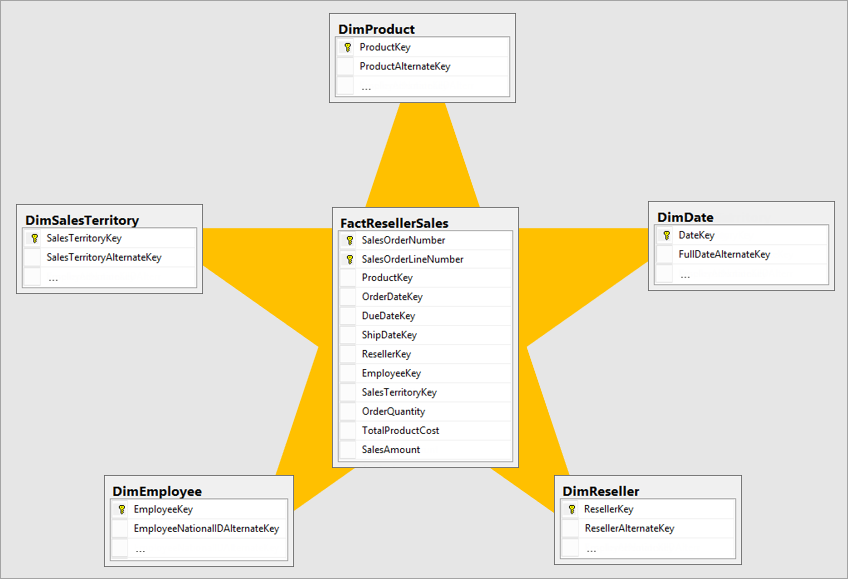
When you take a look at this illustration, it’s more than obvious why it is called Star schema. We have a fact table in the middle of our model, and different dimensions surrounding it, so it reminds of a star. There are single relationships between each of the dimensions and a fact table.
Without going into further details about other data modeling techniques, such as Snowflake or Flat (de-normalized) table, because it would require separate series of articles, I will only say that Star schema is the recommended concept when creating data model in Power BI.
What makes Date dimension so unique?
In order to take full advantage of using powerful time intelligence DAX functions in Power BI, your data model must satisfy some conditions. The main one is: you need to have at least one date table in your model!
Additionally, a table needs to satisfy the following criteria in order to be considered as a date table:
- The table must contain a column of data type DATE or DATE/TIME (we will refer to this column as Date column)
- Date column must have unique values
- Date column must be continuous (it’s not allowed to have missing dates)
- No BLANK values are allowed in the Date column
- Finally, the Date table must be marked as a date table
At first glance, this might look like too much overhead in preparing separate date table, especially if you recall that Power BI can create automatically date tables for you, without any effort from your side.
However, as in any other development area, slightly more effort, in the beginning, will let you bear the fruits later. Doing things the proper way from the start is the way to go. Creating a separate Date dimension, and marking this table as a date table, will enable you to use Power BI at its full capacity and giving you the maximum flexibility in using powerful DAX Time intelligence functions (more about that in one of the next articles in this series).
In the next part of TIQ series, I will cover all existing techniques for creating fully functional Date dimension in your Power BI model, so stay tuned!
Last Updated on June 27, 2020 by Nikola