

TIQ stands for Time Intelligence Quotient. As “regular” intelligence is usually being measured as IQ, and Time Intelligence is one of the most important topics in data modeling, I decided to start a blog series which will introduce some basic concepts, pros and cons of specific solutions and potential pitfalls to avoid, everything in order to increase your overall TIQ and make your models more robust, scalable and flexible in terms of time analysis

If you ever performed any kind of data analysis, you should definitely know that analyzing numbers within different time periods, identifying trends over time, or evaluating various KPIs depending on the point in time when the specific events happened, is “bread and crumb” of every single BI project.
You can sneak without knowing details about customers, geography, products (sure it’s highly recommendable to use also these dimensions), but without knowing what is happening in general over time, your overall analysis will suffer.
Therefore, I sincerely consider Date dimension as “Majesty” – in my opinion, that is the most important dimension in the whole data model!
When I recently wrote about creating custom Date dimension, I promised that I will dedicate a separate article and explain Time intelligence in more depth.
So, this is the first post in the series on Time Intelligence topic.
Because of its importance, I will try to offer comprehensive overview of Date dimension, obvious benefits it offers and potential pitfalls when (not) being used properly in Power BI.
Power BI – Can I sneak through without Date dimension?
The answer is simple – sure, you can! But, you shouldn’t. If you are not using the Date dimension in your data model, Power BI will not let you down. On the contrary, it will “assist” you, by automatically creating date hierarchies on every single date column you have in your model!
Wow, that sounds awesome at first! Why should I waste my time building a separate Date dimension, when Power BI can do this for me? Stay tuned and you will soon find out why that’s not the outcome you are aiming for.
When you open a new Power BI file, under the File tab, choose Options and Settings and then Options. On the left, under Global, you will see the Time intelligence option.
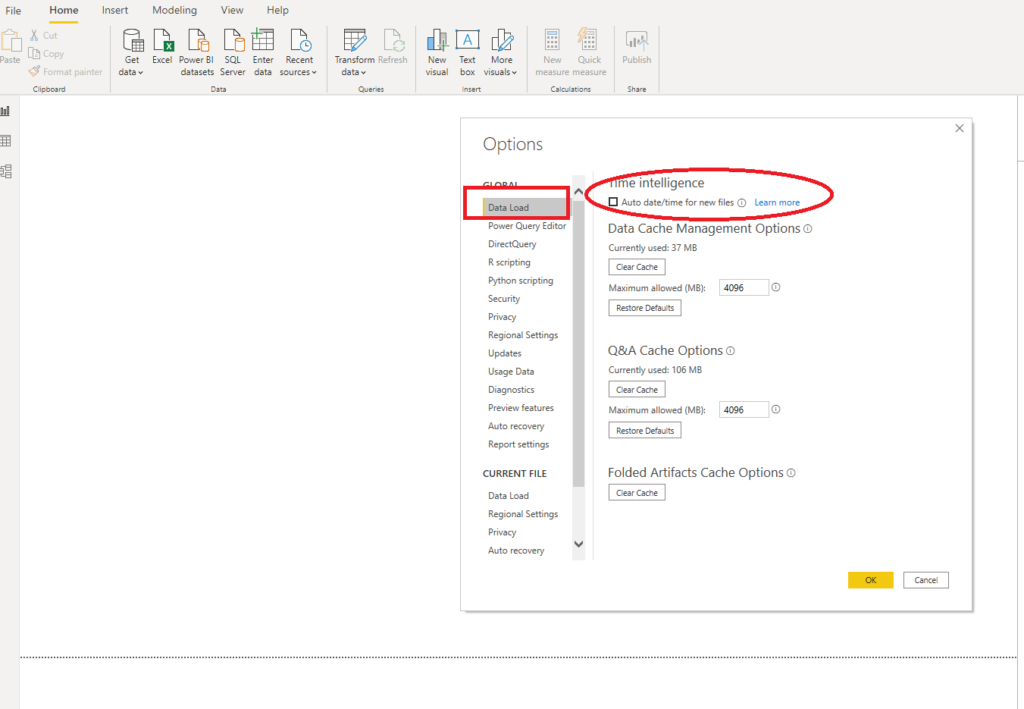
If you check the option for Auto date/time for new files, every time you open a new Power BI file, Power BI will handle dates on its own.
Other place that you can set this up is under Current File on the left, then Data Load.
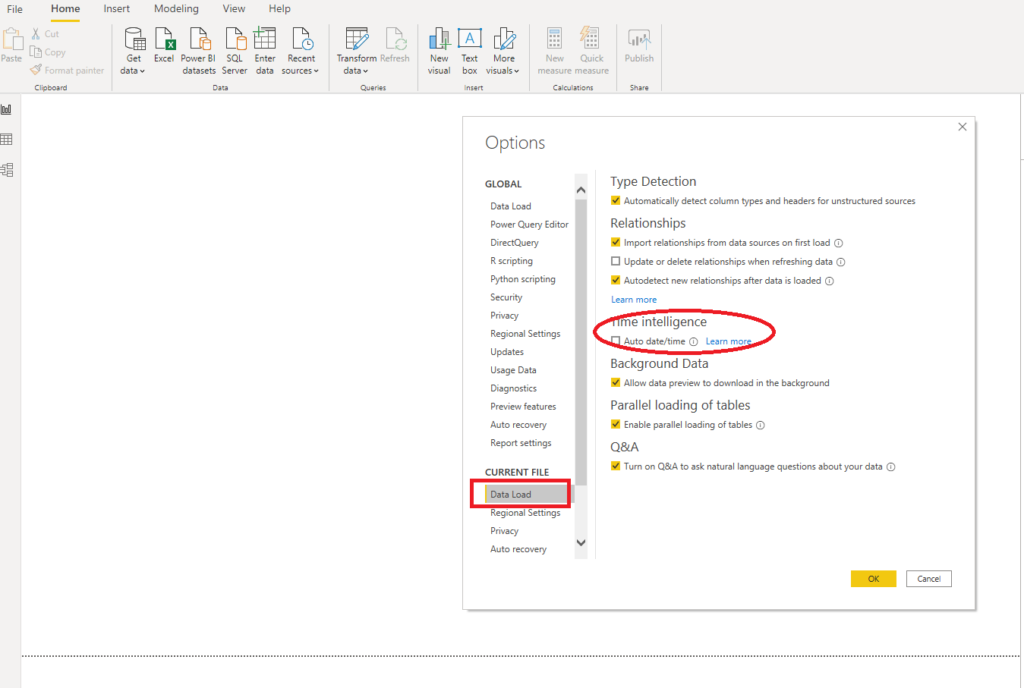
Let me briefly explain what is happening in the background when you check this option: Power BI will create a date hierarchy consisting of Year, Quarter, Month, and Date so that you can slice and dice data on these four levels of granularity.
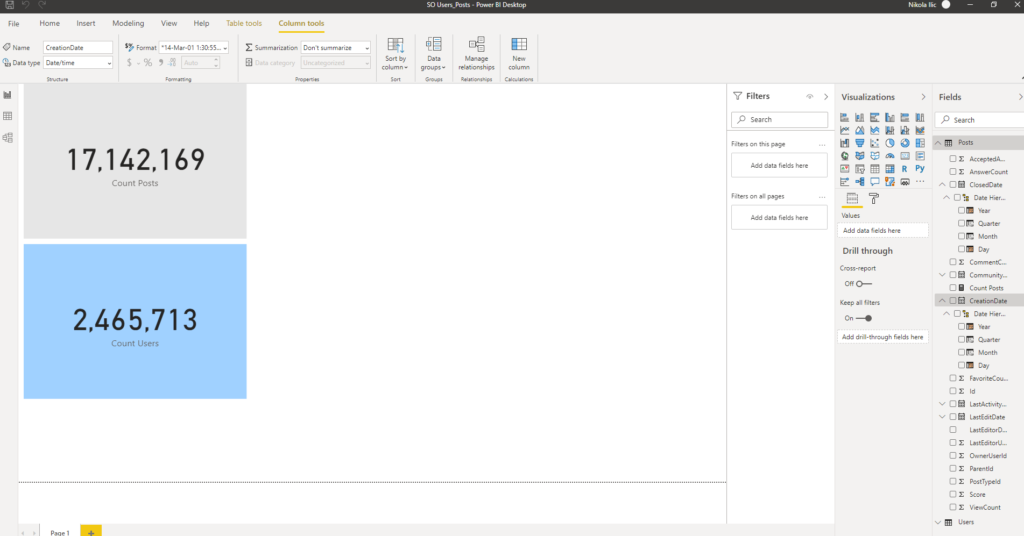
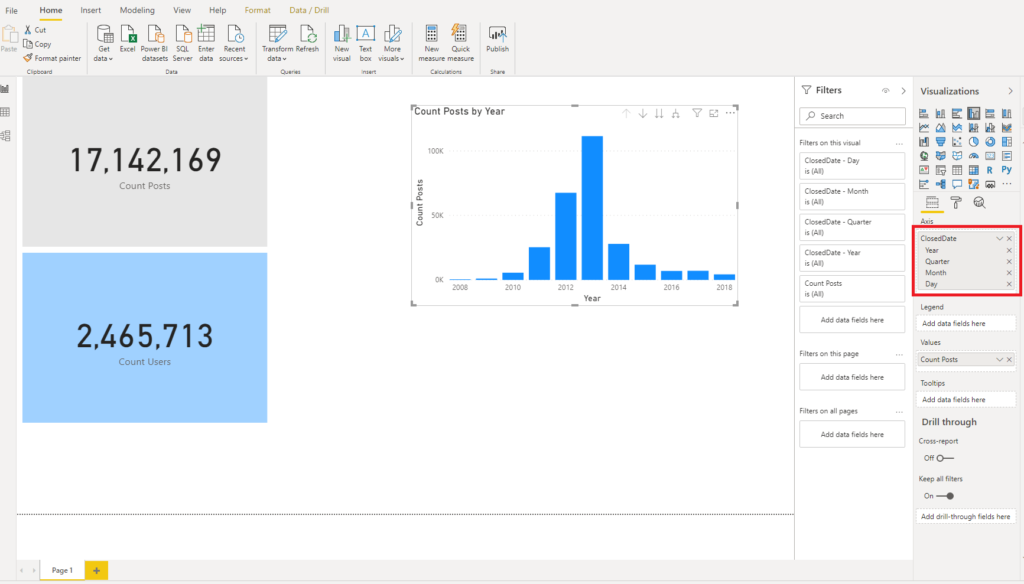
I am using the Stack Overflow database for demo purposes since it is large enough to notice the behavior of our data model when auto date-time is enabled. The report itself is quite simple, containing two Cards which display a number of rows in two tables of our model:
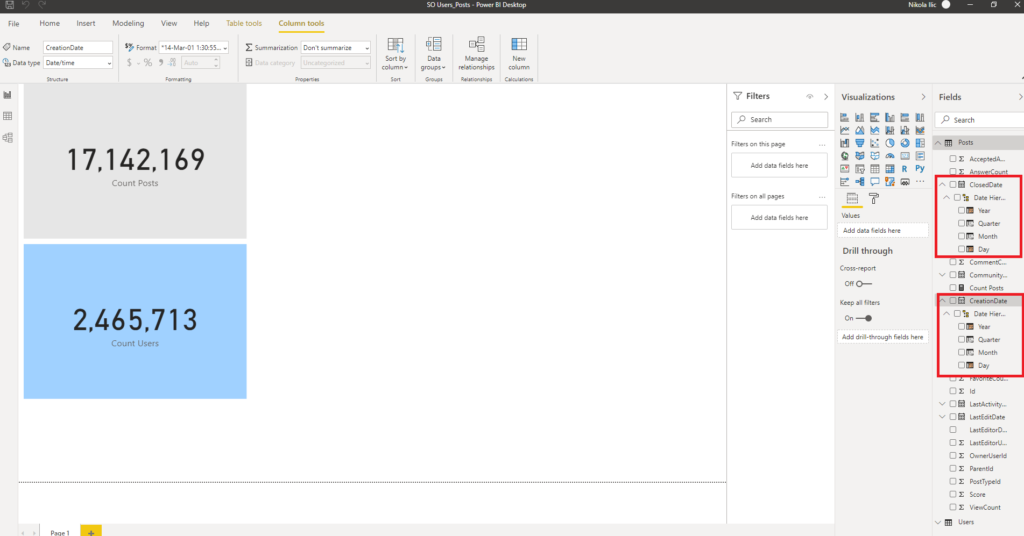
Now, when you look in the Fields pane, you will notice that every column of date type is displayed as a hierarchy. Therefore, I can use one of these hierarchies to slice and dice data:
“What’s wrong with that ?”, you will ask a legitimate question. I’m getting solution out-of-the-box, without need to code something, import something, extending data model, etc.
Behind the Power BI scenes
Before I continue, let’s first see what is going on in the background when I try to use our “Date” dimension for calculating a simple measure of Total Year-to-Date number of Posts in Stack Overflow database:
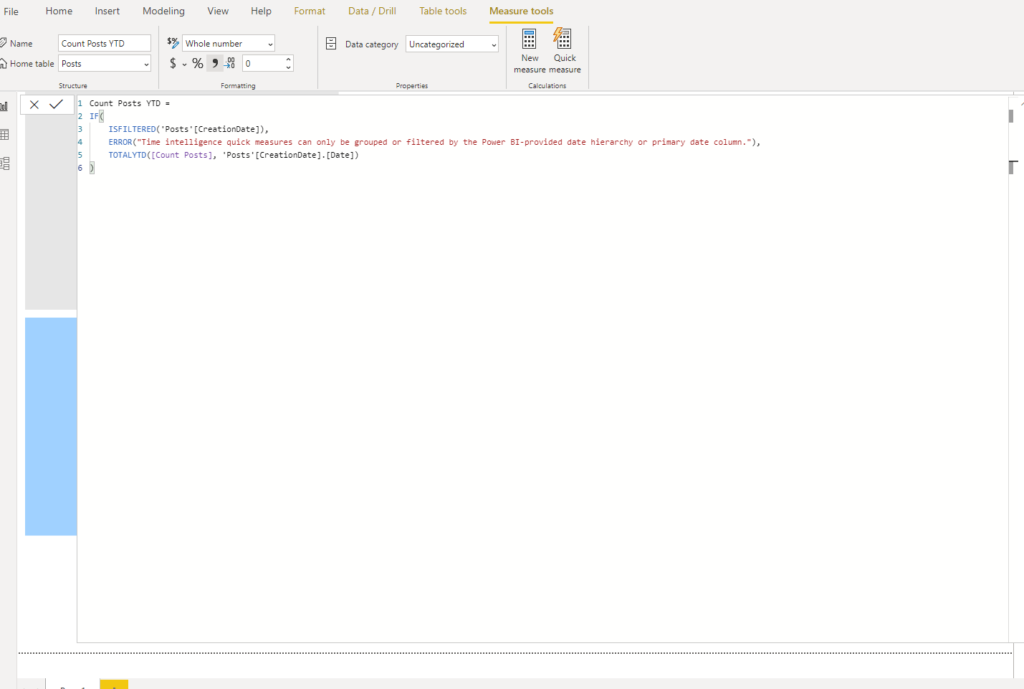
If you take a look at the DAX code which was automatically created, you will notice unusual column reference for our CreationDate date column:
Count Posts YTD =
IF(
	ISFILTERED('Posts'[CreationDate]),
	ERROR("Time intelligence quick measures can only be grouped or filtered by the Power BI-provided date hierarchy or primary date column."),
	TOTALYTD([Count Posts], 'Posts'[CreationDate].[Date])
)
This means that Power BI points to a specific member of automatically created hierarchy (in our case .[Date], but it could also be .[Year], .[Quarter] or .[Month]).
Still, calculation is here and everything looks fine. However, what if I want to enable my users to slice data per different dates ? Or, if the users request to analyze data per week? Fiscal year? Day of week?
Flexibility equals Zero !
Nothing from these would be possible using our auto date dimension! So, forget about flexibility, you get Year, Quarter, Month and Date and that’s it. Don’t get me wrong, this is quite fine for let’s say 80% of analysis, but what should we do with the rest?
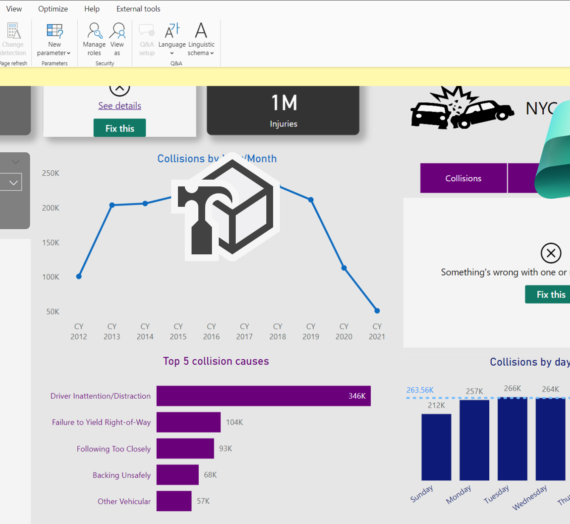
For example, what if I wanted to compare data based on CreationDate and LastActivityDate over time and I wish to have a slicer to perform my analysis more conveniently.
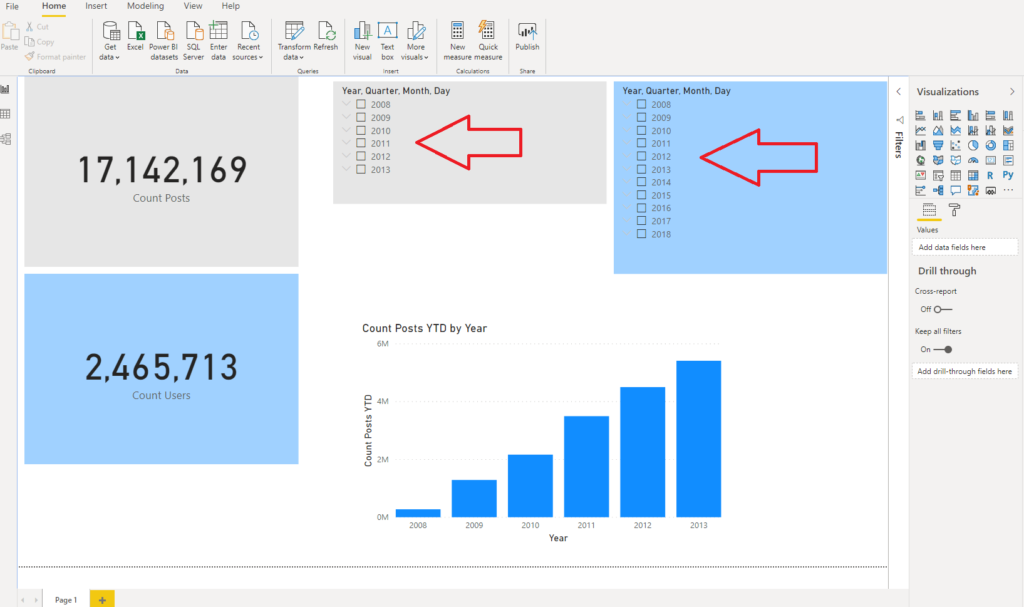
As you notice, it’s not possible to satisfy this request with only one slicer. We would need two slicers, separate one for each date hierarchy. Now, imagine that we want to slice data based on four or five different dates. And not to say how ugly, counter-intuitive and complex becomes your report if you apply this strategy.
We can’t extend our date dimension with new attributes and that is the biggest limitation of this approach.
Hide and seek with automatic date tables
To get a feeling what is going on under the hood, I will demonstrate what Power BI needs to do in order to handle this. For every single date column (in our case in Posts table, we have 5 of them: ClosedDate, CommunityOwnedDate, CreationDate, LastActivityDate and LastEditDate), Power BI created a SEPARATE date table!
You don’t believe? Just follow me…
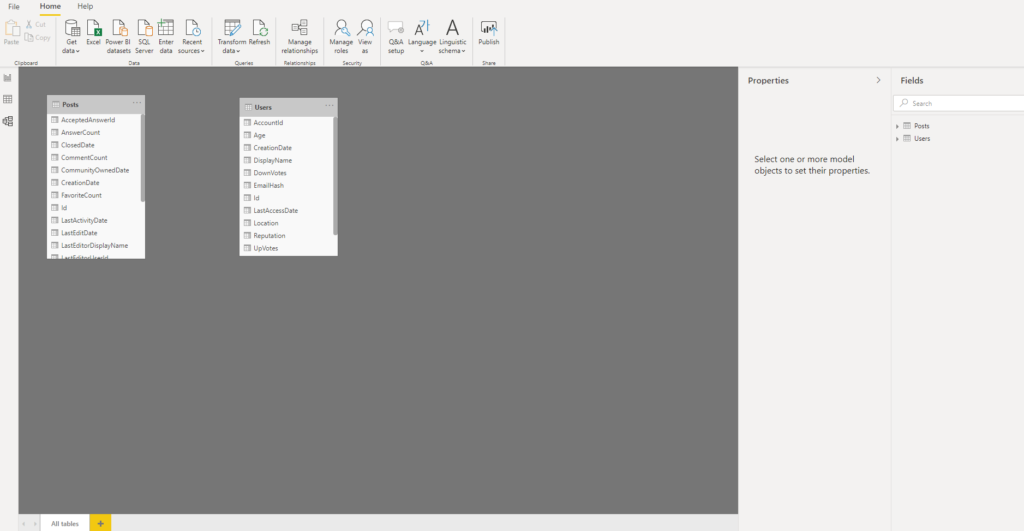
When you go to Model view, no tables are there. So where are they (if they exist at all)?
The trick is that these tables are hidden by default and can’t be seen within Power BI model, as described in this Microsoft article.
Therefore, let’s launch DAX Studio to support us in our search for these local date tables. For those of you who are not yet familiar with DAX Studio, I strongly recommend trying it – it has a whole bunch of handy features, and the most important thing, it’s free!
I’ve connected to my PBIX file and look:
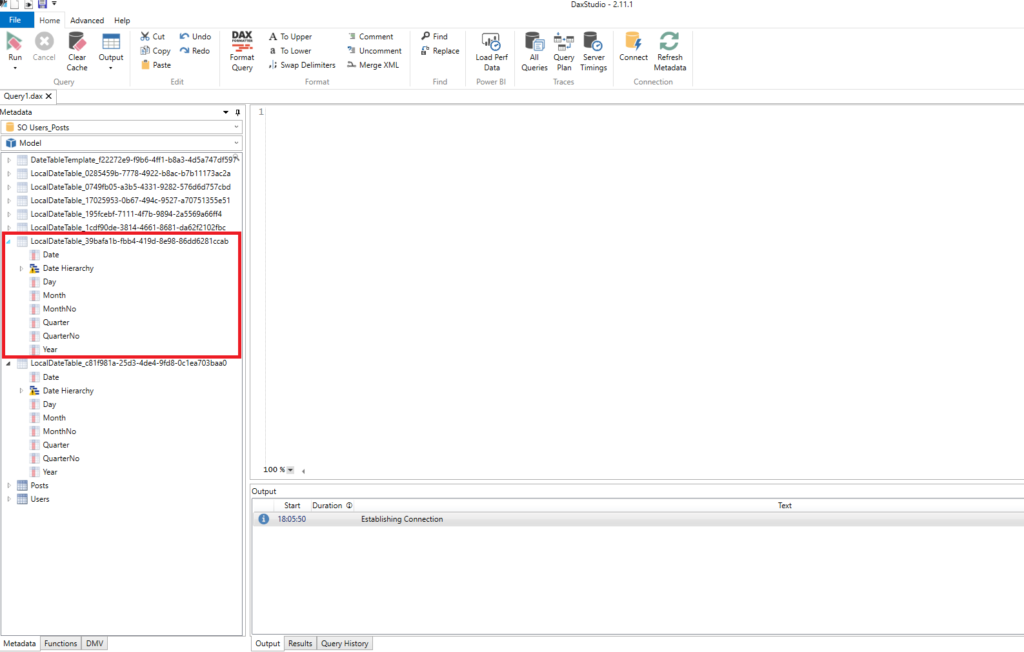
On the left side, under Model, you will see a whole bunch of Date tables!!! Who created them? I didn’t, as you saw earlier. These are all automatically created date tables, which Power BI created behind the scenes to enable time intelligence calculations.
Data model size grows…
No need to say that those tables are part of your data model, even if you didn’t create them intentionally. The bigger the table with date columns, the bigger the whole model becomes.
I saw multiple examples when the data model simply bloated because of many auto date tables.
So, after reading all these negative stuff on Auto Date/Time feature, one could understandably ask a question:
Why on Earth this Auto Date/time even exists in Power BI, let alone that it is enabled by default ?!

Well, there is no official explanation from Microsoft, but I assume that the rationale behind this decision is that Power BI is being promoted as a self-service BI tool.
Let’s not forget that there are a lot of people out there who are not familiar with dimensional modeling concepts at all, let alone creating proper date dimensions by writing DAX or M code or using existing SQL date dimensions from Data Warehouse. And they need Power BI, they use Power BI.
For whatever reason Auto Date/Time is part of Power BI, just simply don’t use it.
In the next part of the TIQ series, I will write about possible solutions on how to handle the Date dimension in a proper way. So, stay tuned!
Last Updated on June 25, 2020 by Nikola


hubert
About date … Could you please display publish date? It’s crucial for tech blogs!
Nikola
Sure, thanks for the suggestion.
Carmine
i’m curious then… how is productive to store/display date in Powerbi? Can you give a hint on that?
Nikola
Hi Carmine,
If you don’t need the time part, then store it as a Date only, since there will be less distinct values and therefore data compression will be better and your data model size will be lower.
In any case, don’t forget to change the data type in Power Query Editor, BEFORE you load data into your report. Once you load it to a report, you can just change the formatting to exclude time part, but underlying data model will still keep the time part.
Hope that this helps.