This article is the part of the series related to mastering DP-500 certification exam: Designing and Implementing Enterprise-Scale Analytics Solutions Using Microsoft Azure and Microsoft Power BI
Table of contents
In one of the older articles, I’ve already explained three different analytic pools in Azure Synapse Analytics. While Spark analytic pool was our focus in the previous blog post of this series, this time we will concentrate on understanding the remaining two – Dedicated and Serverless SQL pools. Even though both these pools are “T-SQL flavored”, they are completely different in all the other aspects – beginning from the underlying architecture, all the way to a whole different pricing model.
Dedicated vs Serverless SQL pool
Let’s quickly list all the key differences between the Dedicated and Serverless SQL pool in Synapse Analytics:
- Infrastructure – unlike a Serverless pool, which is provided by default as soon as you create a Synapse workspace, a Dedicated pool needs to be explicitly provisioned (same as the Spark pool in the previous article). This means, that in the Dedicated SQL pool, YOU (and your team) are responsible for setting up clusters and care about capacity planning. On the other hand, with Serverless, your task is to handle only logical aspects of your workload
- Scaling – with a Dedicated pool, you’re in charge when it comes to increasing/decreasing the number of DWUs (DataWarehouseUnits) to support your data workloads. In Serverless, you don’t have an option to configure processing power, as the engine automatically scales to execute your queries
- Pricing – when using Dedicated pools, you’re paying not just for processing power, but also for storage (as the data is persisted in the data warehouse). On the flip side, Serverless is based on the Pay-as-you-go model – which means, you’re paying only for the amount of data processed
- Use-cases – Dedicated SQL pool is the official successor of the former SQL DW, and as such, is suitable for traditional relational data workloads. You can read more about the Dedicated SQL pool and the way it integrates with Power BI in this article. Serverless SQL is aimed at ad-hoc queries over data stored in the data lake, as it enables quick data retrieval without the need to move the data from the lake. I’ve also written a detailed article about the Serverless pool and how it works in synergy with Power BI, including a comprehensive cost-analysis in multiple different scenarios
Exploring and visualizing data in Synapse SQL pools
In this article, you may find a step-by-step tutorial on how to query the 1.5 billion rows YellowTaxi dataset using a Serverless SQL pool and visualizing the data using Power BI, while this article demonstrates how to visualize the data stored in the Dedicated SQL pool.
Let’s now see how to visualize the data directly in the Synapse studio! I’ll use a Serverless SQL pool to query the data stored in my data lake:
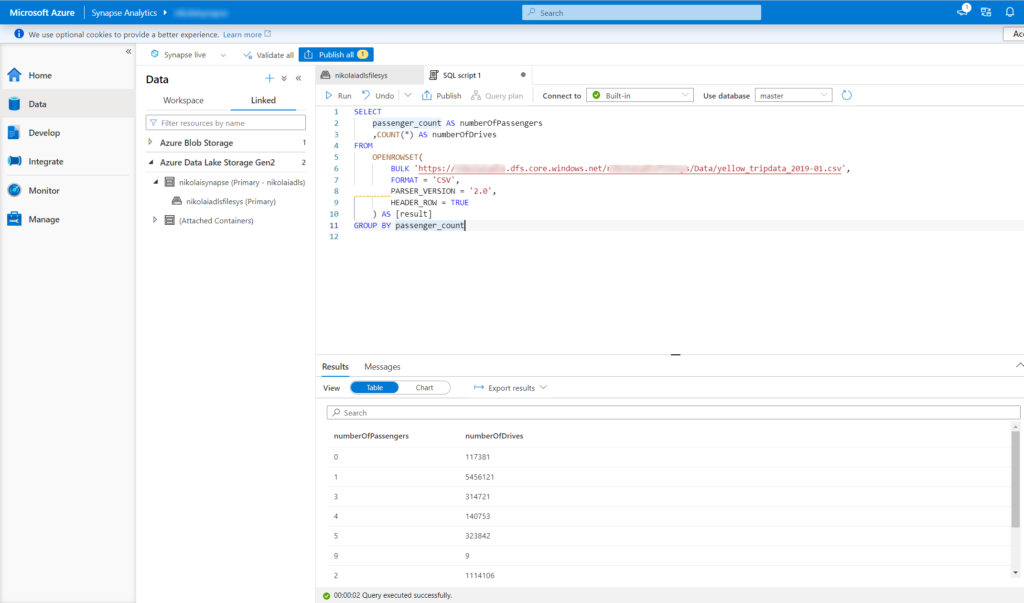
My data is stored within the CSV file in the Azure Data Lake, but I could have used a familiar T-SQL syntax to directly query the data from that file! The query is very basic, it counts how many drives were in the month of January 2019, grouped by the number of passengers in the cab:
SELECT
    passenger_count AS numberOfPassengers
    ,COUNT(*) AS numberOfDrives
FROM
    OPENROWSET(
        BULK 'https://<your storage account>.dfs.core.windows.net/<your file system>/Data/yellow_tripdata_2019-01.csv',
        FORMAT = 'CSV',
        PARSER_VERSION = '2.0',
        HEADER_ROW = TRUE
    ) AS [result]
GROUP BY passenger_count
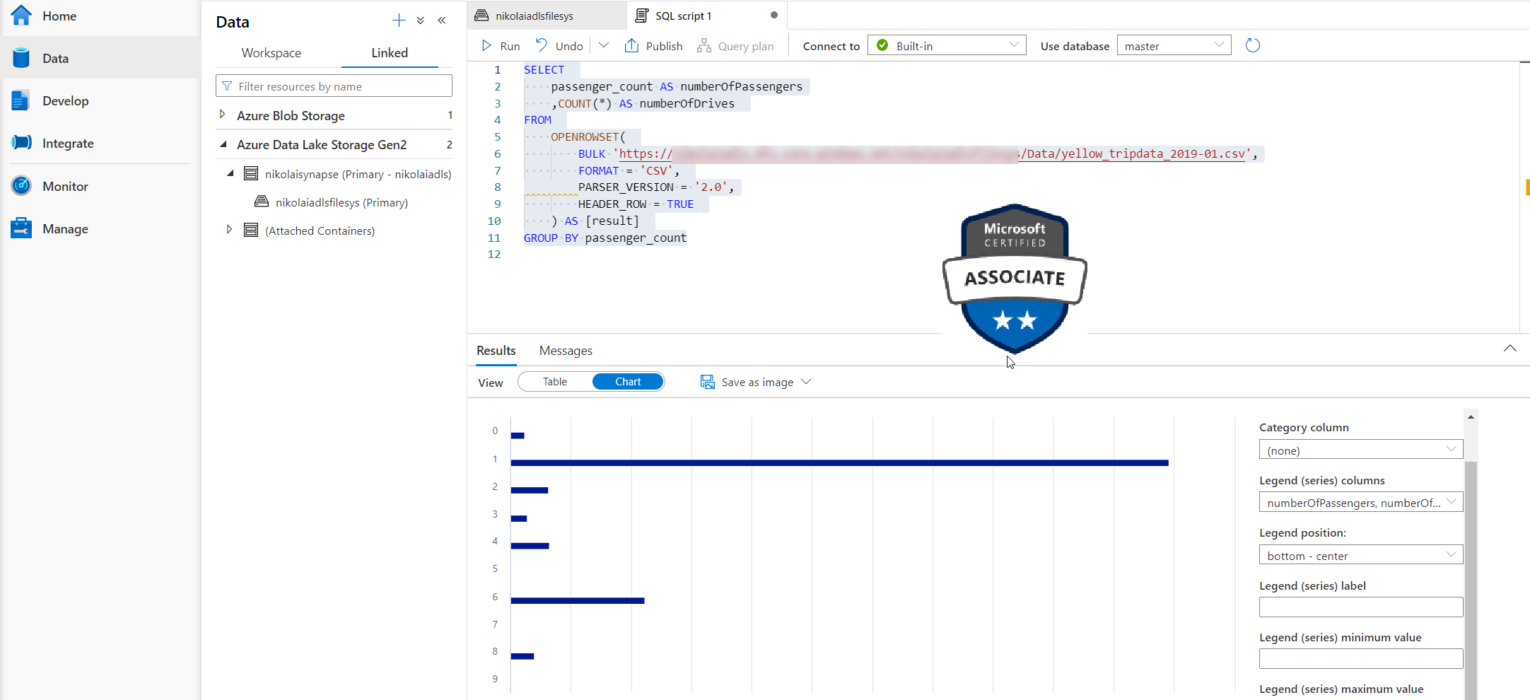
Similar to Spark notebooks, once I click on Chart, my results will be displayed using chosen visualization type (Bar, Column, Line, Pie, Scatter, etc.), instead of the grid:
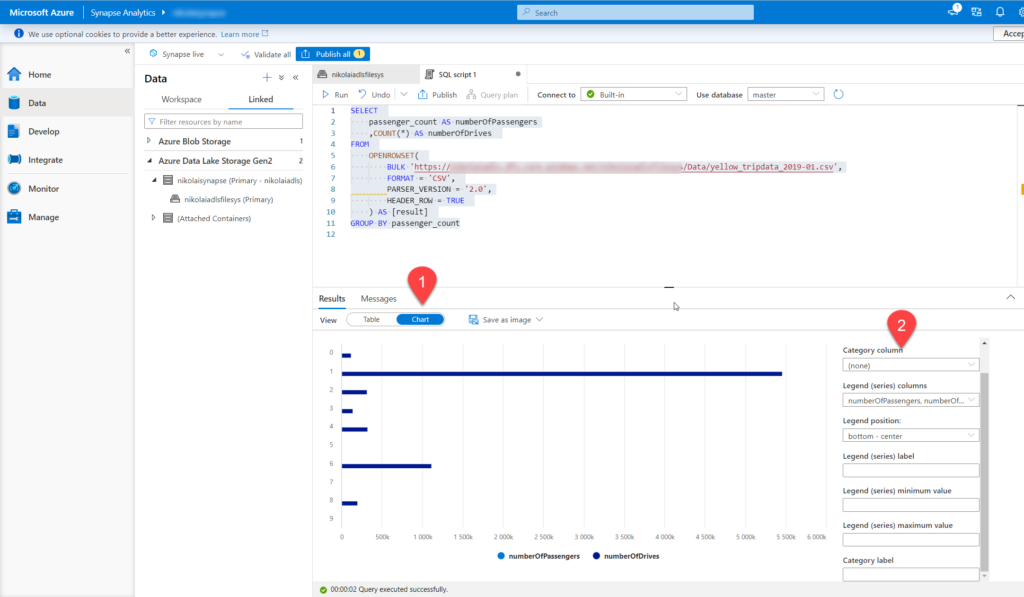
You can also additionally configure the chart, according to your specific needs.
Conclusion
In the previous article, when we explored and visualized the data using the Spark pool in Synapse, we concluded that Spark is much more than a data visualization tool. The same applies to SQL pools – however, it’s still nice to have a built-in option to quickly visualize the numbers and understand data distribution without the need to connect to an external tool, such as Power BI.
Thanks for reading!
Last Updated on January 20, 2023 by Nikola