
This article is the part of the series related to mastering DP-500/DP-600 certification exam: Designing and Implementing Enterprise-Scale Analytics Solutions Using Microsoft Azure and Microsoft Power BI and Implementing Analytics Solutions Using Microsoft Fabric
Table of contents
In the previous articles, we’ve already examined why having a proper data model is of key importance when working with enterprise-grade data. With that in mind, a concept of denormalization may bring significant benefits in certain scenarios.
But, before we explain denormalization, let’s first focus on understanding the normalization, as a base concept in the relational data workloads.
Normalization is the process of organizing data in a database. The normalization process implies creating a specific data model. As we learned that our data model consists of tables and relationships, normalization enables you to avoid data redundancy within the tables, while at the same time setting consistent tables’ dependencies through relationships.
Normalization is the key characteristic of Online Transaction Processing Systems, or OLTP abbreviated. Online Transaction Processing systems are suitable for processing a high volume of transactions. When I say high volume, I mean millions of transactions per day.
As the emphasis in the OLTP system is on fast processing, tables are normalized (predominantly) to a 3rd normal form to support quick and efficient Insert, Update and Delete statements. Online Transaction Processing systems are convenient for running simple ad-hoc queries.
On the flip side, denormalization represents the opposite concept. In Online Analytical Processing Systems, or OLAP abbreviated, the emphasis is on the speed of data reading. OLAP systems are designed to enable business users to understand the big picture of the data stored in the database. That means the focus shifts from a single transaction to aggregated data. Using the OLAP system, you can extract information from a large database and perform analysis to support decision-making.
The main purpose of the OLAP system is to generate insights from transactional data – those insights enable understanding of sales trends, customer retention and satisfaction, or finding potential bottlenecks and improving business processes.
By implementing denormalization, you are basically avoiding expensive joins between the tables and creating redundant data in the table!
Well, isn’t that bad, Nikola? As usual, it depends.
While you should still strive to create a proper Star schema for your Power BI data model whenever possible, there are certain situations when creating redundant data may increase the model efficiency and improve the overall performance of your Power BI solution.
Let’s examine the following scenario:
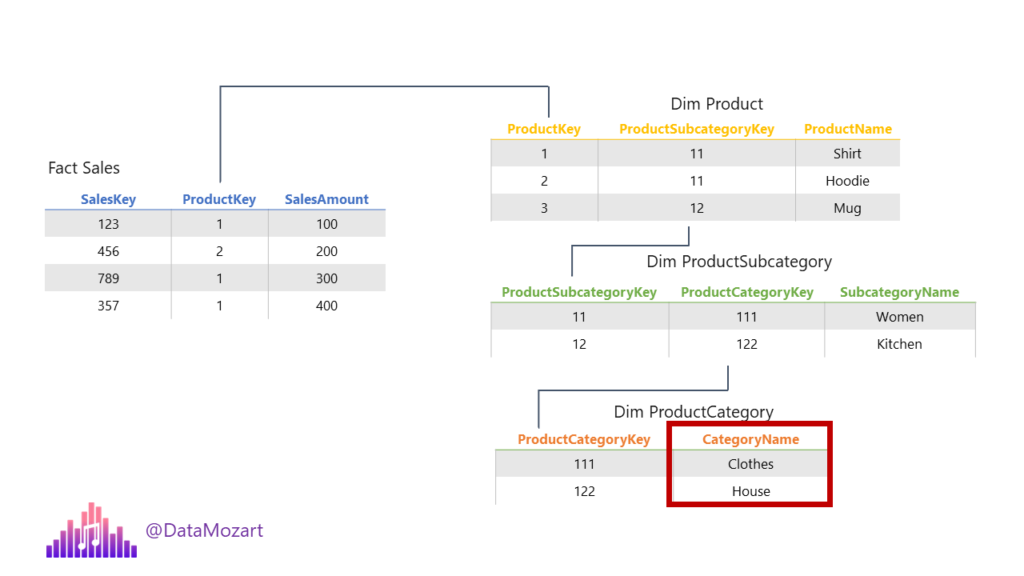
We have three normalized tables, containing different attributes related to Products. So, in this scenario, if we want to analyze the sales per product category, in the background, three joins will be performed: first, between the Sales and DimProduct table, then between the DimProduct and DimProductSubcategory, and finally between the DimProductSubcategory and DimProductCategory.
This is the so-called snowflake dimension, where multiple normalized tables are used to describe a single business entity. Now, imagine that most of the analytic queries target the Category of the product. Instead of performing three joins each and every time the query is run, we can denormalize the data model and put all the attributes within one table: DimProduct!
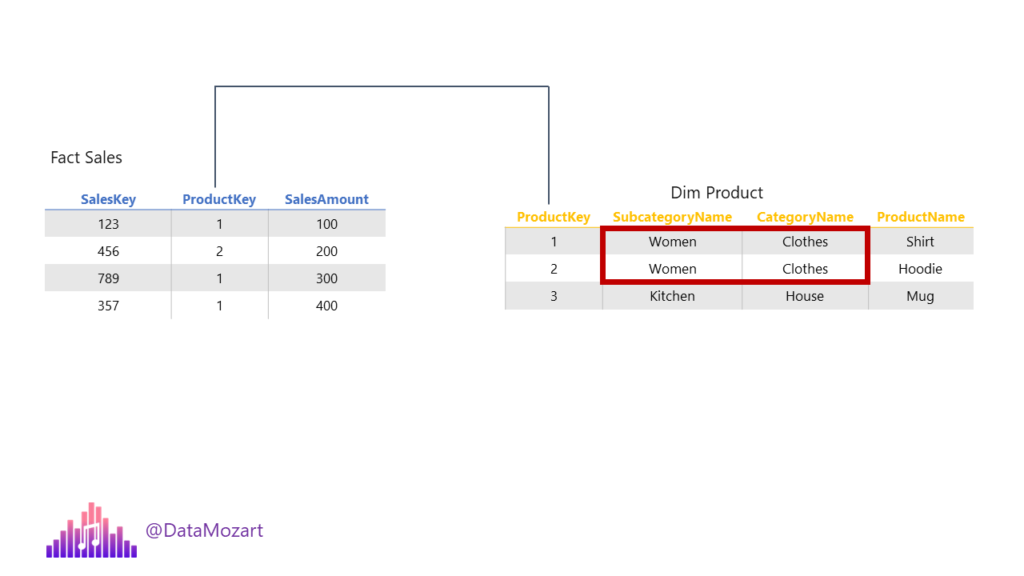
As you see, we would have redundant data for the Product Subcategory and Product Category.
Benefits of denormalization
- Instead of loading multiple tables in your data model, you’ll have only one, which could be more efficient in terms of storage and performance, as there will be no more relationships between these tables, and thus potentially the smaller memory footprint of the model would be
- Filter propagation between the tables sometimes may be less efficient than filters applied to a single table
- It’s not possible to establish a hierarchy between the fields from multiple tables, so if you need to create a hierarchy of, let’s say, Product Category, Subcategory, and Product itself, you MUST have all these columns available within a single table
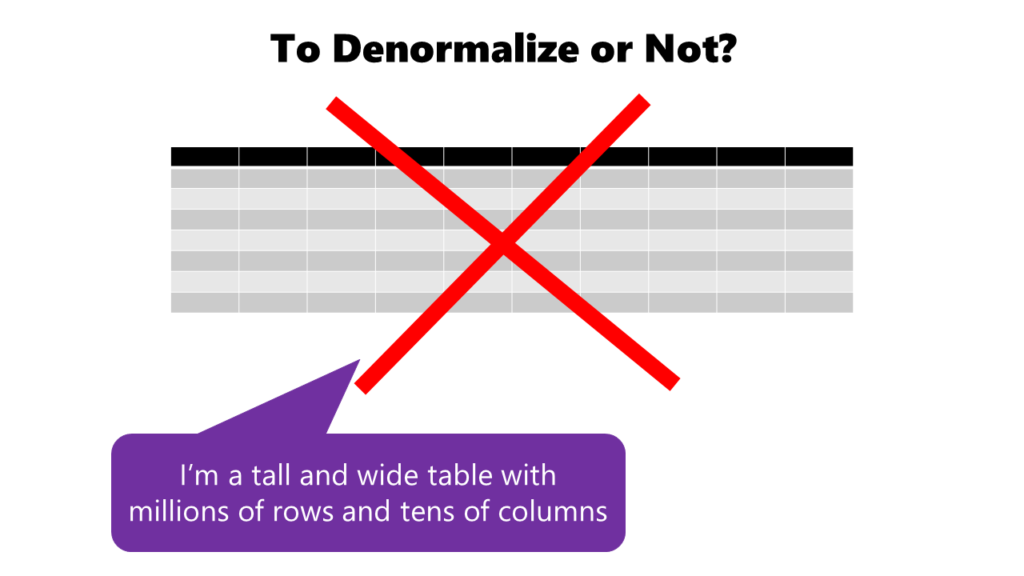
However, don’t jump to a quick conclusion that denormalization should be your preferred way of data modeling in Power BI. Creating giant, flat tables containing tens of columns and millions of rows is usually the shortcut to self-destruction. VertiPaq database, which we’ve already discussed in the previous articles, doesn’t like tables that are both tall and wide!
Keep in mind that denormalization makes sense in scenarios where you have snowflaked dimensions with not much data in them, or when you need to have data organized in hierarchies.
Denormalizing data with Power Query
There are multiple ways to implement denormalization. For example, you can create a view in the SQL database that will include denormalized data from multiple tables. However, in this case, I’ll show you how to leverage Power Query Editor to create a denormalized table.
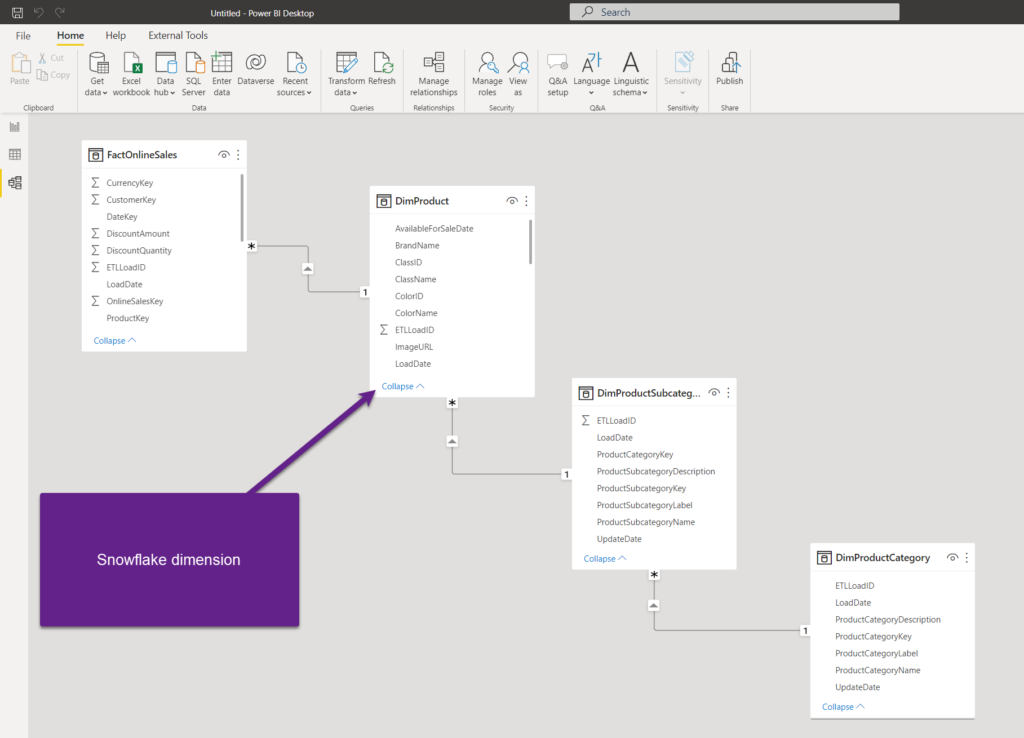
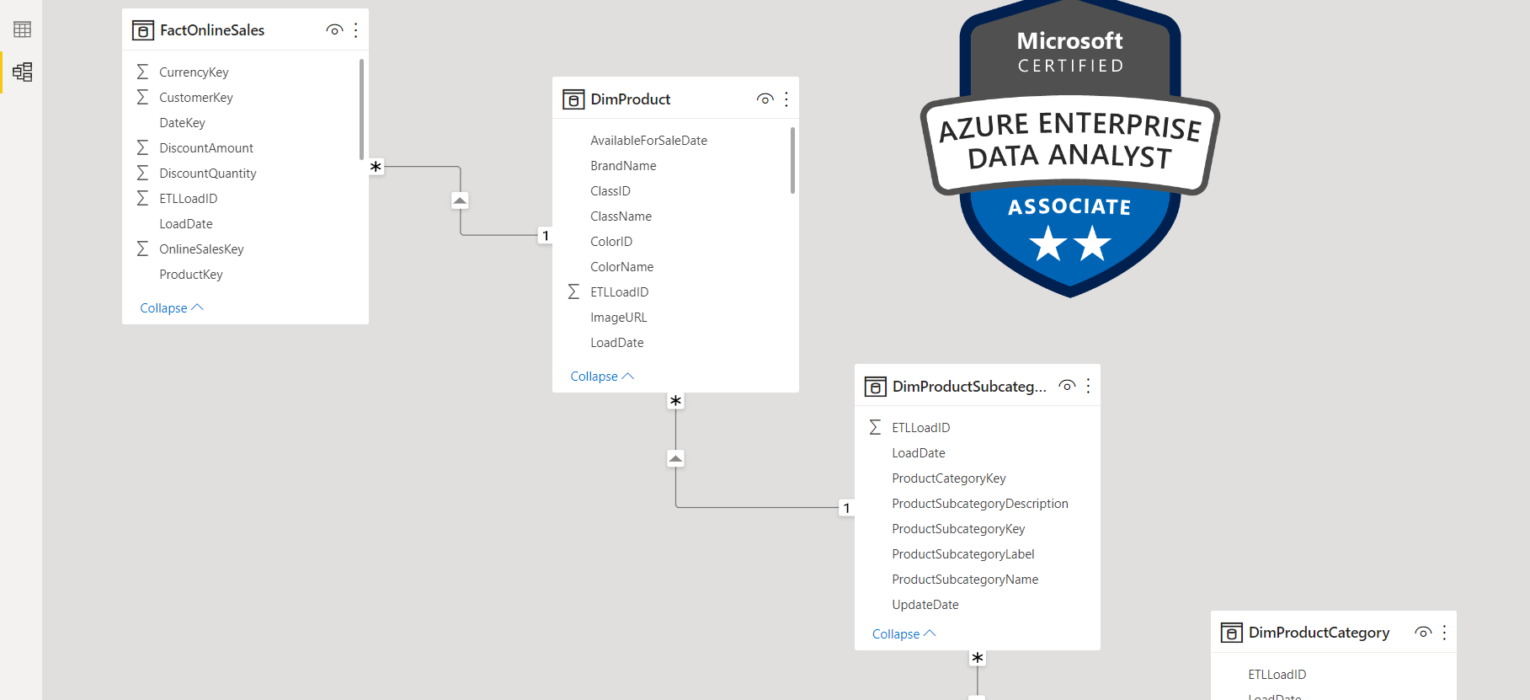
My data model is fairly simple, containing one fact table (FactOnlineSales) and three dimension tables. The idea is to denormalize the data from the snowflake DimProduct dimension and bring the attributes from DimProductSubcategory and DimProductCategory to the DimProduct table.
Since DimProduct and DimProductSubcategory tables are connected with a relationship, we can pull the columns from the DimProductSubcategory table directly. Let’s add ProductCategoryKey and ProductSubcategoryName.
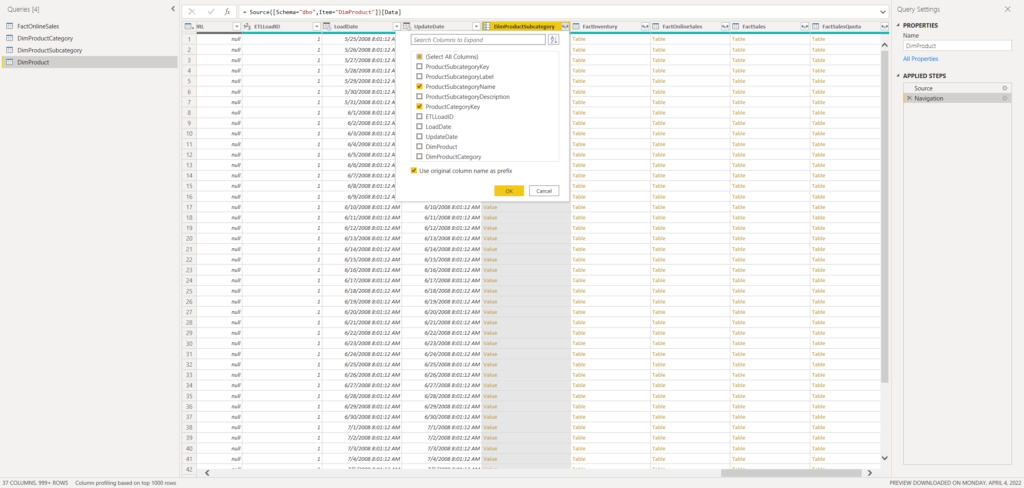
Now, these two columns are part of the DimProduct table.
The next step is to grab the ProductCategory name. As this table is not directly related to DimProduct, we need to apply some additional logic. I’ll merge queries, choosing the DimProduct table and DimProductCategory table.
The common column between these two tables is ProductCategoryKey, so we’ll perform left outer join on this column.
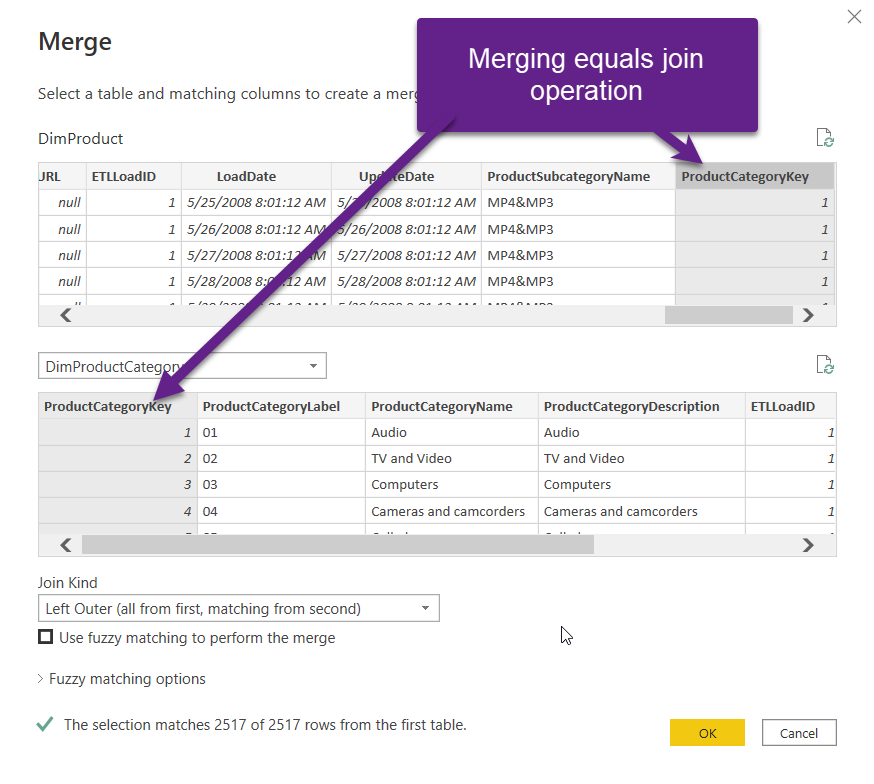
Once I confirm this, I’ll be able to pull the ProductCategoryName, as I did previously for the Subcategory name.
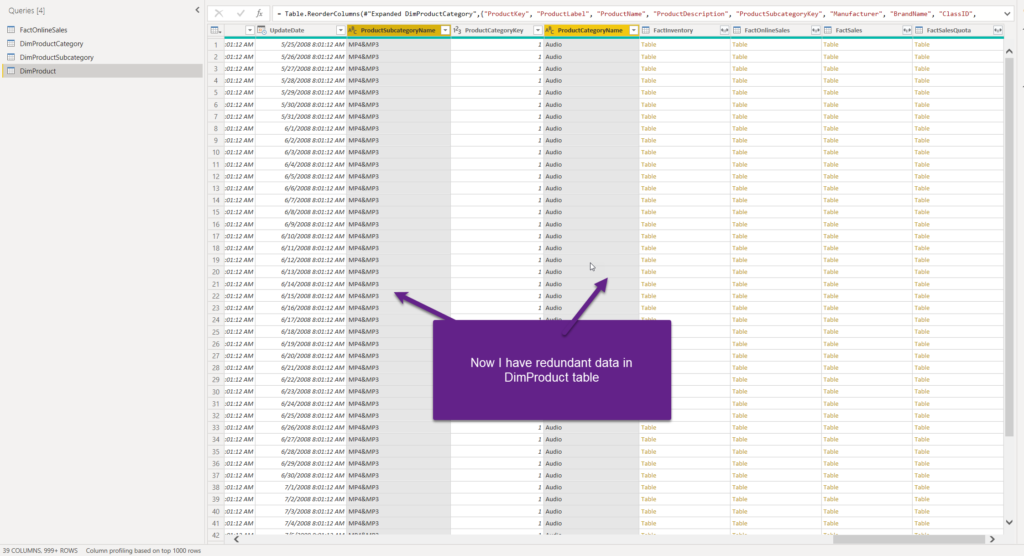
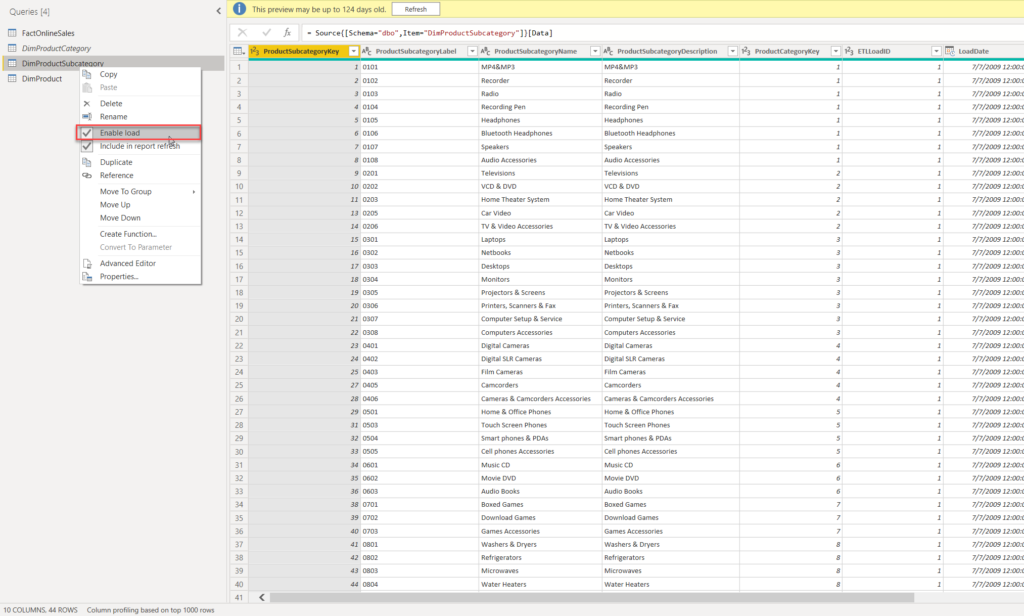
Now, I have redundant data in the DimProduct table, but I’m able to establish the hierarchy between the Product Category, Subcategory, and Product. Because we have all the necessary data in the DimProduct table, we don’t need DimProductCategory and DimProductSubcategory tables in our data model anymore. Therefore, I’ll right-click on both of these tables and disable load:
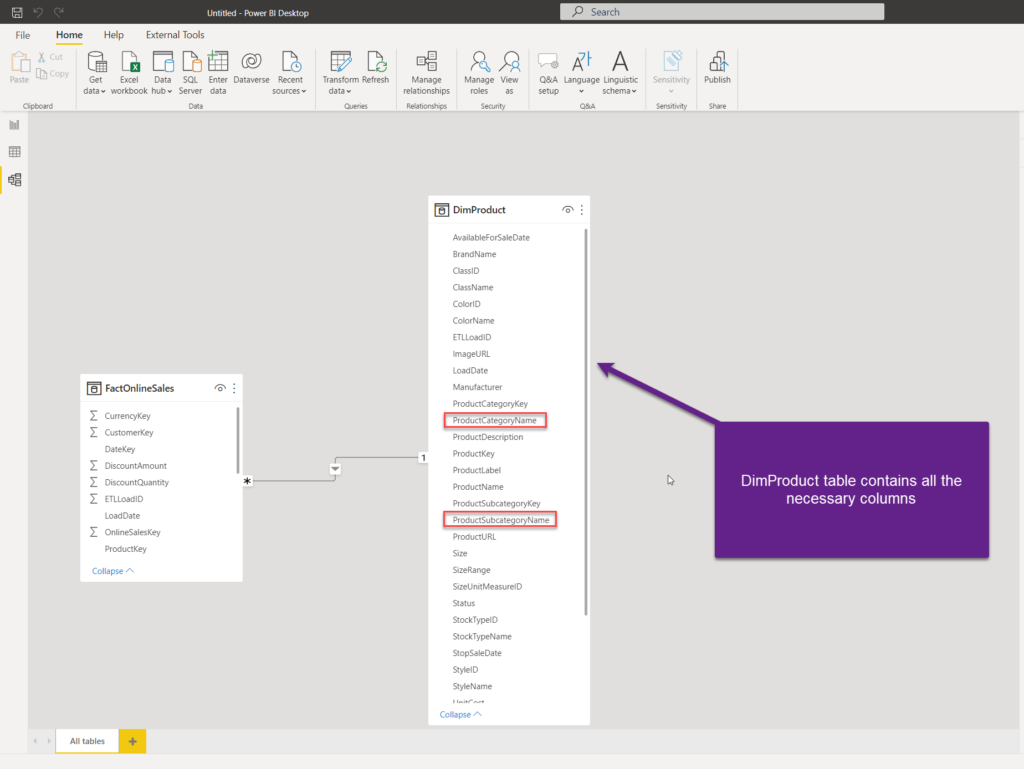
Once I hit Close & Apply, there is only a DimProduct table in the model, containing all the necessary columns.
Conclusion
Denormalization is a very useful data modeling technique in certain scenarios, especially when working with snowflake dimensions that don’t contain a huge amount of data. For the remaining cases, especially if we are talking about denormalizing the fact table, it’s usually not a good idea, and the regular approach which assumes keeping the fact table narrow should always be your preferred choice.
Thanks for reading!
Last Updated on January 18, 2024 by Nikola


Tamir Basin
1. Why would a denormalized model be more efficient in terms of storage? I would except the opposite as I have redundant data
2. Why less joins reduce footprint in memory?
Nikola
Hi Tamir,
Good questions!
1. In the Tabular model, VertiPaq stores compressed data. So, if you don’t have many distinct values in the column (let’s say a column with 50.000 records and 20 distinct values), this column will be highly-compressed and therefore potentially consume way less memory than the relationship between two separate tables (relationships also have memory footprint). Of course, that’s not always the case, but potentially could be.
2. Please see my answer on 1. Relationships also consume memory in the data model, so getting rid of joins means you are also getting rid of these relationships.
Hope this helps.