
In recent months, I was frequently asked if one should use tables or views when IMPORTING data in Power BI. I’ve intentionally marked word importing, as the main purpose of this article is to compare usage of views vs tables in Import mode. If you are interested to learn more about Direct Query mode, in which scenarios you would (not) want to use it, please refer to this article.
What is a view at first place?
I guess you all know what is a table, so I won’t spend time explaining it. And, if you’re coming from the SQL world, you probably know what is a view:)…However, there are many Power BI content creators with no SQL/databases background, so they deserve at least a basic introduction to views.
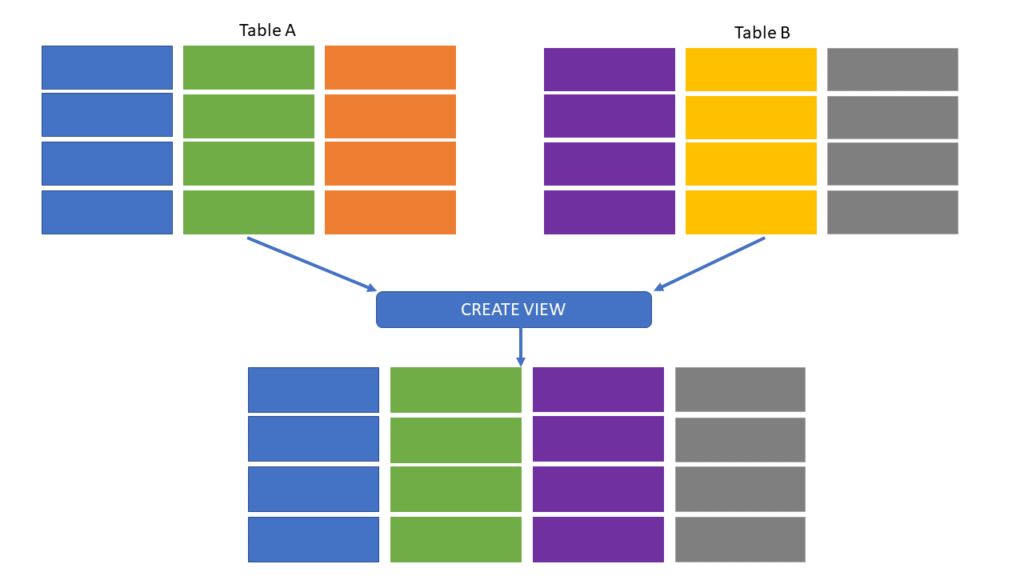
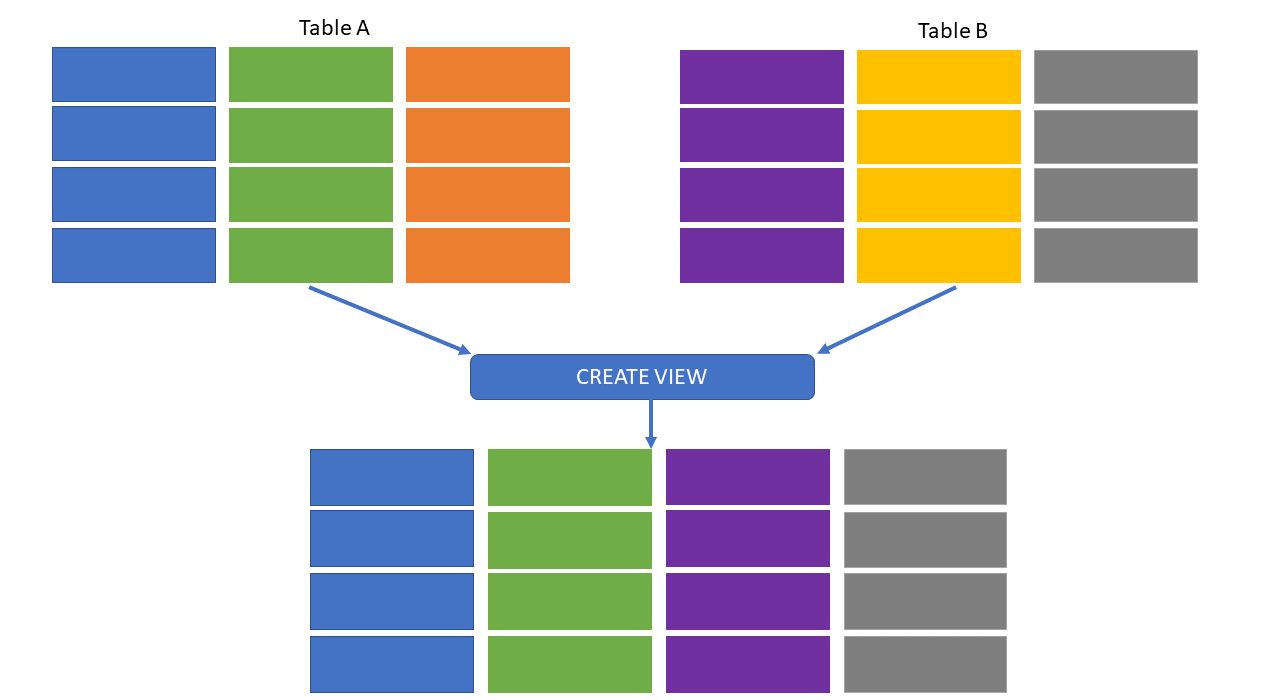
A database view is nothing else but the stored query over data from the database. This stored query can target both tables and other views (you can create a view that queries other views). This stored query (view definition) represents part of the database, but it doesn’t store any physical data! This is the first important difference to a “regular” table – views don’t store the data, which means that every time you need the data from the view, the underlying stored query will be executed against the database. Since views are being run each time you “call” them, they will always pick the relevant data from the underlying tables. That means you don’t need to worry if something changed in the underlying table (deleted/updated rows), as you will always get the actual data from the tables.
Advantages of using views
In certain situations, views can provide multiple advantages over regular tables:
- Views can contain (and usually do) joins between multiple tables, producing a single result set, thus reducing the complexity
- Views may contain only a subset of the data (for example, you can create a view that contains only sales with amount greater than X; view containing currently open purchases; view to include only customers that registered in year X, etc.)
- You can use views to pre-aggregate data for your analytic workloads, using aggregate functions, such as SUM, AVG, COUNT, and so on
- Views can be used to control the access to an underlying data: for example, you can create a view that contains sales for the US region only, and then grant access to that view to relevant users. That way, you’re not exposing all the data from the table, as you can restrict access to a table, while granting access to a view only
- Views don’t consume space in your database (except some trivial amount of memory for storing query definition) – don’t forget, views don’t store physical data!
With all these advantages in mind, I’m sure you can already assume some of the benefits views can provide when used in Power BI.
However, I’m also sure that you may have some concerns about the potential caveats – namely, performance when compared to “regular” tables. Stay tuned, we will “demystify” all the pros and cons of using views over tables in your Power BI solutions…
#1 “Transform your data as upstream as possible, as downstream as necessary” – Roche’s maxim
When explaining the best practices for data transformation and shaping, I always like to quote this sentence from the header, which is known as “Roche’s Maxim” (Roche is Matthew Roche from the Microsoft Power BI team).
Sticking with this idea, if you have a chance to apply your data transformations on the source side (within the database itself), you should definitely do it! Use views to encapsulate complex logic, perform calculations (don’t forget that calculated columns in Power BI are not optimally compressed), or filter out specific portions of data.

I hear you, I hear you…You don’t have access to an underlying database. Well, that’s obviously a potential roadblock, but I believe you should be on good terms with your IT/DBA colleagues, nevertheless of access rights:)…So, talk to them, explain the benefits of using views, and I’m sure they will gladly assist in creating and exposing them instead of raw tables.
Hey, I hear another question: “If we use views instead of tables, we are surrendering the power of Query folding, right?” Beeeep…WRONG! Views, same as tables, are foldable objects! So, even if you need to apply some additional steps to shape the data coming from the view, you should still achieve query folding (of course, assuming you’re applying foldable transformations to your view).
#2 Changes in the underlying table
Here is the scenario: you are importing data from the database table in your reports. Something like the DimProduct table, which is probably the integral part of all your reports. And, there is a huge probability that you’ve imported this table in every report – let’s imagine that you’ve created 50 reports that retrieves the data from the DimProduct table.
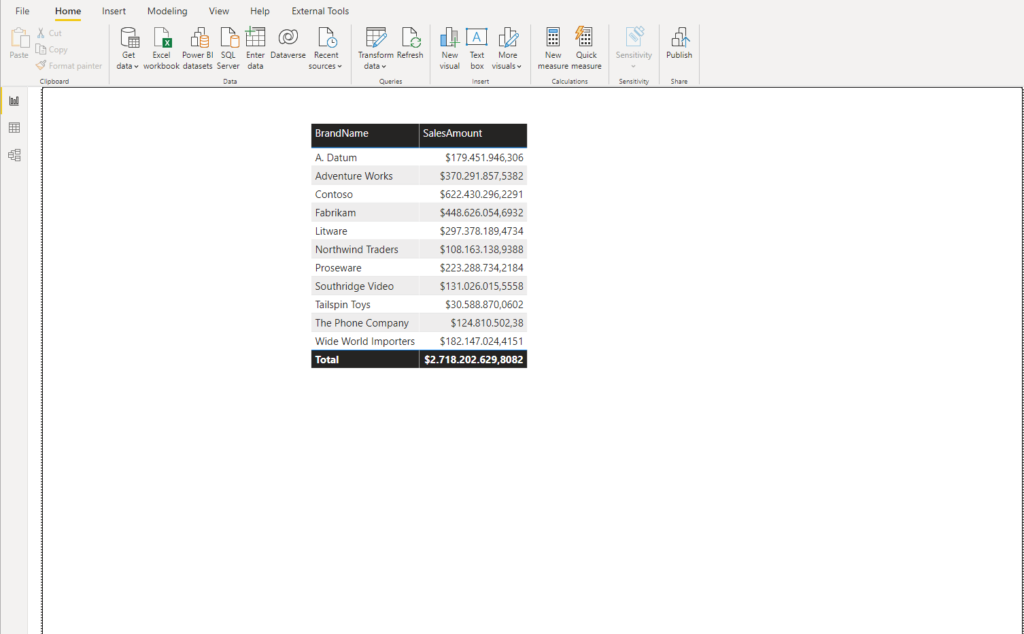
In the illustration above, you can see a basic example of the visual displaying a total sales amount per BrandName. Now, let’s imagine that there is a structural change in the underlying database – for example, the BrandName column has been renamed to Brand:

If I go and refresh my Power BI report, let’s see what happens…
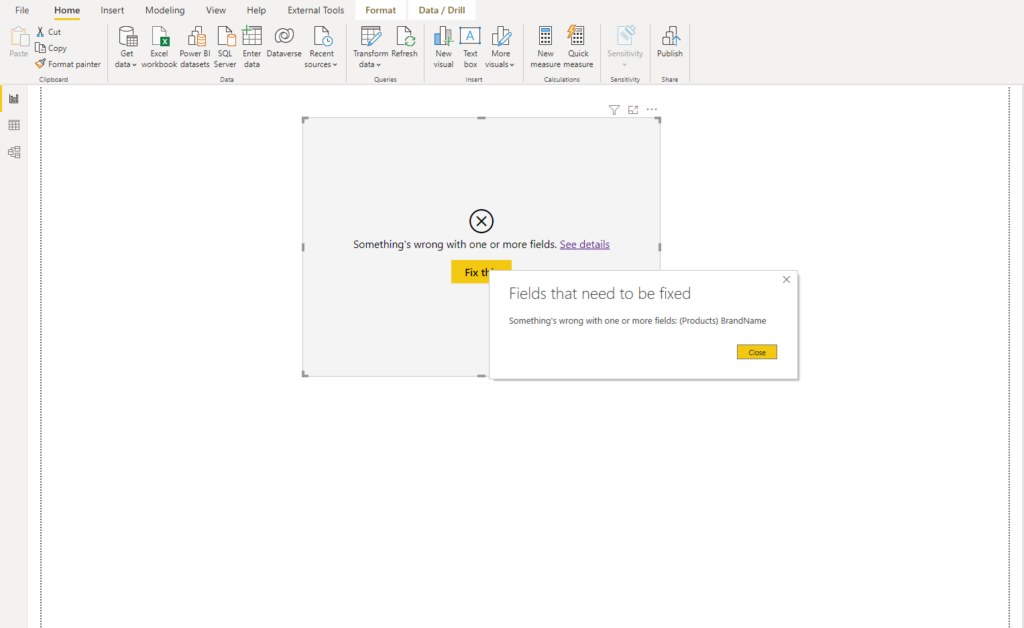
BAAAMMM! My report is broken! Now, imagine the amount of effort needed for fixing 50 reports to handle this structural change. Ok, if you use a view instead of a table, reports will be also broken, but the “small” difference is that you just need to update the view definition and all dependent reports will work again!
So, instead of adjusting 50 reports, you can fix the issue in one single centralized place!
A huge advantage of using views over tables is that the dependency between the Power BI report and physical database model becomes weaker, thus easier to maintain.
#3 View as a 1:1 replication of the table
Ok, it’s easy to understand why you should use views instead of tables when you need to follow the best practices and perform calculations on the source side, or when you want to avoid situations where changes to a table affect multiple reports.
But, the legitimate question one could ask is: if I don’t perform any transformations/calculations (just want my data AS-IS), and I’m sure that no structural changes will occur in the table (even though you should rethink this stance), I should use a table as a data source, right? Well, NO!
There are multiple benefits of using view over a table, even if you don’t perform any transformations along the way!
DISCLAIMER: Don’t create a view writing: SELECT * FROM table… This is not a good practice at all, but explaining why, is out of the scope of this article! Instead, always explicitly define columns that are going to be part of the view.
- You can (and should) exclude all the unnecessary table columns in the view definition. This way, you are reducing not just the amount of data being transferred to Power BI, but also the effort of applying additional steps in Power Query Editor to get rid of unnecessary data. Going back to our previous example, I can easily remove columns such as ETLLoadID, LoadDate or UpdateDate from the DimProduct table, as they are completely useless in the reporting solutions
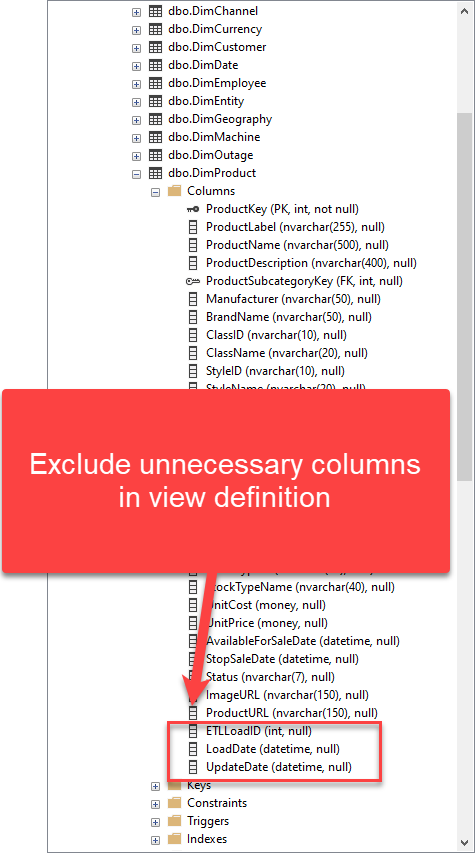
CREATE VIEW [dbo].[Product]
AS
SELECT ProductKey
	,ProductLabel
	,ProductName
	....
FROM dbo.DimProduct
GO
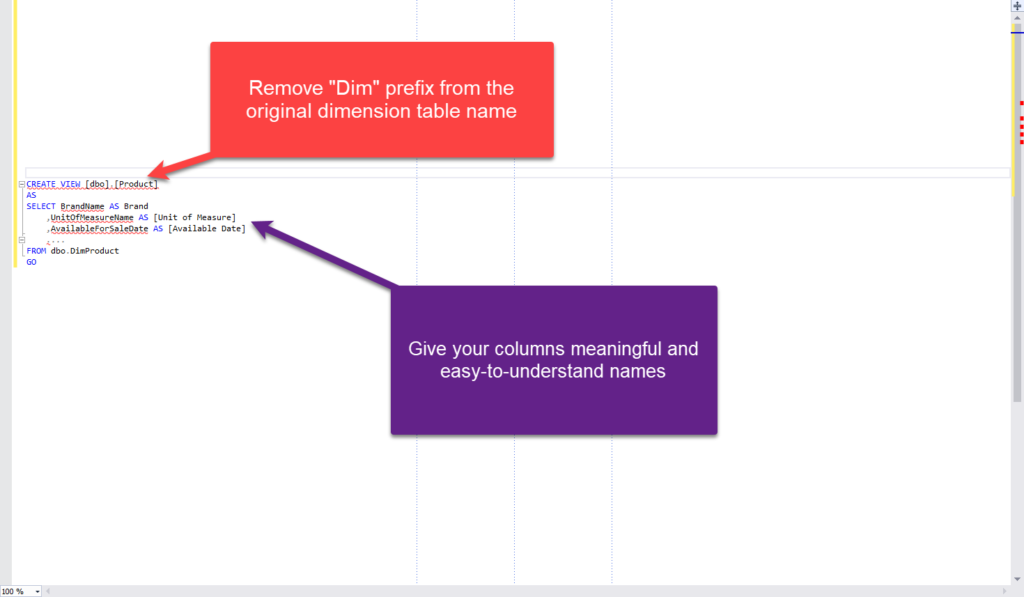
- Using view instead of table, you can ensure consistency between all the reports. For example, imagine that you want all your reports to display the value “Brand” instead of “BrandName” – you can define alias for the column in the view definition, thus avoiding additional step in Power Query Editor of each report to rename this column!
CREATE VIEW [dbo].[Product]
AS
SELECT ProductKey
	,ProductLabel
	,ProductName
	,BrandName AS Brand
	....
FROM dbo.DimProduct
GO
If you import the data from the table, one report creator can rename “BrandName” to “Brand”, the other will call it “Product”, the third will label it “Product Name”, and so on…I think you get the point! By standardizing column names in the view definition, you are ensuring that all reports will be consistent with the naming
- You can easily apply best practices for user-friendly naming of the objects. Instead of exposing users values such as “DimProduct”, “DimDate”, etc, or columns like “UnitOfMeasureName”, “AvailableForSaleDate”…you can (and should) implement user-friendly names, both by removing “Dim” prefix from dimension tables, and by giving your columns meaningful and easy-to-read names. Something like:
So, even though this looks like I’m not transforming my data, in fact, I’m doing exactly that! I’m shaping it and preparing it for convenient and more consistent consumption from Power BI.
Materialized/Indexed Views
I’ve intentionally left this for the end, as indexed/materialized views (the name depends on the relational database management system), represent the best from both worlds! They hold the logic of the view (joins, transformations, calculations), but they keep the result set persistent. Simply said, they physically store the data produced by executing the query. That means that you’ll get performance benefits (you can also create indexes on this type of view), but the trade-off is that materialized views consume space within the database.
The decision on using materialized vs regular views is not a simple one and depends on various factors. In any case, it needs to be carefully evaluated and discussed with your DBA/IT department.
Conclusion
When using a relational database as the data source for Power BI solutions, most report creators choose to take an easier path – import the data directly from tables, without even thinking or being aware of database views! Therefore, in this article, we demystified views and explained why they should be your preferred choice when importing data from the SQL database.
Thanks for reading!
Last Updated on September 6, 2021 by Nikola


Prince Kher
In an ideal reporting solution Data Marts for the specific period should be in place. To be honest on performance based Table will def have better performance if you can load the whole view data rather than joining but if its a timely refresh of data we can always refresh at a non peak time of the report.
Sushanth B
As you said views are stored query upon multiple tables that execute upon calling the view, ok then what will happen when a view is joined to another table to get a result set? Will the stored query need to execute for each record in the join with the table?
Is this a best practice? Or what Is the best practice in this situation?
Select * from tableA a join viewA b
On a.id=b.id
Will viewA stored query will execute for every join records from tableA???
Please clear my question…
Nikola
Hi Sushanth,
Here is a very good article explaining considerations in the scenario you mentioned: https://codingsight.com/top-3-tips-you-need-to-know-to-write-faster-sql-views/
TWIL: November 14, 2021 – André Vala
[…] 3 reasons to use views instead of tables in Power BI!In recent months, I was frequently asked if one should use tables or views when IMPORTING data in Power BI. I’ve intentionally marked word importing, as the main purpose of this article is to compare usage of views vs tables in Import mode. […]
Dev
It’s not a good practice to use views over tables if you are using as is data – regardless of whether you are using import or direct query. As you mentioned in the article, views are nothing but a stored query which is run every time data is called. This means database resource is used each time – and can cause substantial slowdown and cost increase which could totally have been avoided by using tables directly. I read your point on using views if the amount of columns / data is significantly less than what’s on the parent table – I agree with it, but it should be a very specific scenario. It’s almost always a better practice to use tables over views if you are using data as is.
– Dev (10+ years as BI Developer)
Nikola
Hi Dev,
Thanks for your comment.
I talked about using the data from the SINGLE table “as-is” (no joins, calculations, etc.). So, only omit unnecessary columns and/or change column names.
Let’s say that my view A returns 10 out of 15 columns from table B (5 columns are not necessary for reporting purposes). Why do you think that something like: SELECT col1,col2,col3…col10 FROM view A will be more inefficient than running SELECT col1,col2,col3…col10 FROM table B? There’s no difference in terms of performance, costs, etc.
Also, if you import the data to Power BI, why import table B with 15 columns and then remove 5 of them using Power Query, if you can clean up stuff in the database and import view A with only 10 necessary columns? Views, same as tables, support query folding, so no difference from that perspective as well.
Steve G.
Nice article, thanks.
The downside of using views seems to be that you loose PowerBi ability to autodetect relation between your entities. When using direct table PowerBI can retrieve PK and FK definitions to detect relations between them.
Do you have any tips to help PowerBI auto detecting relation between views. I tried using same column name in 2 different views but it doesn’t seems to work.
Adam Smith
I’ve experienced this issue using queries so I’m not certain it’s confined to using views.
Adam Smith
Great article Nikola, thank you.
I really like the idea of creating a view on the table. I’ve recently came across a change in the data where we need to include a new flag indicating a record as inactive. This needed (and probably still does) adding to each report to ensure those were filtered out correctly. Using a single view would have simplified this process.
Another major advantage is that for those with access to the DB, they can see downstream impacts to underlying table changes. In the example, the DBA might chose not to rename the column because they can see that the view references this, or they might chose to update the view when they rename the column.
With queries defined in power bi, including directly importing from the table, the DB has no visibility of downstream impact (at least not to my knowledge anyway).
john
Large Data Sets Notwithstanding, I disagree. I like the upstream lineage to be minimal and the data engineering happen in data flows.