
In the previous article, you learned the general principles of data modeling. Now, it’s time to narrow down our learning journey and master data modeling concepts and techniques that are specifically relevant to business intelligence scenarios. And, whenever we’re talking about data modeling for business intelligence, dimensional modeling is definitely the number one concept.
History Lessons – Ralph Kimball
Before we come up to explain why dimensional modeling is named like that – dimensional, let’s first take a brief tour through some history lessons. In 1996, a man called Ralph Kimball published a book “The Data Warehouse Toolkit”, which is still considered a dimensional modeling “Bible”. In his book, Kimball introduced a completely new approach to modeling data for analytical workloads, the so-called “bottom-up” approach. The focus is on identifying key business processes within the organization and modeling these first, before introducing additional business processes.
4-Step Dimensional Design Process
Kimball’s approach is fairly simple and consists of 4 steps, also known as the “4-Step Dimensional Design process”. Each step is based on a decision.
- It starts with selecting the business process. To be consistent, let’s use the same example as in the previous article and imagine that selling a ticket for an event is the business process we are interested in

- The next step is to declare the grain. Grain? What on Earth is grain? Simply said, that is the lowest level of detail captured by the business process. In our example, the lowest level of detail is the individual ticket sale. We will come up later to explain why choosing the right grain is of paramount importance in dimensional modeling. At this moment, it’s just important to remember that grain refers to the lowest level of detail captured by the business process
- Once you declare the grain, the next step is to identify the dimensions. Let’s forget about this name dimension for a second…And try to explain what “dimension” really is…It’s a special type of table that I like to think of as a lookup table. You know, if you need more descriptive information about a certain object – that’s what you’ll find in the lookup table. Oops, I mean, in the dimension table. Think of a person and its description. How would you describe a specific person? By name, for sure. Then, by gender, age, physical and email address, and probably phone number too. Or product? The product probably has a name, belongs to a specific category, and has a specific color or size. Dimension tables usually answer the questions starting with “W”: Who, What, When, Where, Why. Back to our example: When did we sell the ticket? Where did we sell the ticket? What type of ticket did we sell? And so on…
- The last step in this 4-step dimensional design process is identifying the facts. If we think of a dimension as a lookup table, a fact table is a table that stores the data about events – something that happened as a result of the business process. In most cases, but not always, these events are represented with numeric values – How many tickets did we sell? How much revenue did we make?
Why Dimensional Modeling?
Before we move on to explain different physical implementations of dimensional modeling, let’s quickly reiterate the key benefits of building a dimensional model for business intelligence scenarios:
- User-friendly data navigation – as users, we often get it easier when thinking about the business process in terms of the subjects that are part of the process. Which event sold the most tickets in the 2nd quarter of the last year? How many tickets were bought by female customers for the Champions League final game? Which employee in the USA sold the most VIP tickets for the Super Bowl in 2022? And, many more of course…
- Performance – As you’ve already learned, OLAP systems are designed to support quick and efficient data read operations, which usually means fewer joins between tables. That’s exactly what dimensional modeling provides through Star-schema design – and we’ll go into more detail about it in the next section
- Flexibility – this is one of the key advantages of a dimensional model. Did your customer change the address? Did your employee change position within the organization? No worries, as all these challenges can be easily handled within the model, by using a technique called “slowly changing dimension”. But, more on that later in the article
Data Modeler or Astrologist? Understanding Star vs Snowflake schema
If you find yourself surrounded by experienced data modelers, you’ll probably hear them talking about stars and snowflakes. Don’t worry, they haven’t become astrologists or nature researchers all of a sudden. Star and snowflake schema are probably the most influential concepts in the world of dimensional modeling.
Let’s first try to explain the star schema. Don’t forget, according to Kimball, each piece of data should be classified either as “what, when, where, who, why”, or as “how much”, or “how many”. So, in a well-designed dimensional model, you should have a central table containing all the measurements and events – this is a fact table – surrounded by lookup tables, which we refer to as dimensions. The fact table and dimension tables are connected via relationships established between the primary key from the dimension table and the foreign key from the fact table. If you take a look at the following illustration, you’ll understand why this data modeling design pattern is called star schema.
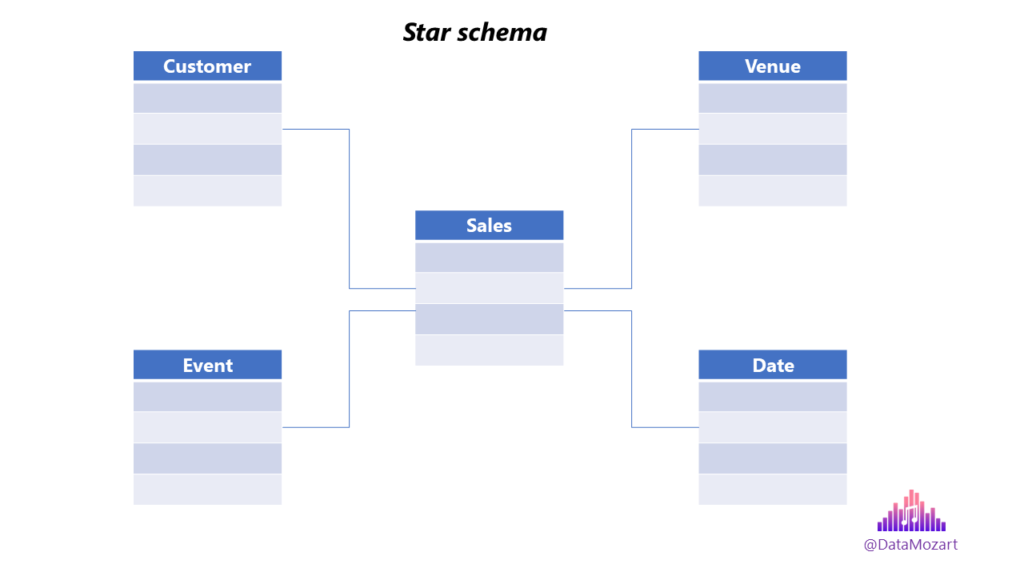
Star schema is a de-facto standard for modeling data in enterprise data warehousing systems, because it enables efficient querying of huge amounts of data, fast aggregations and intuitive data filtering.
Although there are many ongoing debates questioning the star schema relevance for modern data platform solutions because of its “age”, it is fair to say that this concept is still absolutely relevant and definitely most widely adopted when it comes to designing efficient and scalable business intelligence systems.
Snowflake schema is very similar to star schema! Conceptually, there is no difference between the star and snowflake – in both cases, you’ll place your “who, what, when, where and why” into dimension tables, while keeping your “how much” and “how many” in the fact table. The only difference is that in the snowflake schema, dimensions are normalized and broken down into sub-dimensions, as you may see in the following illustration, which is why it resembles a snowflake.
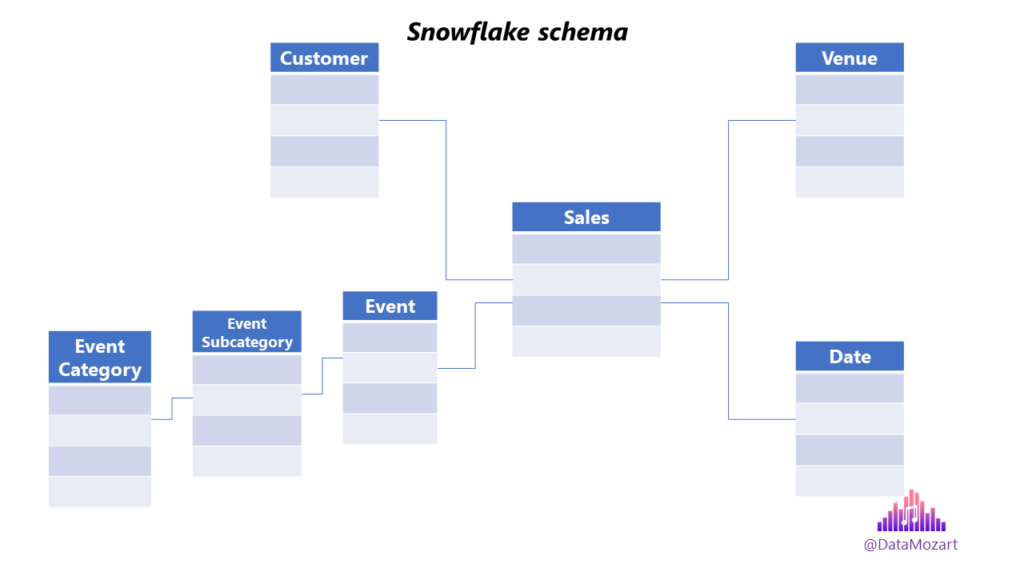
The main motivation for normalizing dimensions is to remove the data redundancy from the dimension table. Although this might sound like a desirable approach, normalizing dimensions comes with some serious considerations:
- The overall data model structure becomes more complex
- Performance may suffer, because of the joins between normalized dimension tables
Of course, there are specific use cases where dimension normalization may be a more viable choice, especially in regard to reducing the data model size. However, keep in mind that snowflake schema should be an exception rather than a rule when modeling your data for business intelligence workloads.
Star schema should always be a default choice!
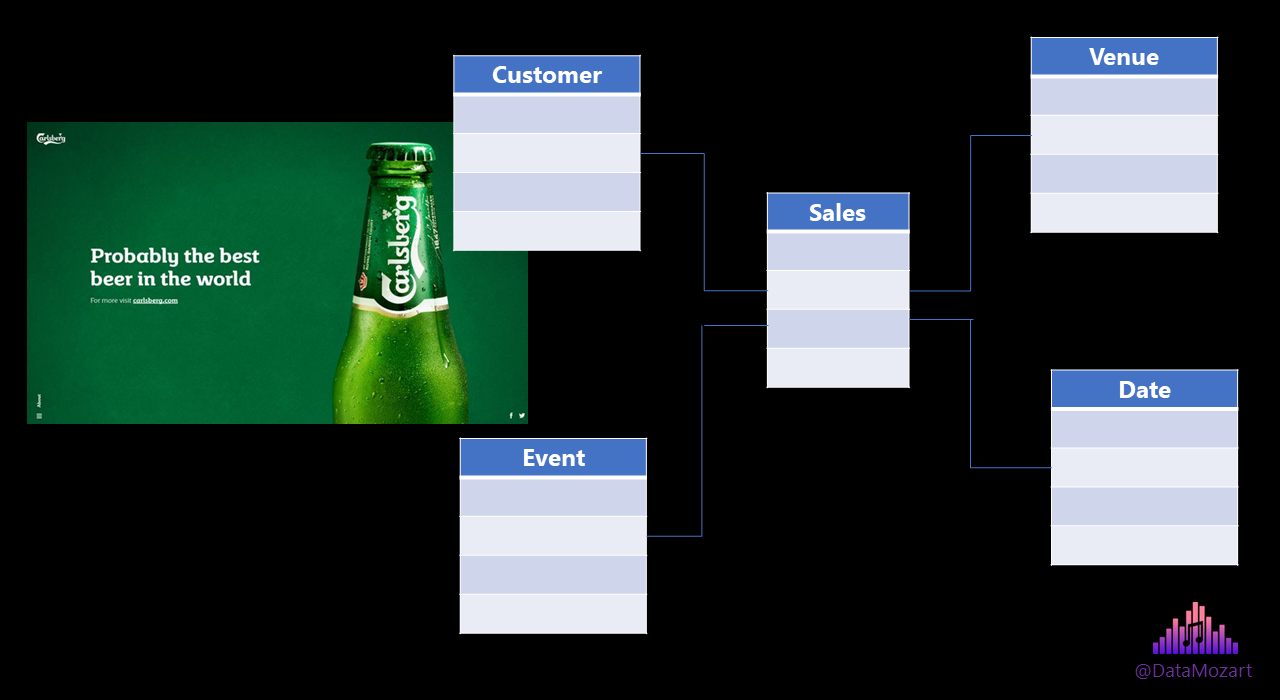
To wrap up this topic on the Star schema relevance, I like to use an analogy to a marketing message created by Carlsberg Brewery, which says:

Translated to data modeling world:
The Star schema is PROBABLY the best data model in the business intelligence world…
3 Things to Know About Fact Tables
There are dozen of wonderful books (like the aforementioned “The Data Warehouse Toolkit”, then “The Star schema – Complete Reference” by Christopher Adamson), which I strongly encourage you to read and learn all the details about dimensional modeling and the star schema in particular.
Therefore, thinking that reading this, or any other single article, will make you a “master of dimensional modeling” would be absolutely wrong and pretentious. However, I would like to emphasize 3 key concepts relevant to fact tables in the dimensional model.
Disclaimer: these are 3 concepts that I personally find most important and that doesn’t necessarily mean that you should not consider some other concepts more relevant.
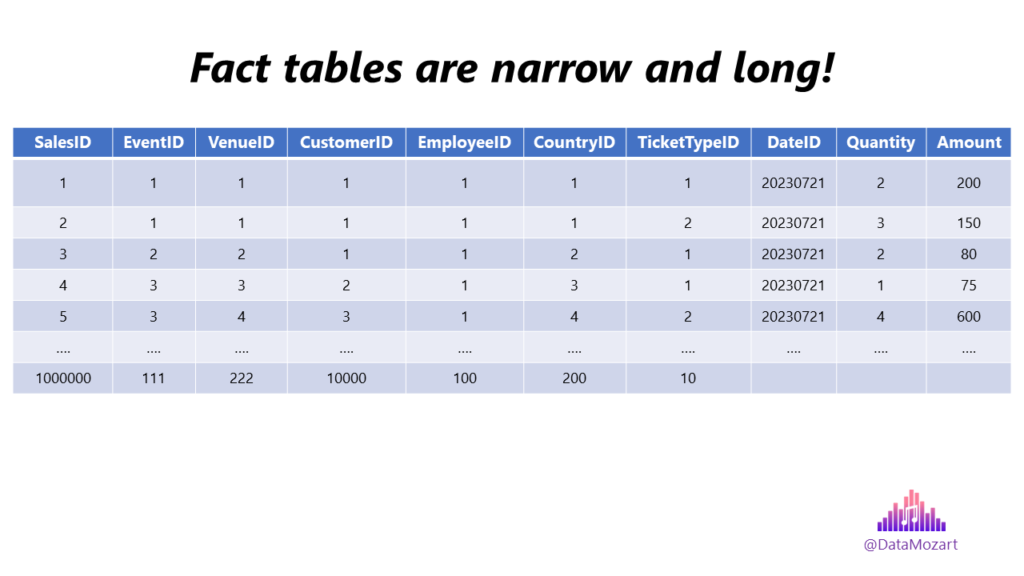
- Fact table structure – In most cases, a fact table will consist of the numeric values produced by measuring the event from the real world, and a bunch of foreign keys of related dimension tables. At the lowest grain, a fact table row corresponds to a real-world event. Thus the fact table design is entirely based on this event and is not influenced by the eventual future reports that may be produced. Fact tables are usually narrow and long (huge number of rows and less number of columns)
- Additive, Semi-additive and Non-additive measures – Numeric values that we store in a fact table are not always the same “nature”. Additive measures are the most flexible and can be summed across any of the dimensions associated with the fact table. Semi-additive measures can be summed across some dimensions, but not all. A typical example is balance amounts which are additive across all dimensions except time. Finally, some measures are completely non-additive, like ratios for example
- NULLs in fact tables – The key thing to keep in mind here: not every NULL value behaves nicely in the fact table! While it’s completely fine to have a NULL for the measurement, using NULLs as foreign keys in the fact table should be avoided at all costs, because this will cause referential integrity violation. This can be solved by introducing a special default row in the dimension table for the “Unknown” or “Undefined” record
3 Things to Know About Dimension Tables
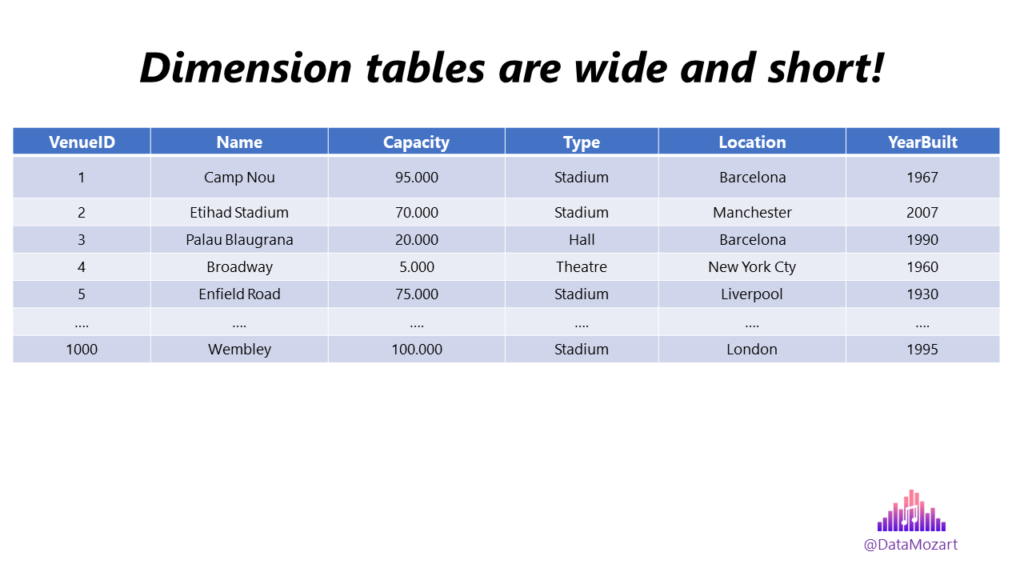
- Dimension table structure – A dimension table should always contain a single primary key column, which is used as a foreign key in a related fact table. Dimension tables are usually wide and short (many columns, less number of rows, although there are dimensions with multimillion rows). Dimension tables are denormalized, containing usually text attributes and descriptions
- Slowly changing dimension (SCD) – This is one of the key concepts for handling data changes over time. Don’t let this “slowly” word confuse you:)…It’s not about “slow” or “fast”, the emphasis is on the word “changing”. There are multiple techniques to handle modifications of the dimension attributes (think of changing the physical address, or phone number of the person), and Kimball lists no less than 8 different SCD types! However, the most commonly used type is Type 2, where you’d add a new row in the dimension table and update the row validity attribute
- Role-playing dimensions – I’ve already written a whole article on this topic and explained how this concept can be applied within Microsoft Power BI
As I mentioned, these are just a few concepts relevant to dimension tables, and I strongly advise reading Kimball’s or Adamson’s book to understand other important concepts and techniques.
Conclusion
By learning about various data model types (conceptual, logical, and physical), we’ve built a solid foundation for understanding the importance of the data modeling process in general. Dimensional modeling, though only a subset of data modeling, is one of the concepts that are of key importance in implementing efficient and scalable real-life business intelligence solutions.
To conclude, the biggest advantage of dimensional models is their flexibility and adaptability. Here is the list of the changes that can be applied without violating any existing business intelligence query or application:
- If you want to add new facts to the existing fact table, it’s as simple as creating a new column (assuming that “new” facts are of the same grain as the existing ones)
- If you need to add new lookup attributes to the existing fact table, it’s as simple as adding a new column with the foreign key to a new dimension table
- Whenever you need to extend the existing dimension table with new attributes, it’s as simple as adding a new column to the respective dimension table
Thanks for reading!

Last Updated on October 27, 2023 by Nikola


Donald Parish
Good summary. You might add a link to the Kimball Group Reader and to Chris Adamson’s book. Oh and don’t forget the sqlBI “orange” book.
Nikola
Great tip! Links added.
Richard
This article is worth the read in every sense of the word. I particularly enjoyed the discussion on Kimball’s modelling approach.
Nikola
Thank you very much Richard!