This article is the part of the series related to mastering DP-500 certification exam: Designing and Implementing Enterprise-Scale Analytics Solutions Using Microsoft Azure and Microsoft Power BI
Table of contents
If you’ve carefully read the previous article in this series (the one related to external tools), you probably noticed that creating calculation groups is not feasible from the Power BI Desktop, but from the Tabular Editor external tool. However, before I show you how to create a calculation group, let’s first try to answer the simple question:
What are the calculation groups?
Instead of giving you a “dry” definition of the calculation groups, I’ll try to share a “descriptive” version: Imagine that you have a fact table containing 10 different metrics, such as: sales amount, sales quantity, discount amount, return quantity, and so on. Now, as every “pro” Power BI developer, you’ll go and create 10 explicit measures for each of these metrics.
The next step is to provide your business users with additional information, for example: what was my sales amount in the previous quarter? Or, how my sales quantity developed year-over-year? Or, what is the running total of the return quantity for the selected time period? So, how do you achieve this?
Of course, you’ll write a measure to calculate sales amount for the previous month/quarter/year…Then, you’ll write the same set of calculations for sales quantity…Then, for return quantity…And, so on…So, you quickly end up with 50 measures in your dataset! And, most of them contain basically redundant logic – you’re just copy/pasting the expression and switching the base measure (sales amount/sales quantity/return quantity).
And, here Calculation groups come to the rescue!
With calculation group, you set a placeholder for the specific base measure (for example, sales amount, sales quantity, etc.), and then you define a set of calculation items that will be applied to that “placeholder measure”!
I know, it sounds a little bit confusing, so let me show you just a simple example of the “placeholder measure” and calculation items:
Placeholder measure:
SELECTEDMEASURE() – evaluates the measure that is currently in the context (for example, sales amount)
Calculation items:
- Month-to-date calculation
CALCULATE(SELECTEDMEASURE(), DATESMTD(DimDate[Date]))
- Year-to-date calculation
CALCULATE(SELECTEDMEASURE(), DATESYTD(DimDate[Date]))
- Previous year calculation
CALCULATE(SELECTEDMEASURE(), SAMEPERIODLASTYEAR(DimDate[Date]))
Creating Calculation group using Tabular Editor
Creating calculation groups in Tabular Editor is a straightforward process. In this example, I’ll use a sample Contoso database and a free version of Tabular Editor external tool (Tabular Editor 2):
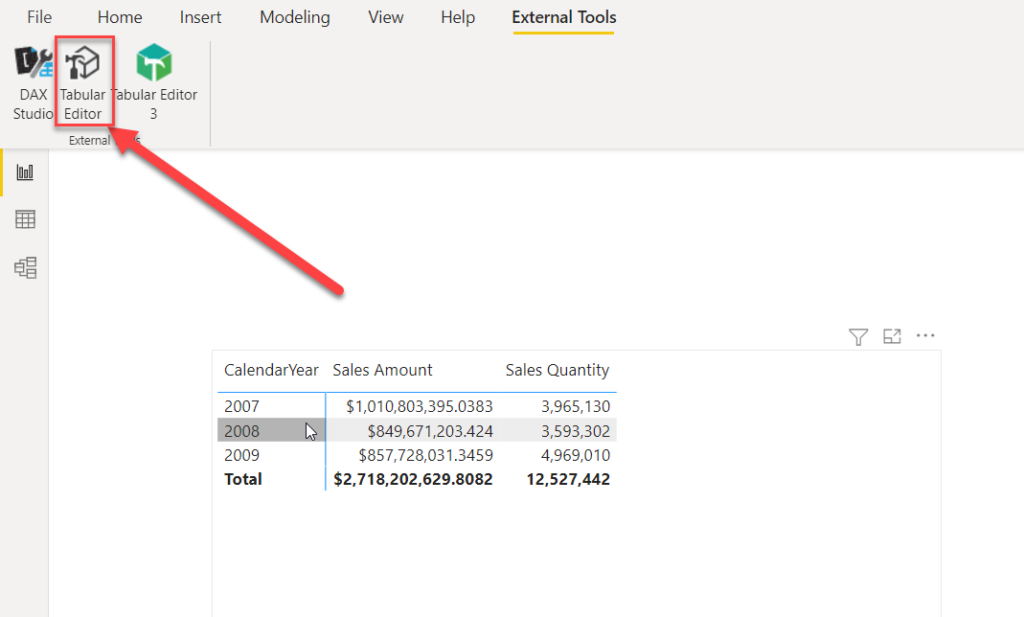
As you see, I have two base measures, Sales Amount and Sales Quantity. Now, if I want to provide information about the values for Month-to-date/Year-to-date/Previous year, I would have written additional 3 measures for Sales Amount, plus additional 3 measures for Sales Quantity.
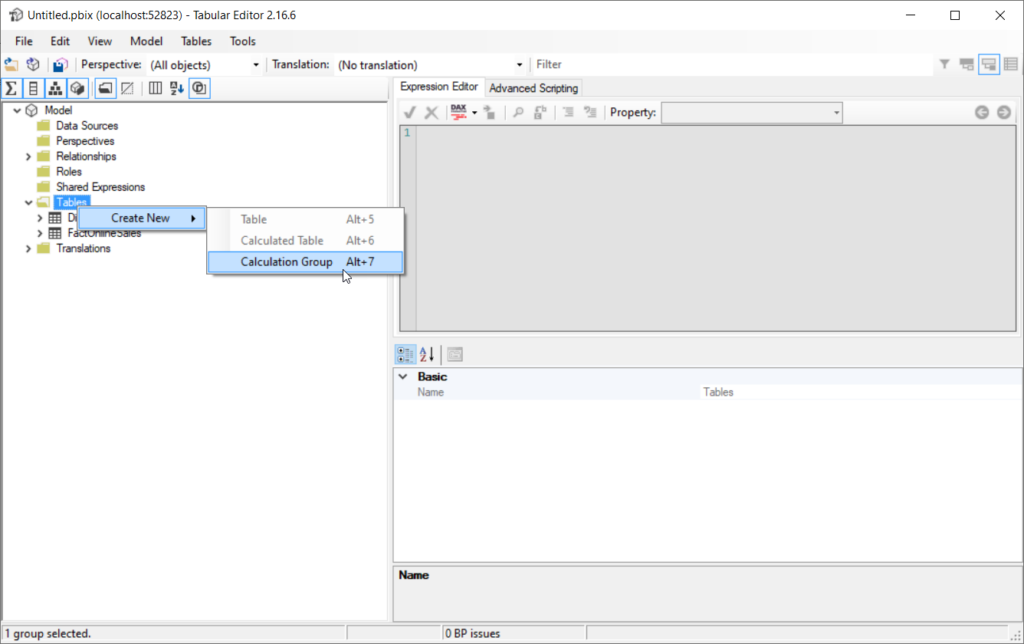
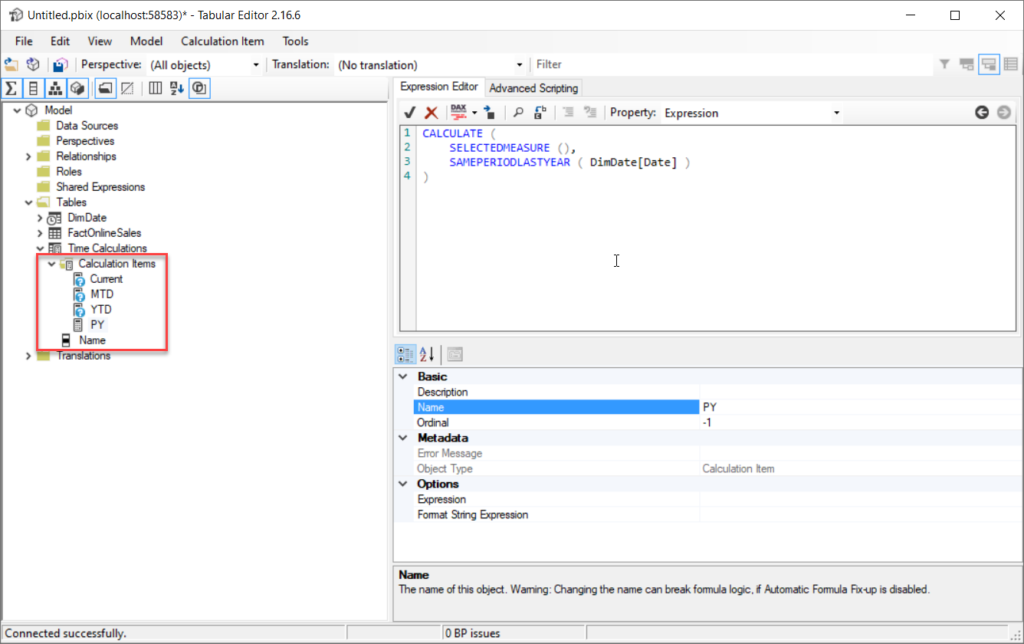
But, let’s switch to Tabular Editor and define calculation items for our calculation group:
Then, I’ll rename my calculation group to something more meaningful, like Time Calculations, right-click on it and add a new calculation item, which will basically be my “placeholder measure”:
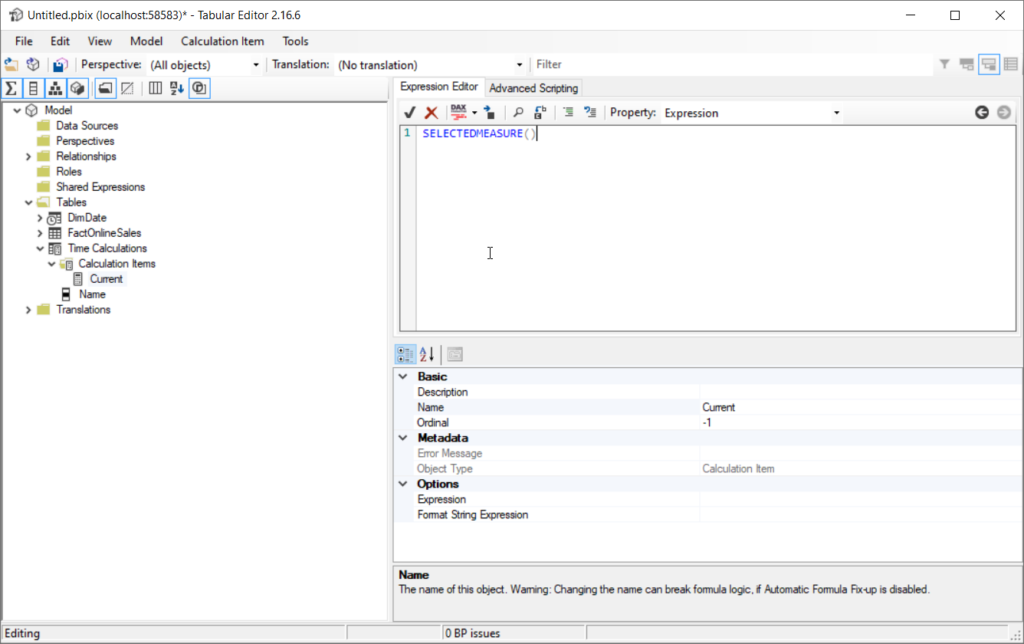
Next, let’s create other calculation items based on our “placeholder measure”:
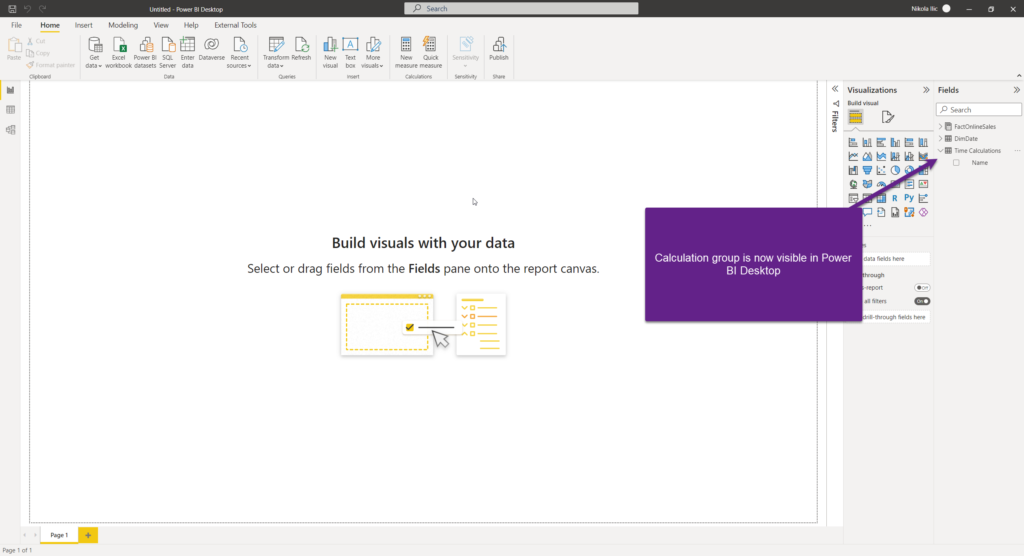
Once I’m done, I’ll save the changes to the data model and refresh the model in Power BI Desktop:
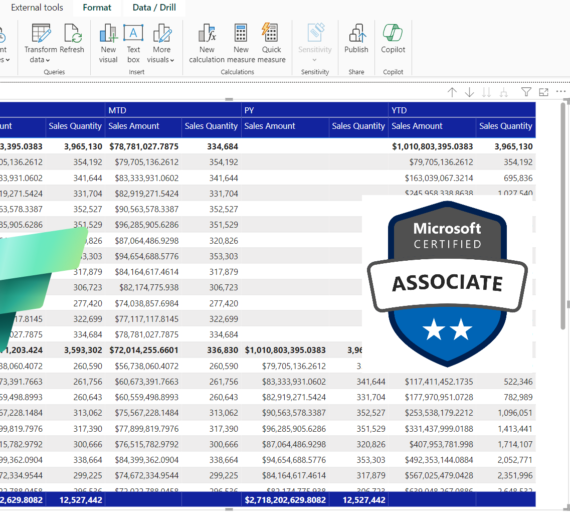
Let’s put our calculation group into action and create a simple matrix visual to show the metrics:
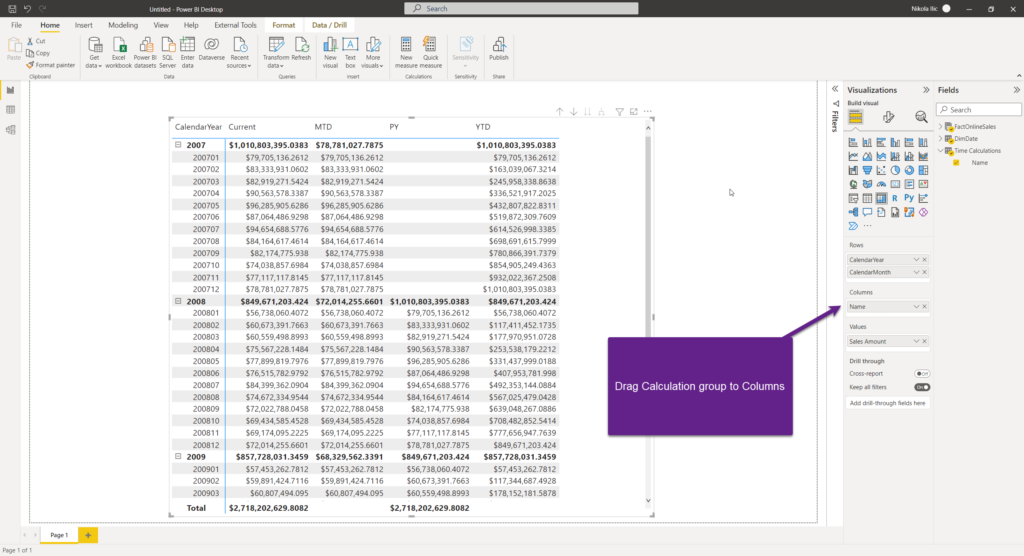
Voila! Once I drag calculation group column to the Columns field of my matrix, I’m able to see all the calculations I defined in the Tabular Editor.
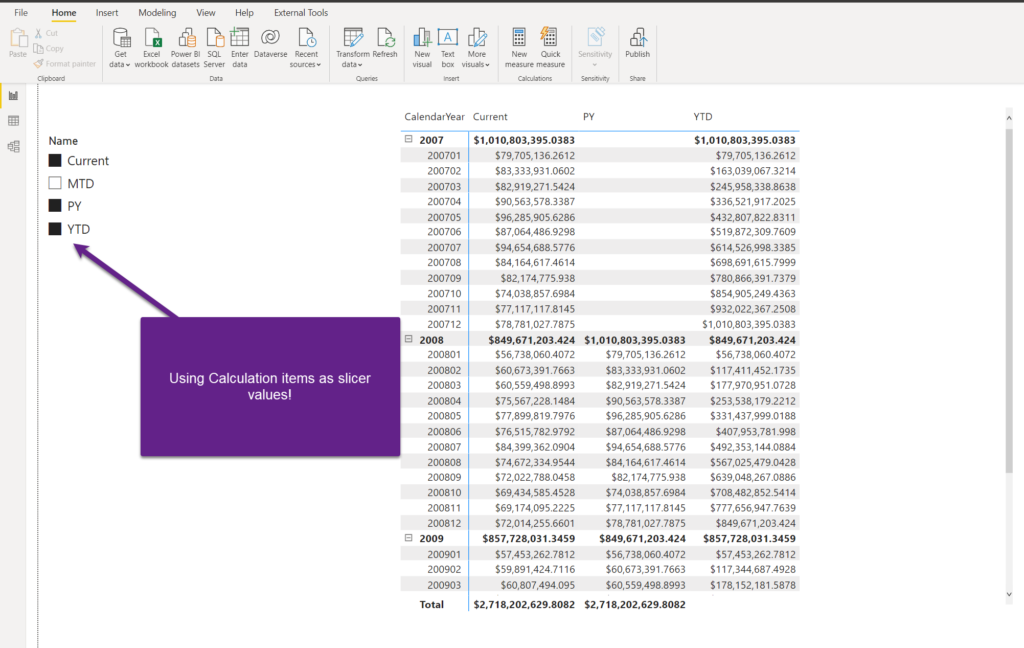
And, there is more to it! I can use this column in a slicer, so that users can select which metric(s) they want to see in the visual:
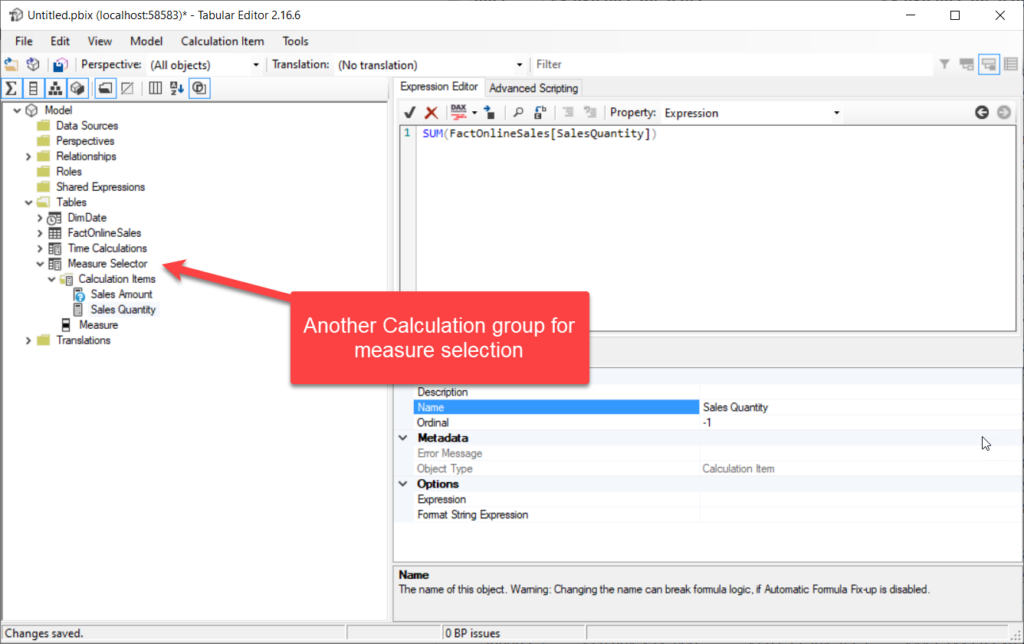
And, it’s not over yet! I can also create multiple calculation groups and enable report users with even more flexibility for analyzing the data, while at the same time reducing the data model complexity and redundancy.
In the following illustration, you can see that I’ve created another calculation group, called Measure Selector, where I’ve just defined two calculation items based on my base measures:
SUM(FactOnlineSales[SalesQuantity])
SUM(FactOnlineSales[SalesAmount])
The important thing here is to set the proper precedence of the calculation groups! This is the property that defines the order of evaluation of the calculation groups, when you have multiple calculation groups in your data model. So, I’ll set the precedence of the Time Calculations group to 10 (higher precedence than Measure Selector group), and let’s see how it works in the Power BI Desktop:
Amazing! So, instead of creating dozens of measures and bloating our data model with redundant data, we were able to achieve the same outcome by leveraging Calculation groups feature in Power BI!
Conclusion
Calculation groups are one of the most powerful features in Power BI! They enable you to reduce data model complexity and redundancy, but keep in mind that you can’t create them from the Power BI Desktop directly, as you must use external tools (namely Tabular Editor).
This was just a simple showcase of what Calculation groups can do for you. Of course, there are many more possible use cases and scenarios.
If you’re interested to learn more about Calculation groups, I suggest starting with SQLBI series of articles. Also, Bernat Agullo Rosello has a series of fantastic blog posts and presentations, showing very creative ways of implementing Calculation groups in Power BI.
Additionally, if you’re looking to get yourself ready for the DP-500 exam, make sure to check Andy Cutler’s YouTube channel for useful resources.
Thanks for reading!
Last Updated on January 20, 2023 by Nikola