DISCLAIMER: I had an opportunity to test the Powerops Desktop tool for free in the previous months, thanks to the complimentary license provided by the tool creators (Truviz)
In the last 2-3 months, I had an opportunity to try and test the new external tool, called Powerops. This is an external tool developed by Truviz, the company you might already know as the creators of various Power BI “goodies”.
Now, you are probably expecting “another Power BI external tool that solves a specific challenge”…I’ll tell you straight away – you can’t be more wrong! Powerops is a mix of various existing external tools – think of DAX Studio, Tabular Editor, ALM Toolkit, Measure Killer, etc. – but it’s also more than a simple sum of the features of the aforementioned tools.
Another thing is – almost every existing external tool focuses on functionality (which is completely logical, right?) and doesn’t offer too much in terms of UI and user experience. Powerops is a full package – not only that it provide functionality (it provides a TON of them), but it also looks and renders fantastic.
Before I jump into the details about Powerops, go and download the desktop version of the tool for free at: https://powerops.app/
You can use it without any limitations for the first two months. After that, you either choose the paid version, or you can upload two files per month with the free license. Additionally, if you install it on the same machine as Power BI Desktop, you can quickly access it from the External Tools tab in Power BI Desktop.
Let’s now dissect the core Powerops functionalities.
Analyze
Once you open Powerops, you can choose to upload any of the Power BI supported formats (pbix, pbit, pbip). However, you can also upload model-related formats, such as bim files, TMDL folder, or dataset folder!

I’ll upload a pbix file and you can immediately see what I was talking about. The design looks modern and sleek:
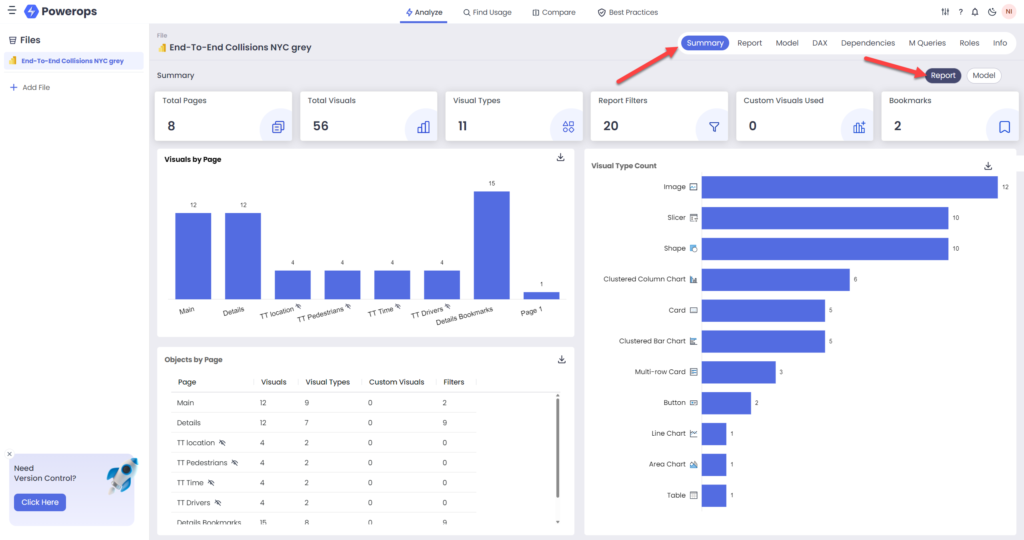
This is just a Summary page, but it already contains a ton of useful information! The information displayed is for the Report only. I can also switch to the Model view in the top right corner and I’ll see a different set of attributes and metrics included:
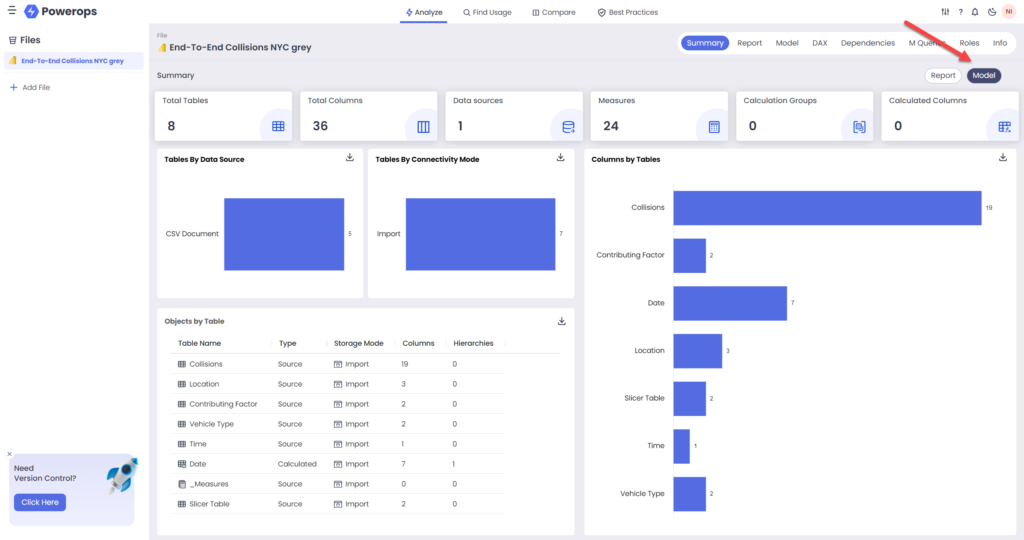
Obviously, you can drill down and check each of these metrics in more detail, but I’ll leave you to do it on your own, as there are many more functionalities to show here.
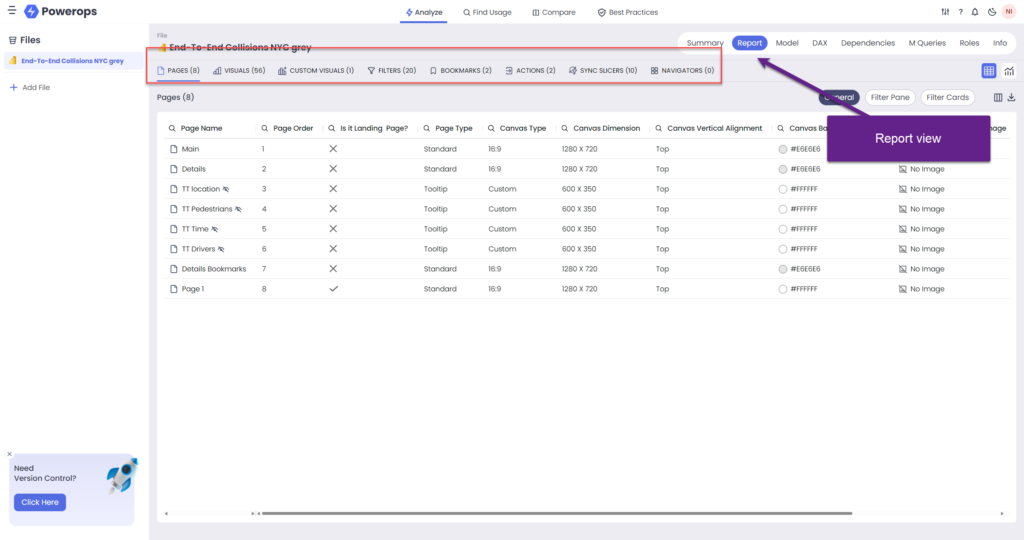
In the illustration above, you see what is included in the Report view and how many different properties are analyzed! Of course, you can click on each of the properties in the top ribbon (for example, custom visuals, or bookmarks) and see each and every detail about them.
It would require writing a novel to examine every property available, but one of my favorites is Dependencies. It shows dependencies from three different perspectives: Model, Report and Power Query…
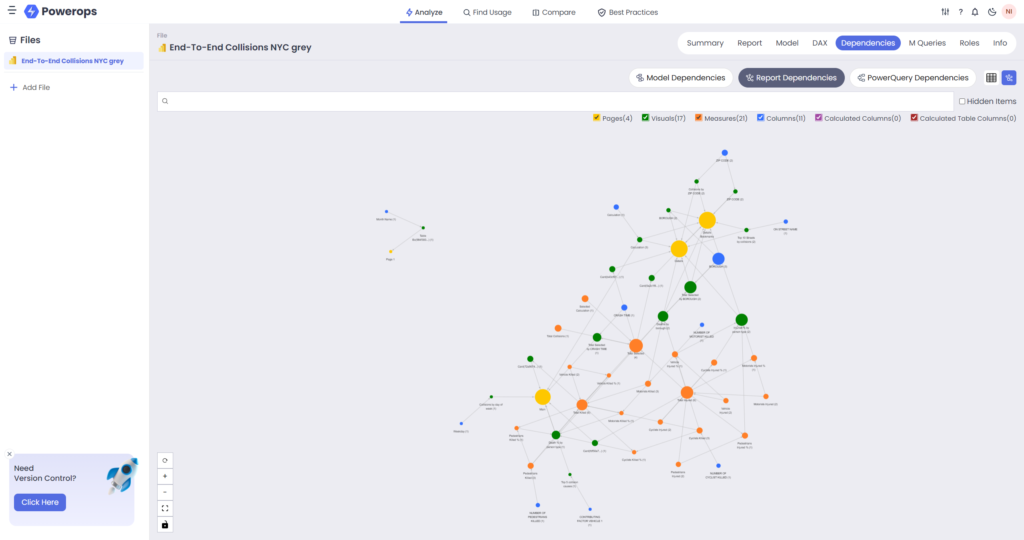
This is my favorite – report dependencies view. How cool is that! You can uncheck objects that you don’t need in the dependency graph to reduce the clutter.
Then, M Queries. You can see both enabled and disabled M queries and quickly grab the code if needed:
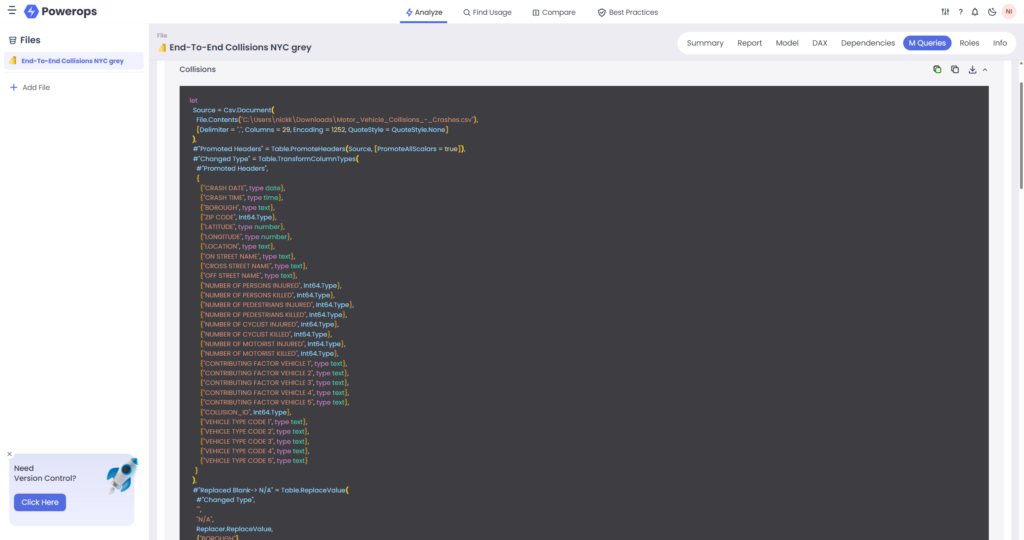
From there, you can also export the code as a txt file.
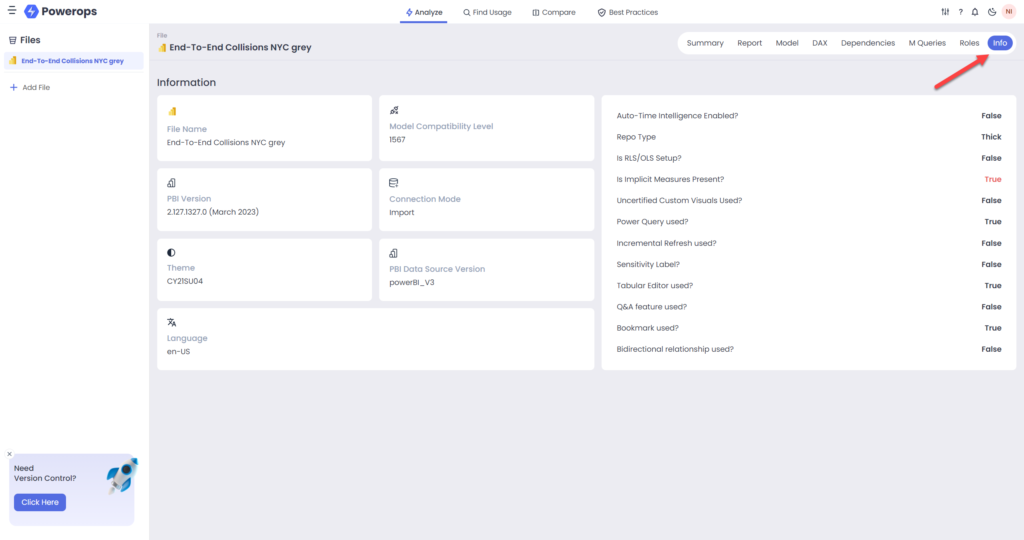
Roles contain details about security roles defined in the semantic model (RLS/OLS), whereas Info displays high-level information about the report:
Find Usage
Let’s move on to the second main functionality – Find Usage. This one helps you understand which items are (not) used.
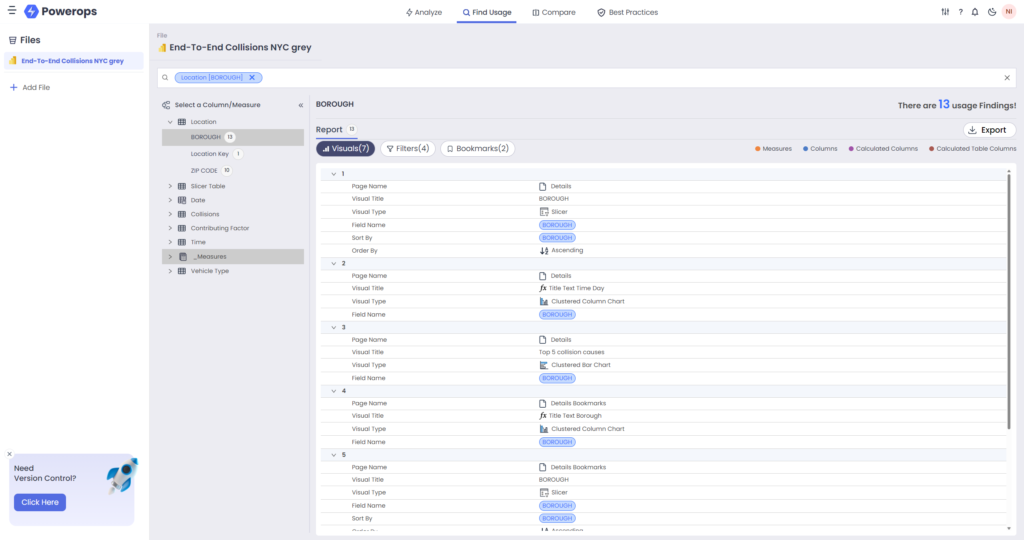
For each item (column and measure) you can see exactly where and how it’s being used. Be it in visuals (and, then, in which visuals and in which way), filters, or bookmarks.
Compare
Yes, it’s nice to have all this information about the particular report available, but it would be even better if we could compare two files in parallel, right? And, this is what Compare functionality provides.
Here, I have two versions of the same report. They are very similar, but still slightly different. Let’s see if Powerops can catch these differences.
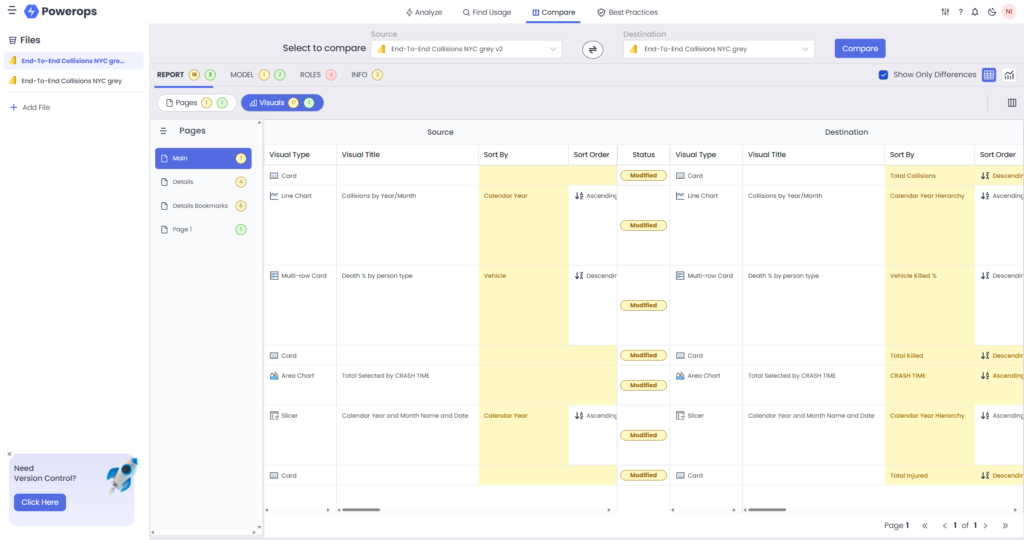
This is – MAGNIFICIENT! You can compare files from different perspectives:
- Report – and then, one level further, by pages or visuals
- Model – again, which columns are different, or if there are any differential objects (think of perspectives, calculation groups, and so on)
- Roles
- Info
Best Practices
If you love Best Practice Analyzer in Tabular Editor, then you’ll love Best Practices functionality in Powerops too. It’s just a more “cool looking” cousin of BPA:)
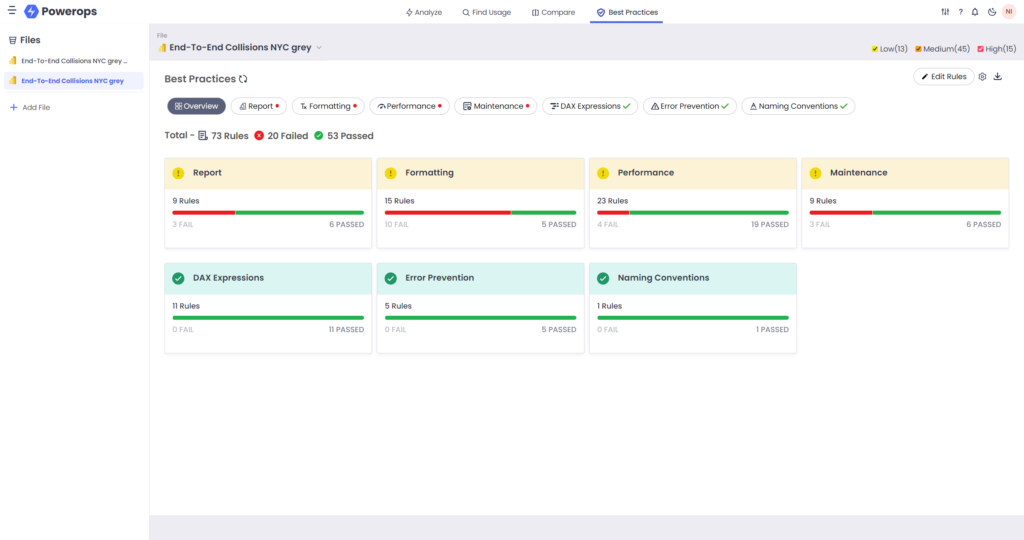
The same as in BPA, Powerops checks rules for different categories – such as Formatting, Performance, DAX Expressions, etc. Similar to BPA in Tabular Editor, you can edit existing rules or add your own on top of them!

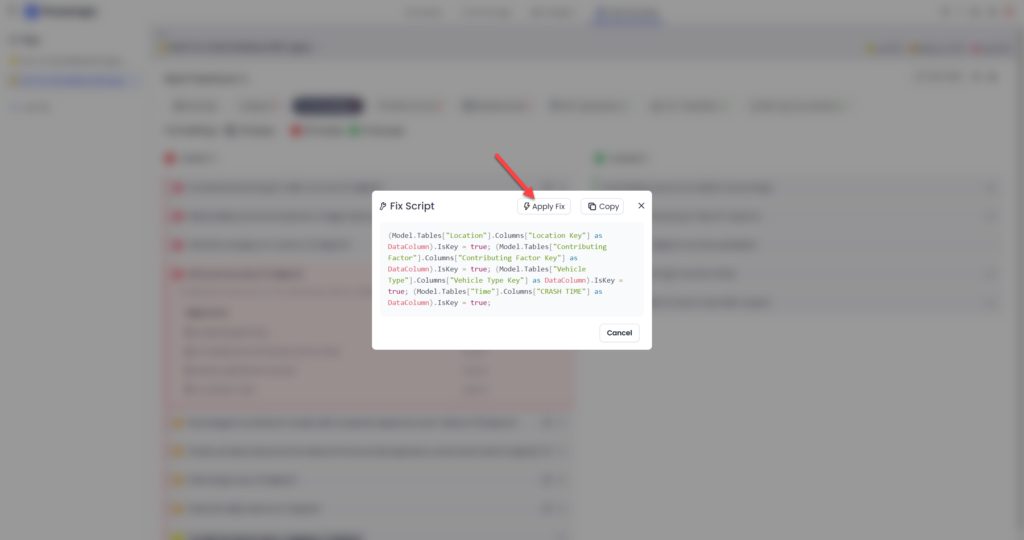
Best Practices functionality found something that collides with the recommended Power BI practices? Don’t worry, for many broken rules you can apply fix directly from Powerops! No need to go to Tabular Editor (although you can also copy the fixing script and execute it from TE if you like)!
And, I saved the best for the end:)
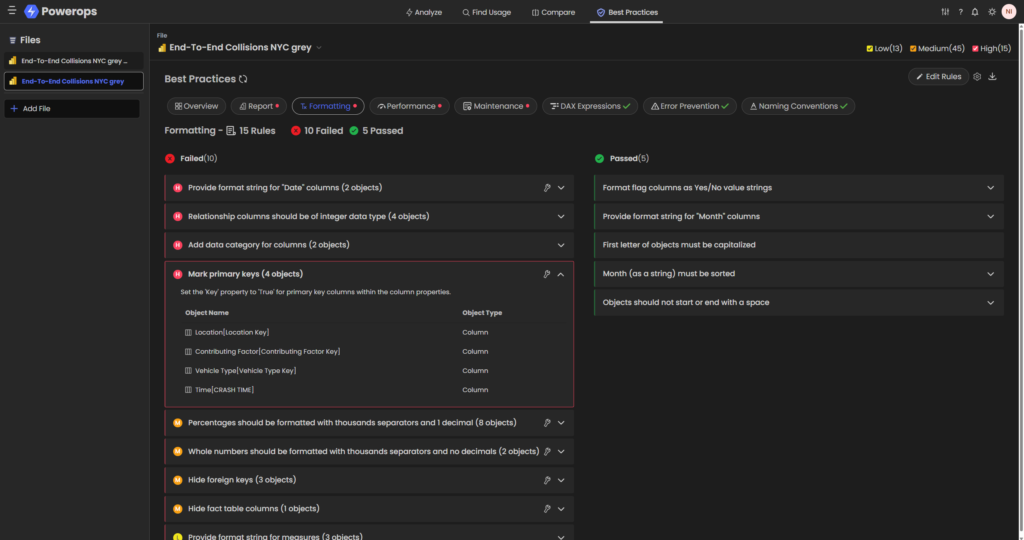
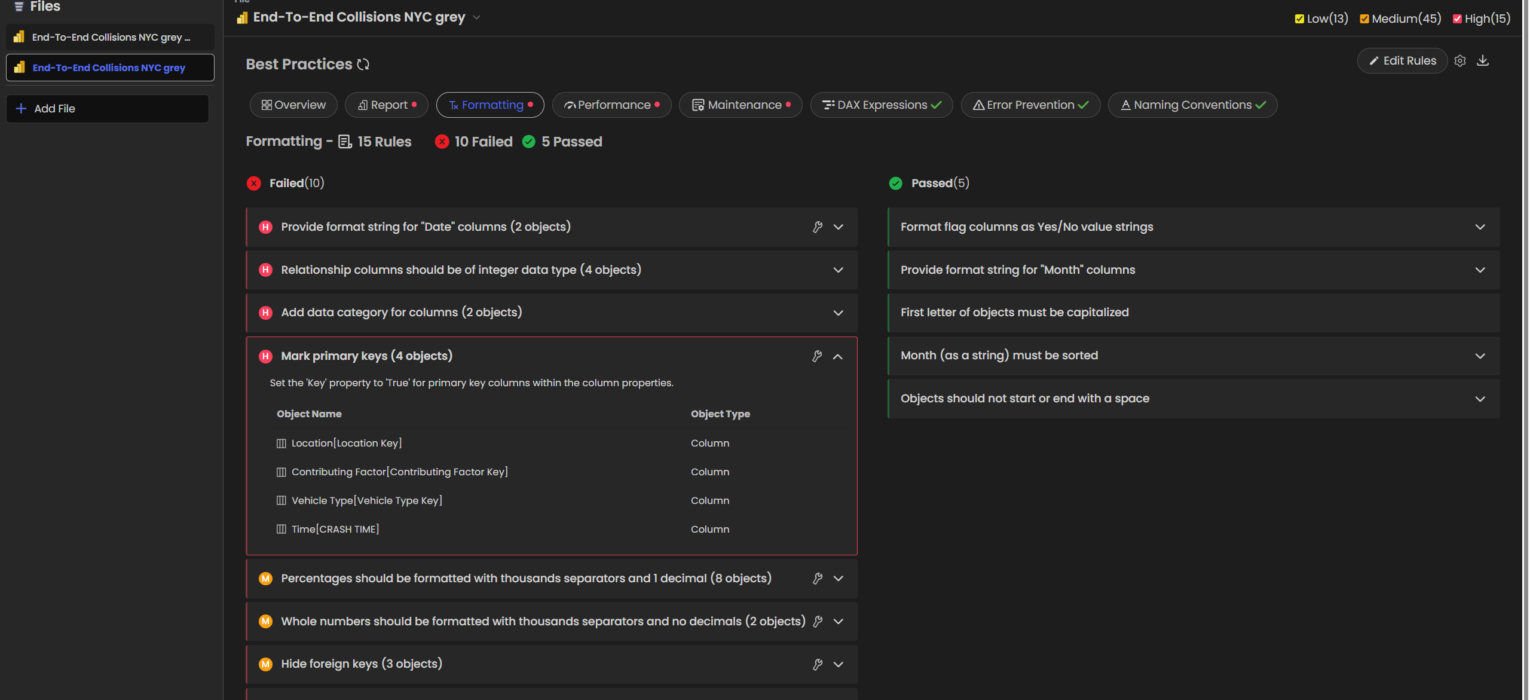
Yes, dark mode! Although I’m not a fan and prefer working in the light mode, I know that a lot of people will ask if the dark mode is available…
Conclusion
Powerops is THE tool you need! Simple as that! The breadth and depth of the information you get at a single place about your Power BI artifacts is simply astonishing. Powerops reminds me of “The Best Of..” album compilations – you know when they pick up the best songs from multiple albums and create a compilation full of hits – this is what Powerops did in the world of external tools, compiling all the best features from other existing tools under one umbrella.
Thanks for reading!
Last Updated on May 2, 2024 by Nikola


Sergej
Hey Nikola,
thanks for sharing. Nice one!
PBI Desktop version seems to be incorrect.
Displayed version 2.127.1327.0 is March 2024 – not March 2023.
Maybe it is fixed meanwhile.
Nikola
Hey Sergej,
Good catch! I’ll double-check this.
Thanks.
Nikola
Milos
Thank you for sharing this. I have joined the waitlist!
Love reading your blog Nikola!
Koen
Can it still show dependencies and unused objects if you use a central semantic model and then separate reports that connect live to this model?