

Beginning this year, Microsoft’s announcement on the general availability of Read/Write XMLA endpoints, widely opened the door to many external tools intended to provide additional modeling capabilities supported by the Analysis Services engine, but not natively supported in Power BI Desktop.
Among many great tools, Tabular Editor, created by Daniel Otykier, is probably the most popular one, together with DAX Studio. By definition, TE is a lightweight editor for SSAS Tabular Models (so, it can be used also out of the Power BI scope), that enables you to build, maintain and manage Tabular Models. Up until recently, Tabular Editor was completely free to use, and it can still be downloaded for free here. At the moment of writing, the latest version is 2.16.1, and Daniel promised to provide support for the free version in the future too.
However, beginning this month, we finally got a new version of the favorite tool of many Power BI developers – Tabular Editor 3! This version is not free anymore (you can find licensing options here), but please continue reading, as I assure you that getting the license for TE 3 will be one of your best investments if you are working with Power BI on a daily basis.
Tabular Editor 3 – The best tool for Power BI development!
I’m standing firmly behind the statement in the header above. In the remaining part of this article, I will share my top 6 features in TE 3, and why I believe that without using this tool, my Power BI development would be less efficient.
Features are not sorted by order of their importance, I’ve just listed them without any specific preference…
#1 Advanced Scripting
Well, I like Power BI, I really do. But, there are some default settings that annoy me. One of them is the fact that whenever you have a numeric column, Power BI will automatically apply summarization on top of it, as a default. Now, it may come quite handy when you have “real” numeric columns, but what if you have IDs as foreign keys to your dimension tables – a typical example would be the Date dimension table:

As you can see in the illustration above, Power BI automatically applied aggregations on the columns (in this example, it was Count), even if it is counterintuitive and non desirable way of displaying data from these columns.
However, if I connect to data model from TE 3, I have two options to solve this challenge:
- I can execute a following command to remove default summarization from the selected columns:
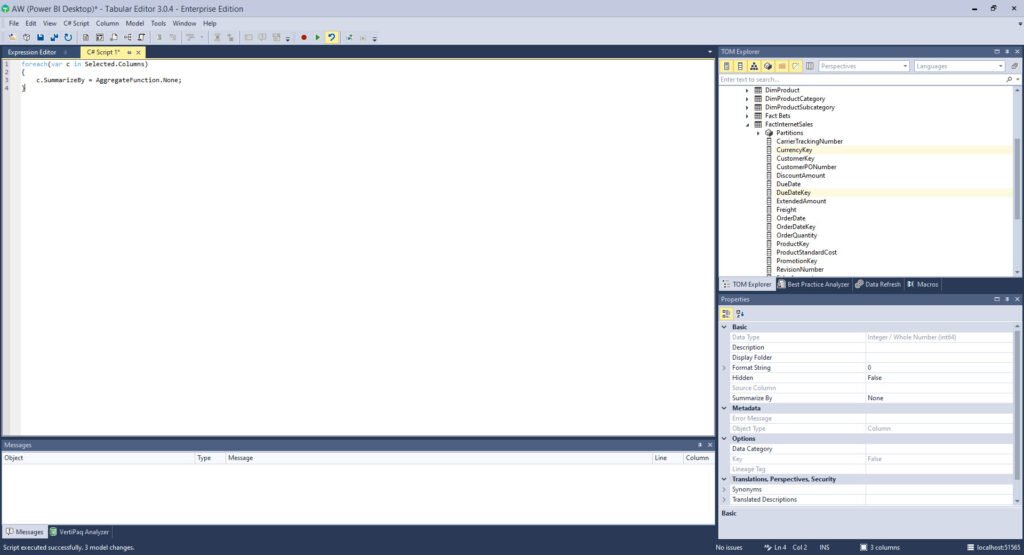
foreach(var c in Selected.Columns)
{
    c.SummarizeBy = AggregateFunction.None;
}
- I can execute a single command to remove default summarization from ALL the columns within my data model!
foreach(var c in Model.AllColumns)
{
    c.SummarizeBy = AggregateFunction.None;
}
How cool is that!
#2 Creating measures from selected columns
In one of the previous articles, I’ve explained why you should always create explicit instead of implicit measures. And, it’s not an issue when you are dealing with a simple data model and there is no need to create many measures. However, once your model becomes more complex, and you need to build multiple similar, but still different measures, the task of creating explicit measures becomes tedious.
Tabular Editor offers you an elegant way to automate this task, as you can choose multiple columns and create desired measures in one single run!
// Creates a SUM measure for every currently selected column and hide the column.
foreach(var c in Selected.Columns)
{
    var newMeasure = c.Table.AddMeasure(
        "Sum of " + c.Name,                    // Name
        "SUM(" + c.DaxObjectFullName + ")",    // DAX expression
        c.DisplayFolder                        // Display Folder
    );

    // Set the format string on the new measure:
    newMeasure.FormatString = "0.00";

    // Provide some documentation:
    newMeasure.Description = "This measure is the sum of column " + c.DaxObjectFullName;

    // Hide the base column:
    c.IsHidden = true;
}
This script will create basic SUM over all the columns you selected, format them properly, while at the same time ensuring the best practice recommendation to hide the original column from the data model!
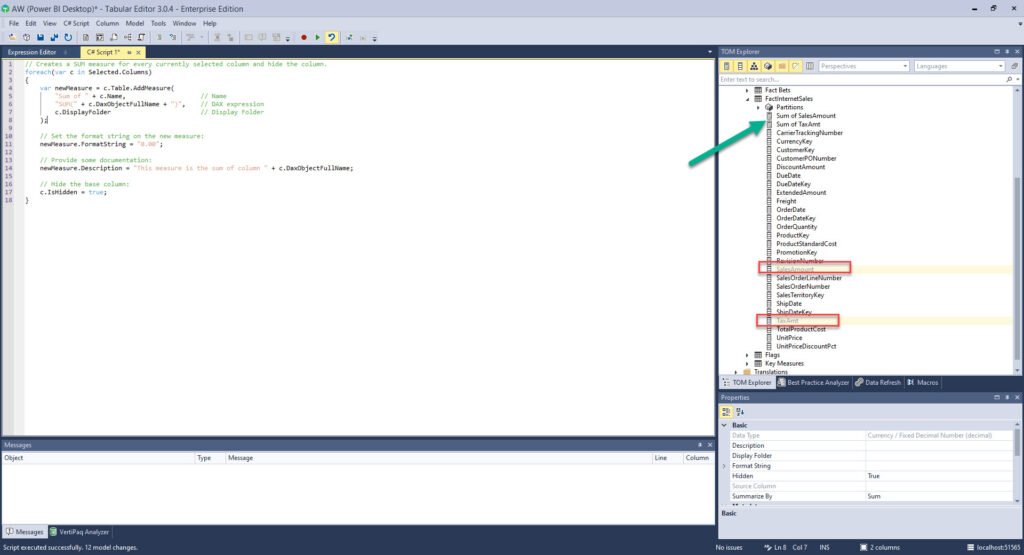
After I’ve executed the above script, you can notice that new measures were created, while the original columns became hidden.
There is a bunch of extremely useful code snippets to automate some of the most common tasks in Power BI report development, such as creating Time Intelligence calculations. You can find all of these snippets here.
#3 “If it’s not formatted, it’s not DAX…“
This is a legendary sentence from Alberto Ferrari! And, I bet you saw hundreds of times something like this:

Don’t get mad, we’ve all written our measures this way when we were Power BI newbies:)
Again, I’ll put just one single line of code to make all my DAX formulas properly formatted:
Model.AllMeasures.FormatDax();
This looks much better, right?
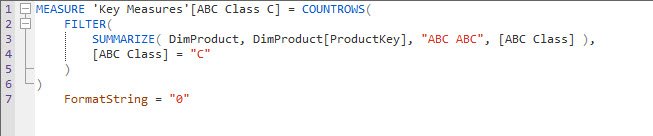
#4 DAX Scripting
This one also relates to DAX. Well, we all know how CALCULATE works and which arguments it accepts (at least, I hope that we all know). But, what happens when you need to use some of the DAX functions that are not “on the menu” so often. Exactly, it can happen that you forget the proper syntax and/or the way it works.
Here comes TE 3 to the rescue with its awesome DAX IntelliSense!
Once I start writing the function, not that TE 3 offers me to complete the function name, but it also “tells” me what the function does – in this case, I can see that COUNTROWS() will count the number of rows in the table. If that’s not enough, and I want to explore the function in more detail, I can click on the function link (the blue one in the illustration above), and I’ll be directly navigated to this formula reference at dax.guide:

How super cool is that!
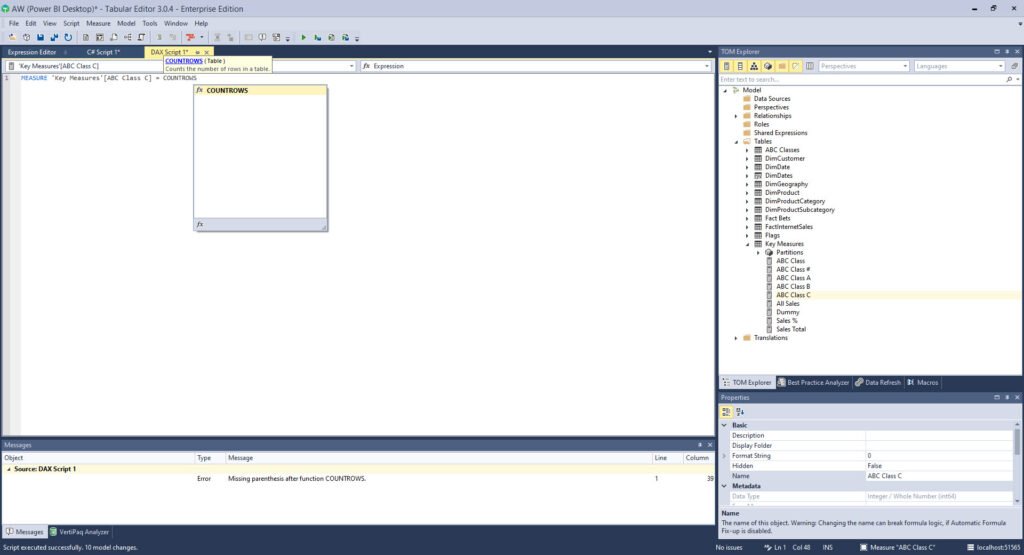
Here is one bonus tip related to DAX debugging. When you are debugging a complex DAX calculation, it can easily happen that the calculation contains not just one, but multiple different errors (sounds familiar, eh?). With a regular DAX editor, you can see your errors one by one, and solve them one by one. On the other side, TE 3 captures all the errors from your DAX “masterpiece”, stating the lines where the error was found, and the reason for throwing an error:
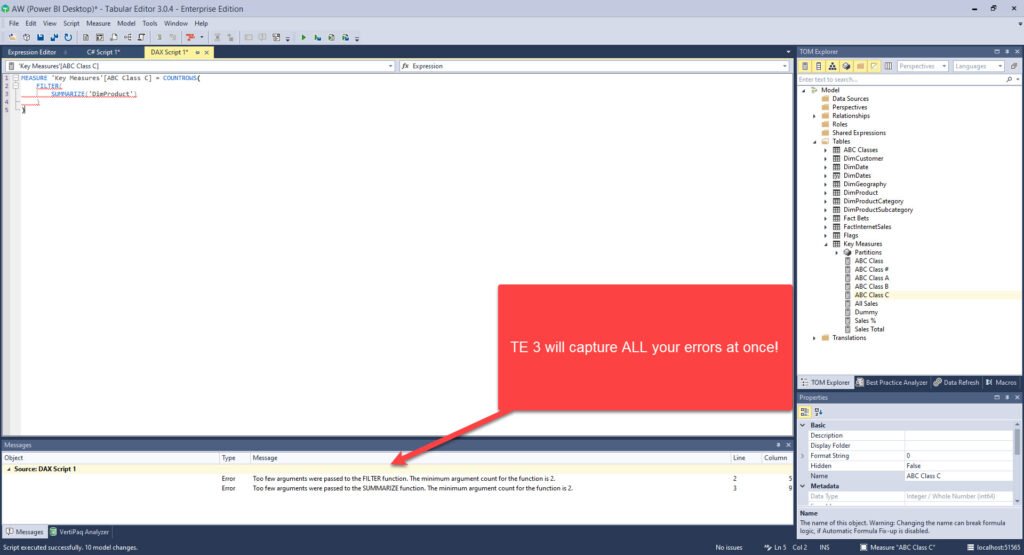
No need to say how this feature can help you debug your DAX code more efficiently.
#5 Data Preview
Don’t know about you, but I was “million” times in a situation that I want to quickly check the data from one of the tables in my data model. What did I do? Drag the Table visual to my report canvas, put some columns in it, and then analyzing what’s in there…
Now, with TE 3, I can do a thing simple as this:
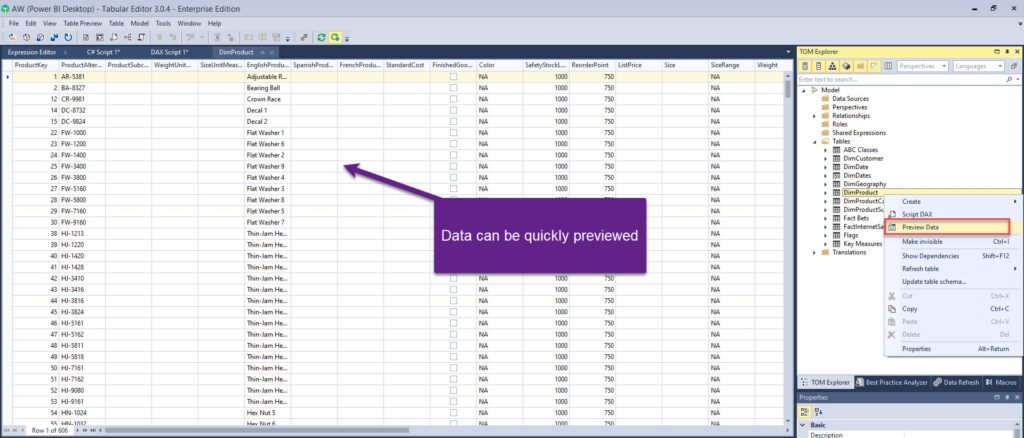
Just right-click on the table, choose Preview Data, and that’s it! You can immediately see what’s in there…
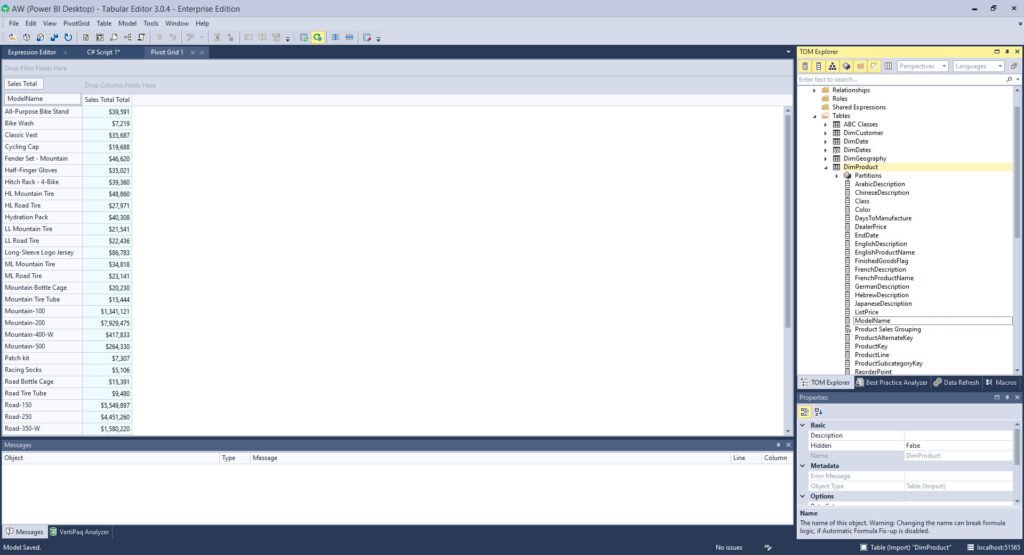
Similar to this, there is also a very cool feature called Pivot Grid, which resembles a Pivot Table from Excel. This way, you can quickly evaluate the results of your calculations.
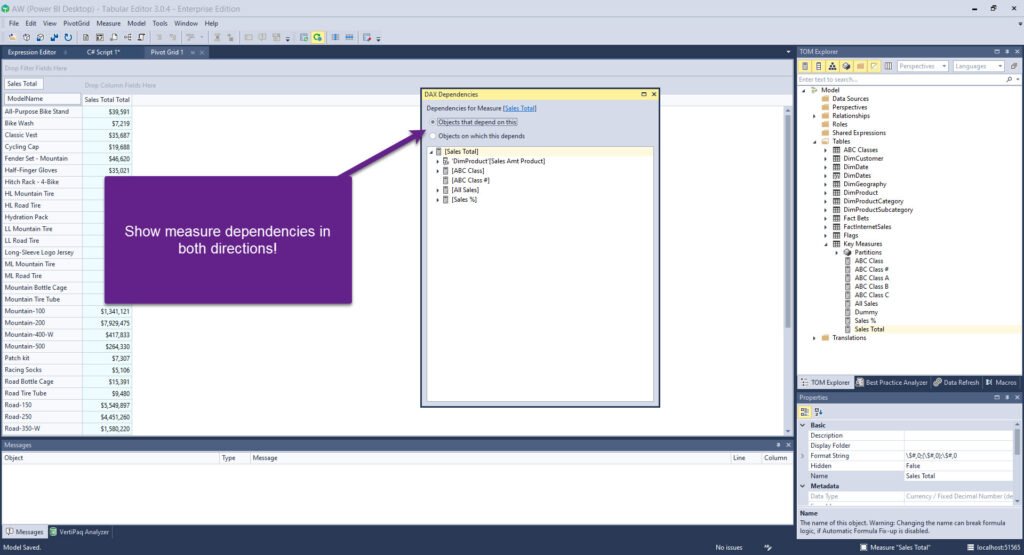
#6 Measure Dependencies
I find this one extremely useful for large models with many measures. In most scenarios, your measures will be “linked” between themselves, referencing one another. And, it would be extremely hard to determine the dependency between the measures in a model containing hundreds of them.
As you may assume, TE 3 offers solution for this challenge too…
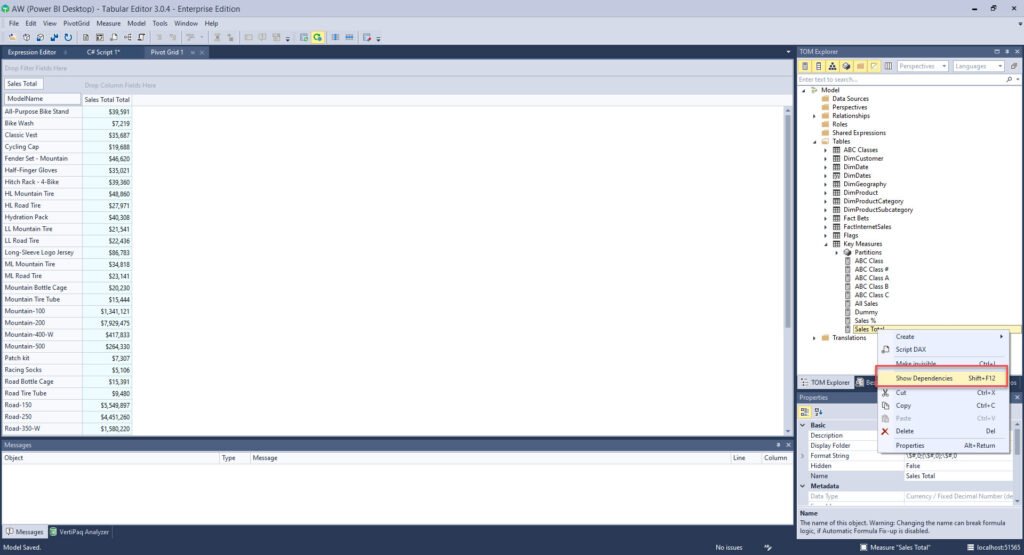
If you right-click on the measure, and select Show Dependencies, you can see which measures are dependent on the selected measure, but also on which objects your selected measure depends on:
Conclusion
This was just a short list of the features that Tabular Editor 3 offers to support your Power BI development. There are a whole lot more advanced capabilities in TE 3, such as Recording Macro, customizing and saving Workspace, or including Best Practice Analyzer tool. Not to mention that some of the extremely important features, like Calculation Groups or Object Level Security, are not even possible to perform from Power BI Desktop, but from TE only!
And, yes, there is a dark mode too:)
On a serious note – if you consider yourself as a Power BI professional, and you truly want to boost your Power BI development, this is a “must-have” tool under your belt.
If you are interested to learn more about the Tabular Editor 3 features, or even better to download it and start working with it, you can refer to the official TE 3 page.
Thanks for reading!
Last Updated on June 8, 2021 by Nikola


taras koniukhov
Thanks Nikola for sharing, very inspiring!
Nikola
You’re welcome Taras!
Steffen
Hello Nikola,
very cool tips! I tried #3. Do you know also a script for formating calculated columns?
Thank you
Steffen