
How many times did you find yourself in the following situation? When you open the report for the first time, it takes a while to render, but once you go back and forth from other report pages, that same page renders significantly faster!
Yeah, I know, we’ve all been there multiple times. That’s happening because Power BI caches the data and can respond much faster after that first initial run.
Sounds easy, right? Well, it’s not just simple as that and this article will try to demystify different cache types in Power BI.
Recommended reading before the start: Since I’ll be referring to some of the Power BI internal architecture components, namely Storage Engine and Formula Engine, I suggest you first read this article to understand the difference between the two. You should also understand the different roles that these two engines perform in the process of data retrieval. This is of paramount importance, because the rest of this article will assume that you are aware of the key characteristics of both Storage and Formula engine.
Cache types in a nutshell
Let’s kick it off by explaining two main cache types from a high-level perspective, and then we’ll dig deeper to explain nuances for each of these types.
Visual cache in Power BI
Let’s start with a very simple example. I’ll be using a sample Contoso database for all of the demos.
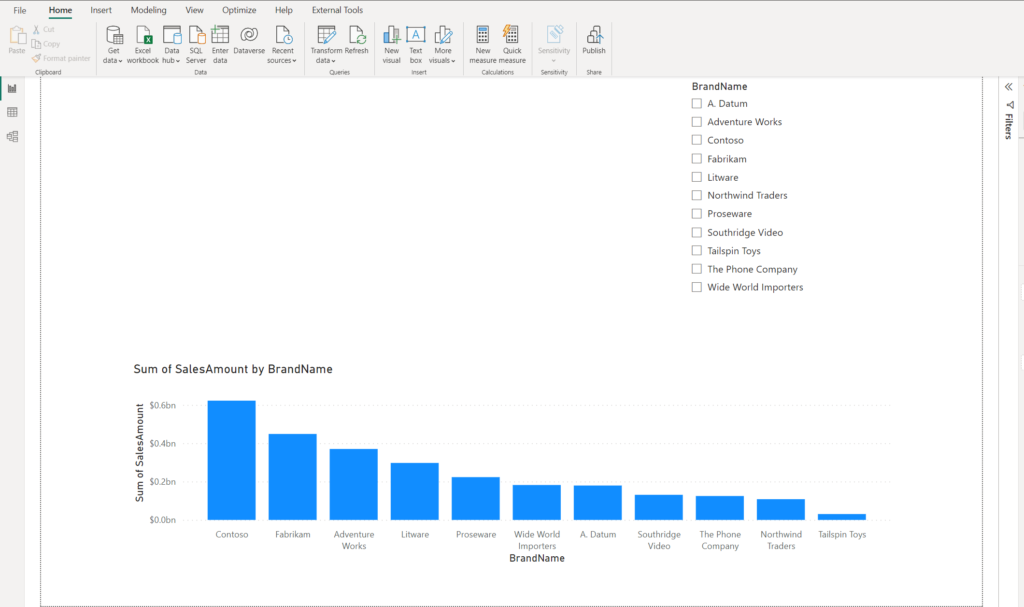
I have one clustered column chart visual, showing the total sales amount for each brand that exists in the Contoso database. There is also a slicer for a brand name. Let’s turn on Performance Analyzer in Power BI Desktop, and choose one of the values in the slicer:
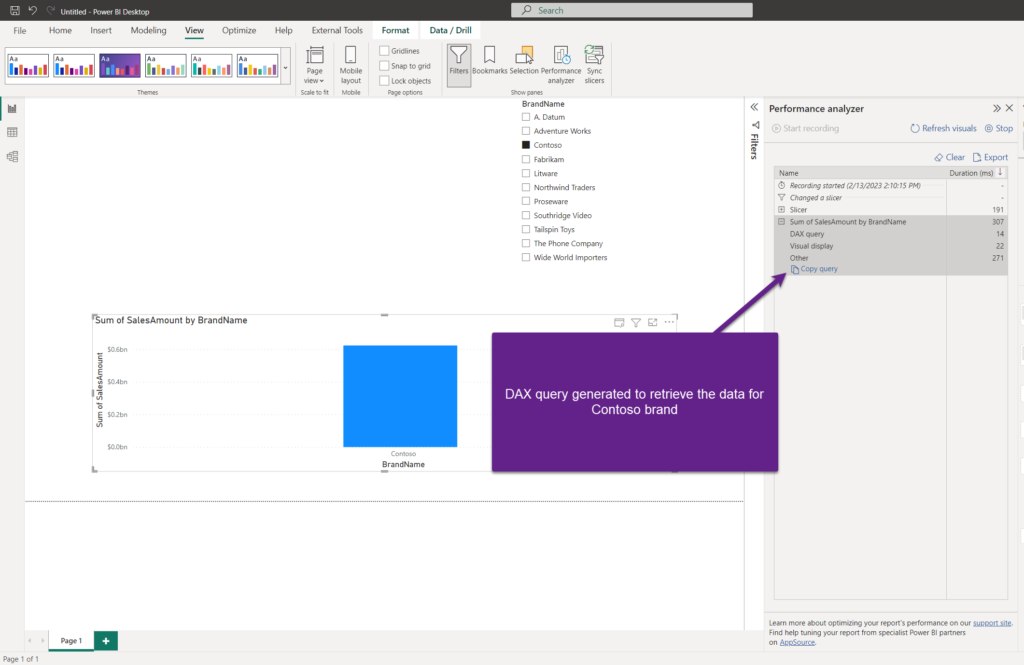
As you may notice, a Formula Engine generated a DAX query to retrieve the data about Contoso brand sales, and Storage Engine needed 14ms to physically return that data. Since we are using an Import storage mode and I’m in the Power BI Desktop, the data is stored in the local instance of the Analysis Services.
Let’s now change the slicer value to Litware:
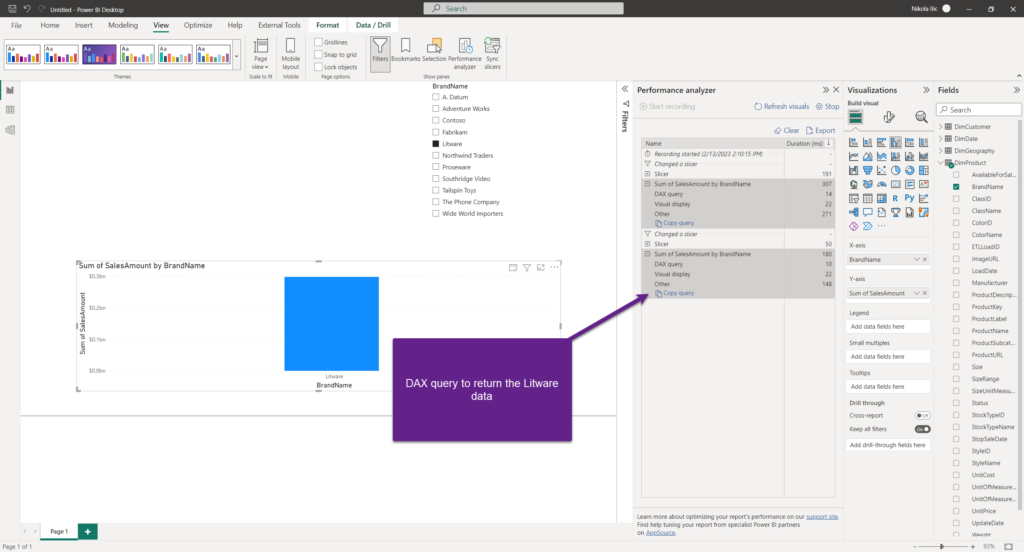
Again, the same workflow occurred as in the previous case. Now, what happens if I switch back to Contoso in my slicer?

Things become interesting now! There is no DAX query at all and Copy query option, that enables us to grab the query and analyze it in more detail in, let’s say, DAX Studio – is greyed out! That means, there was no query generated by the Formula engine, and the data for this visual was served from the cache. In this case, we’re talking about the visual cache.
The same will happen if I again select Litware in the slicer. However, once I click on the Refresh visuals option at the top…

Despite retrieving the data for Contoso again, in this case, the visual cache was cleared and the Formula engine generated a DAX query once more.
Obviously, in this super basic example, it’s not easy to spot a significant difference in performance between the two scenarios. But, in reality, we usually apply more complex logic, and retrieving query results from the cache is usually dramatically faster than running the same query over and over again.
If I now connect to my Analysis Services local instance from DAX Studio, and turn on All Queries, once I hit Refresh visuals, all the queries will be captured by DAX Studio:

From here, I’ll double-click the first query and execute it within the DAX Studio:
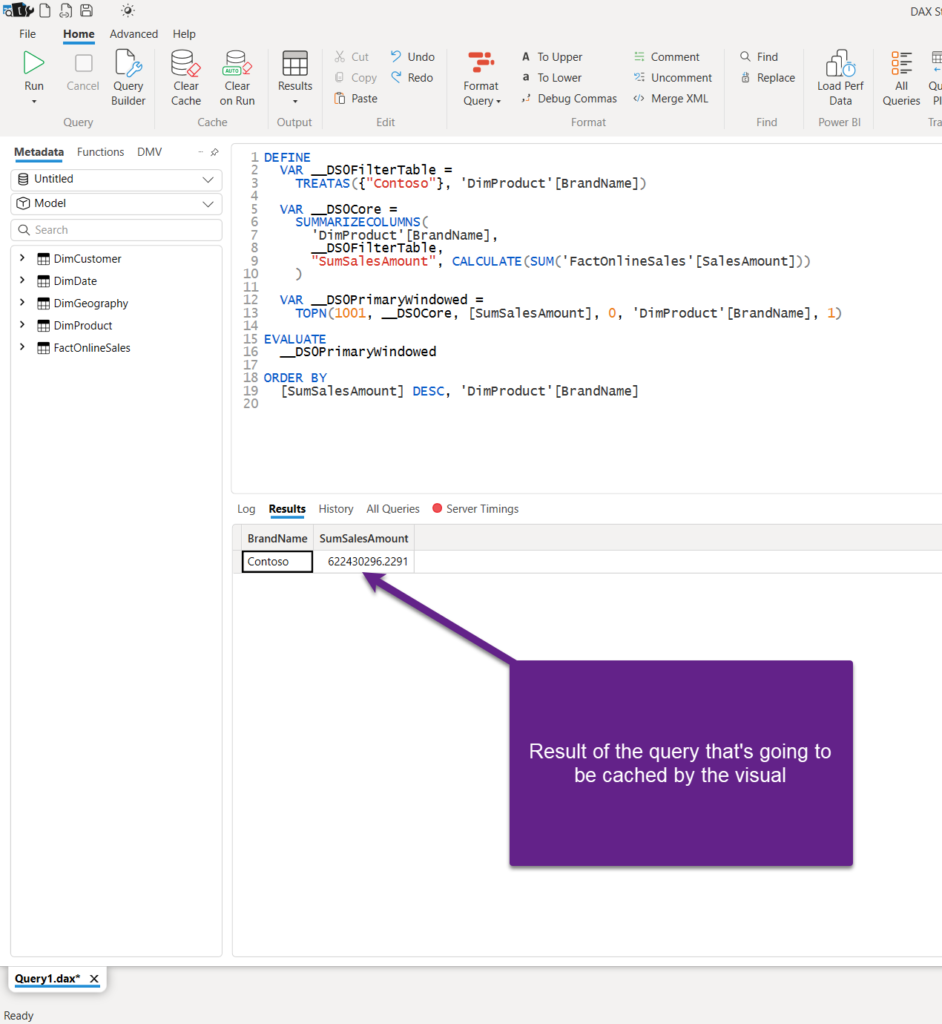
This table, which contains query results, will be cached by the report. And, whenever our visual asks for the same result, the data can be served from the cache.
What about Power BI Service?
Ok, in the example above, we explained how Power BI will cache query results when working with Power BI Desktop, in the local instance of Analysis Services. The legitimate question would be: what happens once we move to Power BI Service? Does this cache “thingy” still work?
The answer is – YES! In this case, it’s done using your web browser. However, keep in mind that the visual cache has a scope of the specific Power BI session. We’ll come later to explain in more detail how this works.
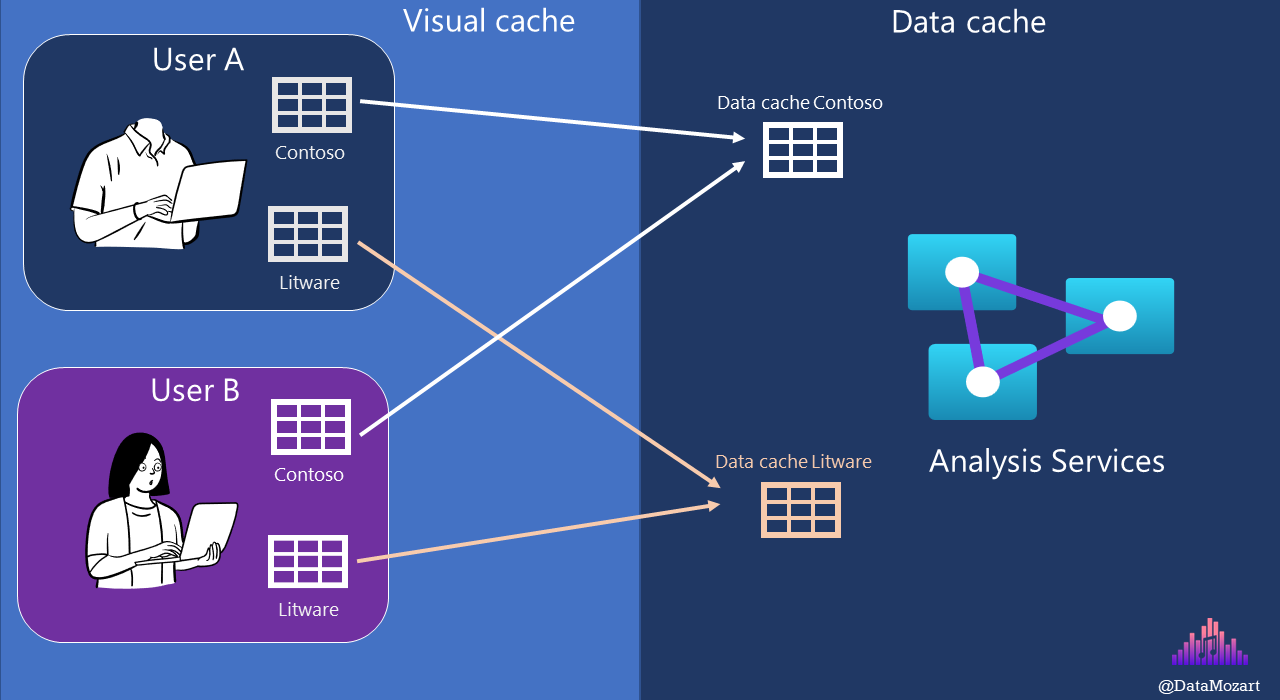
Data cache in Power BI
The data cache is another cache type in Power BI. Unlike in the previous scenario, where caching occurs on the level of the individual report user, data cache operates on a more generic level – the level of the Analysis Services tabular model.
If you did your homework and read the articles I suggested at the beginning, you’re probably aware that VertiPaq stores our Contoso data in-memory, in a compressed way.
So, what exactly happens when we asked Power BI to calculate the total sales amount for the Contoso brand? Formula Engine generates and executes a DAX query, but then Storage Engine translates DAX to a special SQL-like language, called xmSQL, to physically pull the data from the tabular model.
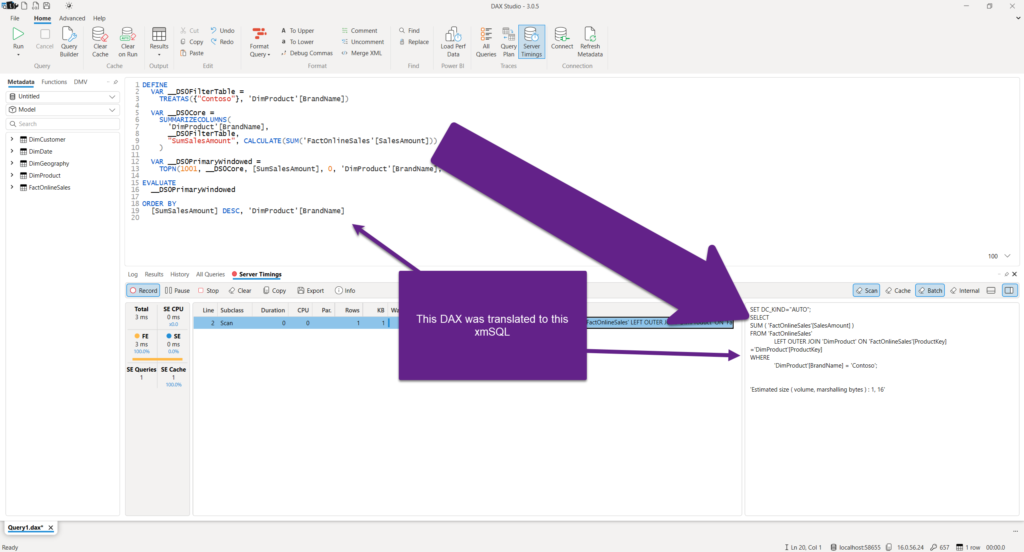
For every xmSQL query, there is a special data structure, called datacache that’s being stored in-memory.
If I turn on Server Timings in DAX Studio and run the DAX query captured in the previous example:

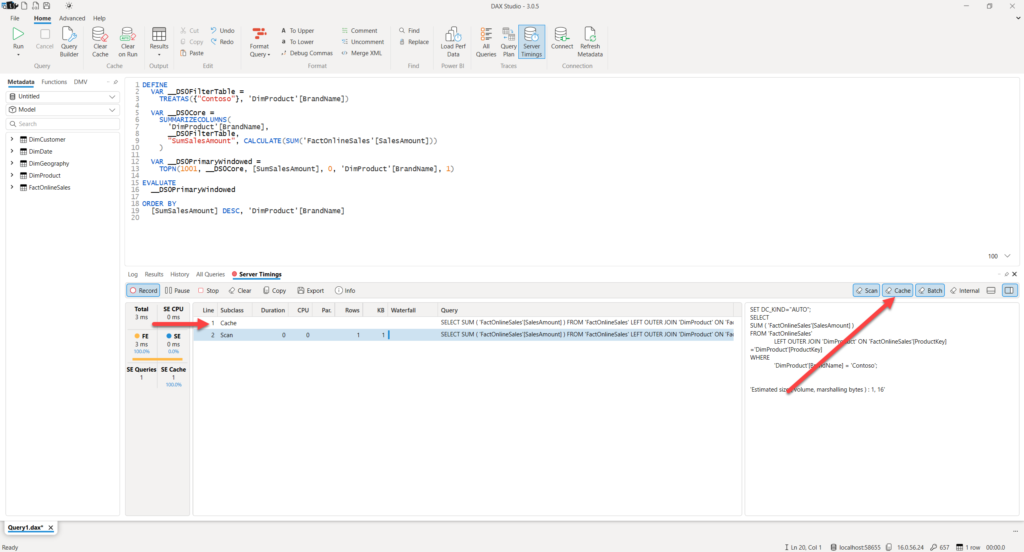
As you may notice, the query results were retrieved from the cache (we have one Storage Engine query, and that one Storage Engine query was using a cache). This means, in reality, we didn’t really query the Analysis Services model. To confirm that this is happening, I’ll turn on the Cache tab in the DAX Studio, and you’ll see on line 1 that this query was actually served from the cache, and not from the internal data structures of the Analysis Services.
Watch out! Things to keep in mind regarding the data cache
Now, there are at least two important considerations to keep in mind regarding the data cache.
First, it MAY trick you to think that your query is running fast, although it might not be true. Let’s say that you are troubleshooting a poorly performing query and you leverage DAX Studio to get more insight into what is happening in the background. You run the query for the first time, and it required 2000 ms to return the results.
You then apply some minor changes and you run the query again – now it renders in 100 ms. Yaaay! You’ve already started thinking: “Well, why everyone says that DAX is hard? I’ve just reordered the lines in my code and it works 20x faster…”
Yeah, right! The next morning, a report user complains again that the same report visual renders slow.
You probably forgot to clear the data cache BEFORE running the “improved” version of the DAX calculation.
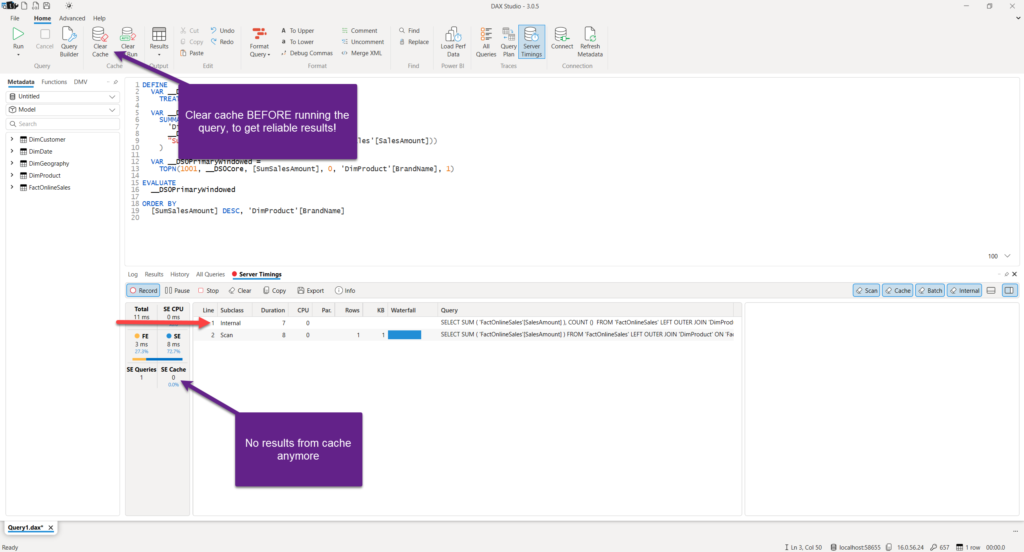
Even on this immensely simple calculation, the scenario with the result set coming from the cache was almost 4x faster than the one querying internal data structures of the Analysis Services (please, pay attention to line 1 which contains Internal as a subclass).
Second, as the data cache resides in-memory, this means that it does have limited resources. To put it simple, not all queries can be cached within the Analysis Services! Depending on the amount of data retrieved by the query, it may happen that only a portion (or none) of Storage Engine queries can be retrieved from the cache.
Let me show you how this looks in reality. I’ve added some more ingredients to my Power BI report. Let’s say that I want to calculate how many distinct orders we had in each of the years. I’ve created a simple DAX measure to calculate this:
Distinct Orders = DISTINCTCOUNT(FactOnlineSales[SalesOrderNumber])
Next, I want to compare this value with the value from the previous year, so I’ll go and create another measure to calculate the number of distinct orders from the previous year:
Distinct Orders PY = CALCULATE(
                            [Distinct Orders],
                            SAMEPERIODLASTYEAR(DimDate[Datekey])
)
Let’s switch to DAX Studio and check the query generated to populate the data for this visual:
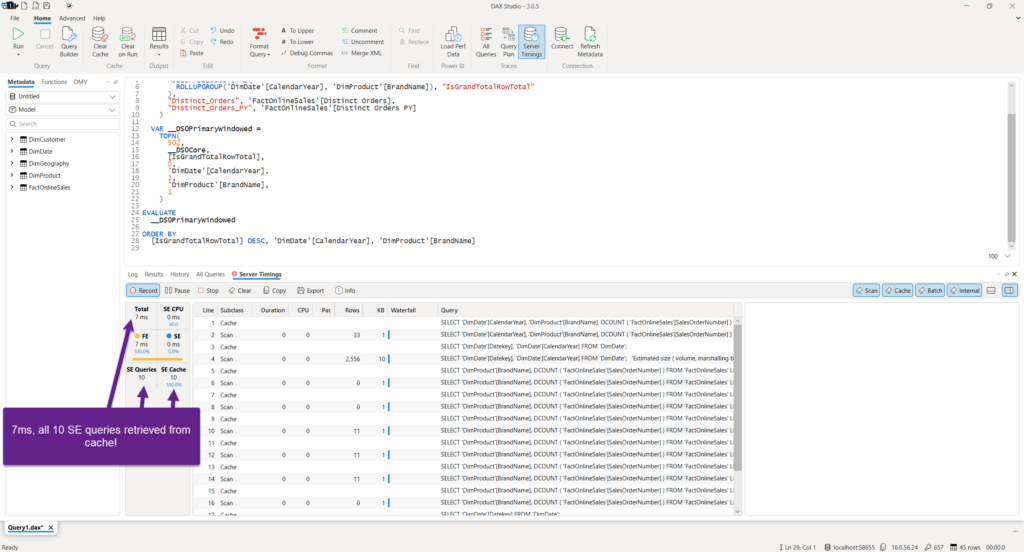
Since I didn’t clear the data cache before running this query, all 10 Storage Engine queries were retrieved from the cache! In total, results were returned in 7ms.
I’ll now clear the cache and re-run the same query:

Instead of 7ms, we now have more than 1 second! That’s why I told you that it is of key importance to clear the data cache before running the same query.
Let’s now check what happens if we include individual dates in the scope, instead of years:
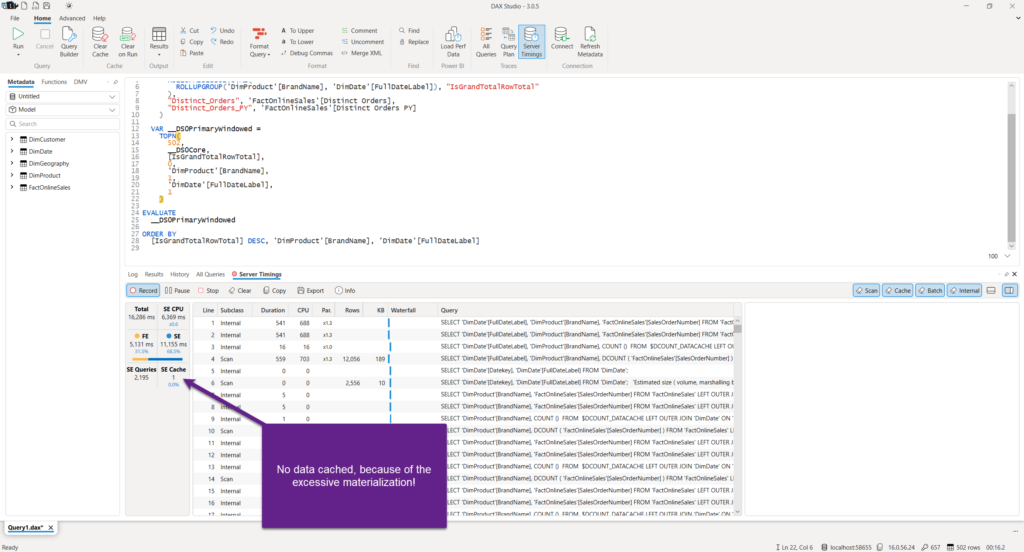
Without clearing the cache, this query took more than 16 seconds to return results!
To briefly explain what is happening here: when the query executes, Storage Engine retrieves the data and materializes intermediate query results in a special structure called datacache. This datacache is finally consumed by the Formula Engine before the final result set goes back to the report. Now, depending on many different things, sometimes all the necessary data can be materialized within one datacache, but sometimes it may happen that there is simply too much data to be scanned and materialized, so Storage Engine creates multiple datacaches.
In our example, we can see that each of these queries is very fast – only a few milliseconds – but there are a lot of them. To be entirely precise: 2195 queries!
Now, what happens if there is not so much data to be materialized. Can we “help” the engine to leverage the data cache feature again?
I’ll add a date slicer to my report and include only dates after January 1st 2010:

Let’s see what DAX Studio Server Timings displays now:

Obviously, the query runs faster, as the engine has to deal with a lower number of datacaches. But, we’re still not able to leverage the data cache.
Let’s now include only the dates after October 1st 2010 and check the query in DAX Studio:
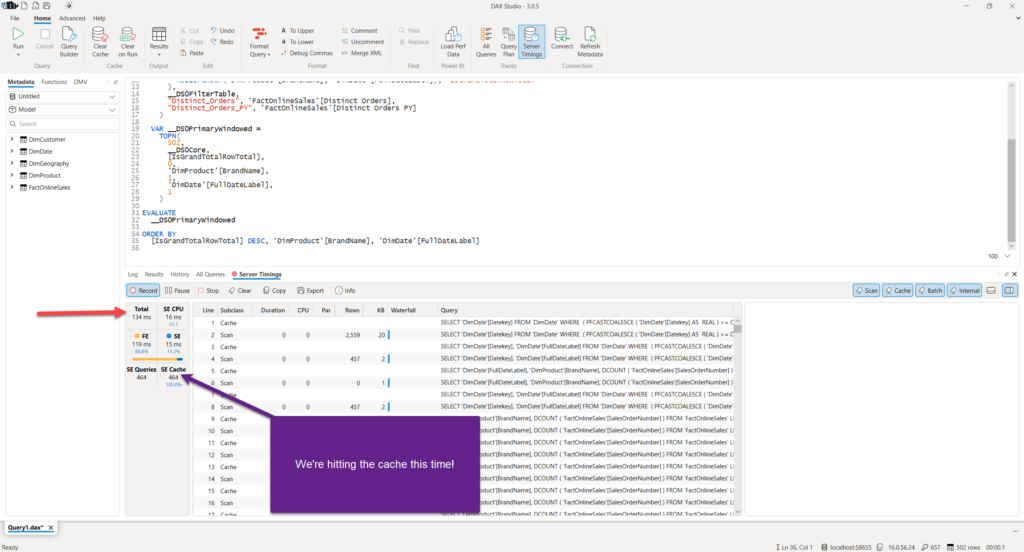
This time, we’re hitting the cache and the difference is huuuuuge! This query took only 134ms to return results.
To conclude, from the perspective of the data cache, it’s extremely important how much data your queries scan and materialize.
Conclusion
Caching query results is one of the key performance optimization concepts, not exclusively related to Power BI and tabular model, but in general.
When we’re examining Power BI cache types, you should be aware of two different caches:
- Visual cache (or report cache) – data is cached in the scope of the specific Power BI session, nevertheless, if we are talking about the session in the Power BI Desktop on the local machine, or session in Power BI Service
- Data cache – data is cached in the scope of the Analysis Services instance, nevertheless of the number of opened Power BI sessions
Thanks for reading!
Last Updated on February 13, 2023 by Nikola


