

Recently, a friend of mine, came across with interesting request he got from his client. They needed to see values for the specified period in the past, based on dates selection.
For example, if they select March 31st 2020, they need to see values for previous 12 months, so starting from April 1st 2019. Additionally, they need an option to choose specific date and see values from the beginning of the year for selected date. Again, if they select March 31st 2020, they need to see values starting from January 1st 2020. Visuals would be adjusted to dynamically change based on user selection.
That being said, Edit Interactions, as a way to remove filter from specific visual, was not an option, since it would completely deny user from selecting any specific value for filtering.
Tricky part
Trickiest thing here is establishing proper relationship between Date dimension and fact table. Because, if you rely on “normal” relationship between Date dimension and fact table, data will be filtered based on dates selection which serves as a relationship between these two tables.
Let’s head over to Power BI Desktop and see if something can be done.
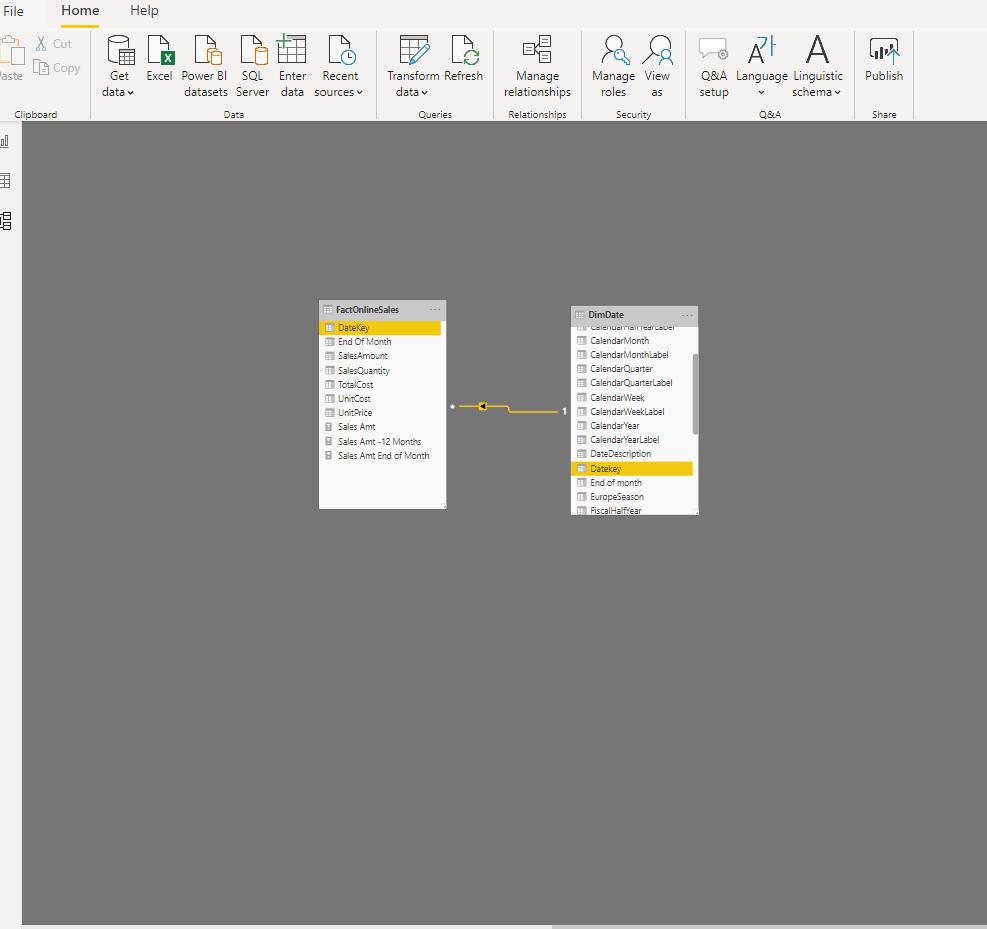
As you see in the Model view above, DimDate and FactOnlineSales are connected with DateKey column. So, as long as I’m selecting dates in the slicer, my bar chart shows only those values filtered by slicer selection, as you see in following screenshot.
Main question here is: how can we “override” values passed from Date slicer.
Key to solution
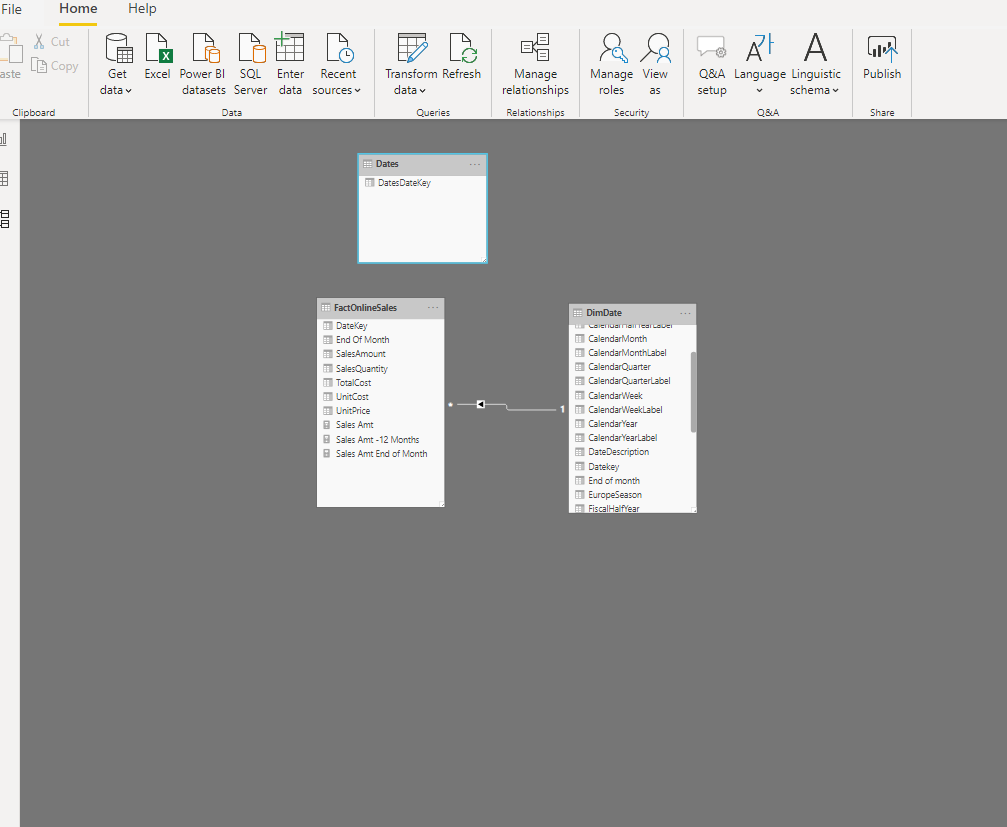
Key thing here is to disconnect “regular” relationship between Date dimension and fact table. We need independent, disconnected Dates table, which will serve to define time frame we need for displaying values in bar chart visual.
Therefore, I will create new table with following definition:
Dates = DISTINCT(FactOnlineSales[DateKey])
This will include all the dates from our fact table. This table stays disconnected from our fact table, as you can see in the Model view:
Now, let’s create a new measure, which will calculate sales amount within dates we specify:
Sales Amt =
         VAR MaxDate = MAX(Dates[DatesDateKey])
         VAR MinDate = CALCULATE(MIN(Dates[DatesDateKey]),
                                ALLEXCEPT(Dates,Dates[DatesDateKey])
                                )
            VAR SalesAmt = CALCULATE(SUM(FactOnlineSales[SalesAmount]),
                              FILTER(FactOnlineSales,FactOnlineSales[DateKey] >= MinDate && FactOnlineSales[DateKey] <= MaxDate))
            RETURN
            SalesAmt
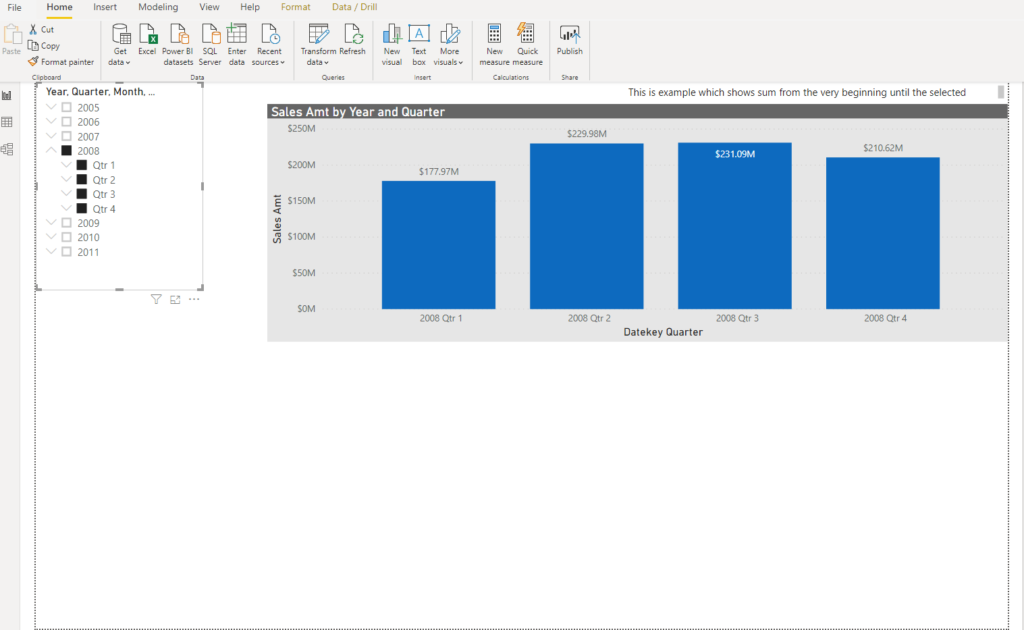
What we are basically doing here is following: we are defining variable which will select last selected date (MaxDate). Then, we are defining our starting point: in this case, it will find first date in Dates table, overriding existing filter context with ALLEXCEPT function. Finally, we are calculating SalesAmt value using FILTER function, in order to limit time frame based on dates set in variables. After we drag new measure to bar chart visual, we are getting following result:

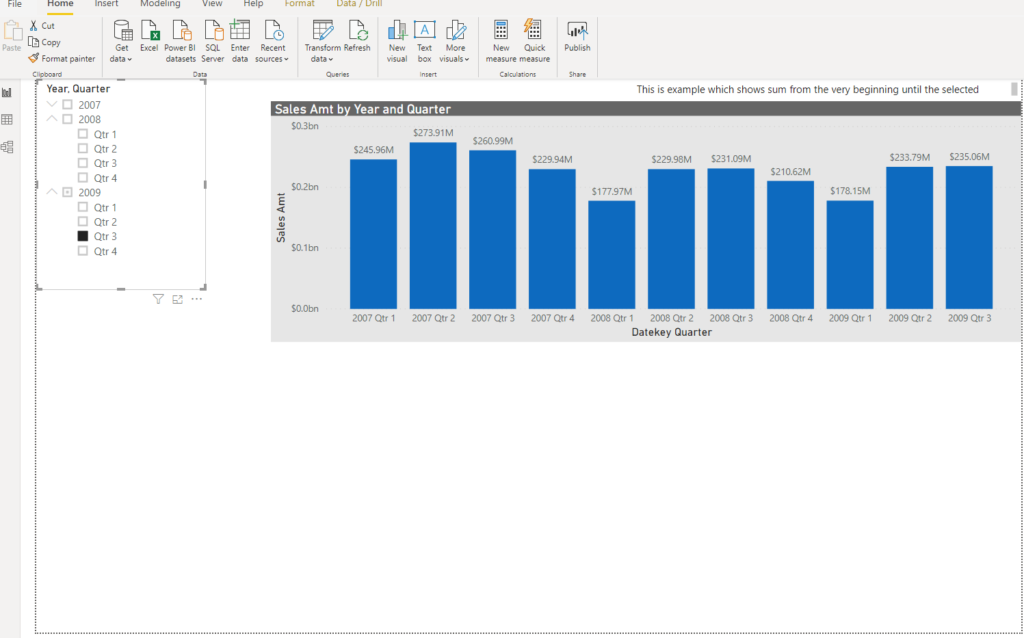
So, if I select quarter 4 of 2008 year, I will see all values from the beginning (first date value in our fact table), up until selected period. If I had selected quarter 3 of 2009, I would have got following values:
Pretty cool, ha?
Fine Tuning our solution
However, what if we need to see only those values since the beginning of the year for the date selected, or 12 months prior to selected date.
Disconnected table stays in place, because, don’t forget, it is the key ingredient to solve this. We will just slightly change our measure for calculating Sales Amt.
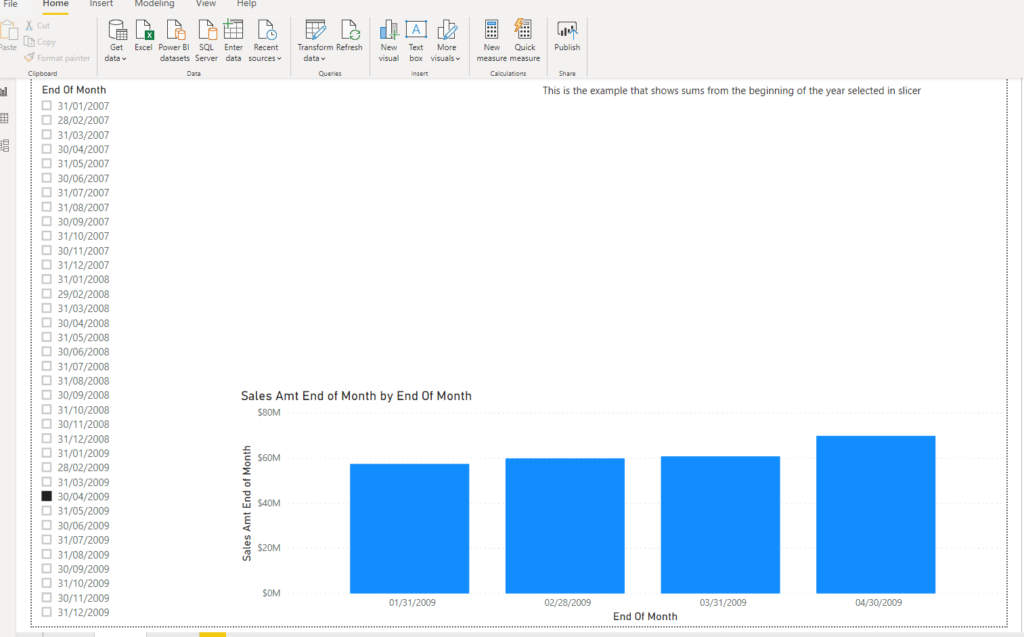
If you want to see all values from the beginning of the year, you can adjust measure like this:
Sales Amt StartYear =
        VAR MaxDate = MAX('Dates'[DatesDateKey])
        VAR MinDate = STARTOFYEAR('Dates'[DatesDateKey])
        VAR Result = CALCULATE(
                            SUM(FactOnlineSales[SalesAmount]),
                            FILTER(FactOnlineSales,
                                FactOnlineSales[DateKey] >=MinDate && FactOnlineSales[DateKey]<=MaxDate)
        )
        RETURN
        Result
So, the only difference is in MinDate variable definition. Here, we use DAX function STARTOFYEAR to get first date of the year for the date which was selected.
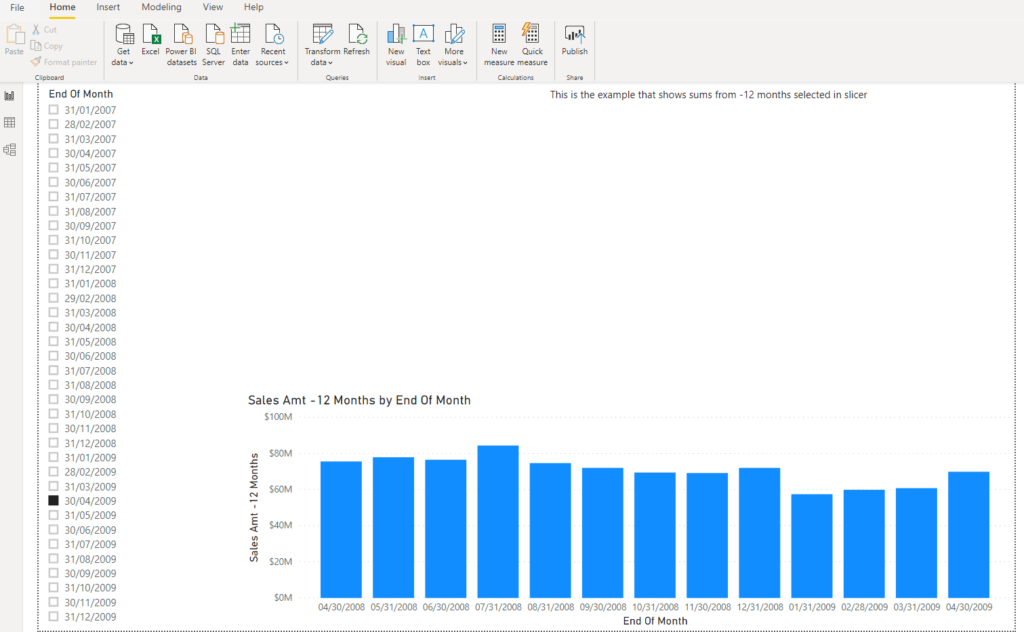
Other option enables you to see trailing periods you define based on your needs: following example shows last 12 months, but you can easily modify this:
Sales Amt -12 Months =
        VAR MaxDate = MAX('Dates'[DatesDateKey])
        VAR MinDate = DATE(YEAR(MaxDate),MONTH(MaxDate)-12,DAY(MaxDate))
        VAR Result = CALCULATE(
                            SUM(FactOnlineSales[SalesAmount]),
                            FILTER(FactOnlineSales,
                                FactOnlineSales[DateKey] >=MinDate && FactOnlineSales[DateKey]<=MaxDate)
        )
        RETURN
        Result
Again, the only difference is in starting point definition. With combination of DATE and MONTH functions, we are telling our measure how far in the past we want to calculate. In this case it’s -12 months, but you can also use years, quarters, days as criteria.
Conclusion
As you saw, we can override regular behavior of filters using some non-standard techniques, like creating custom disconnected tables.
Last Updated on April 29, 2020 by Nikola


Paritosh
You don’t need a disconnected table. I measure changing the filter context would be sufficient.
Something like sameperiodlastyear method.
Nikola
Thanks for your comment Paritosh. As for almost any problem, there are multiple different solutions, and disconnected table is just one of them:)