This article is the part of the series related to mastering DP-500 certification exam: Designing and Implementing Enterprise-Scale Analytics Solutions Using Microsoft Azure and Microsoft Power BI
Table of contents
One of the main strengths of Power BI is not the tool itself (or, maybe it’s more precise to say TOOLS), but the possibility to extend beyond the “standard” set of provided functionalities. And, it’s not just about using external tools to take advantage of some of the advanced data modeling features, but also external technologies that exist outside of the Power BI ecosystem independently, but can be leveraged with Power BI to offer even more power!
If you’re coming from the statistics or data science world, you’ve probably already heard about two mainstream programming languages in these areas – R and Python. And, while the ongoing debate on R vs Python in many aspects reminds us of the debate on Power BI vs Tableau, and which tool is more powerful, I’ll leave this debate to others.
For the scope of this article, it’s important to keep in mind that you can enrich your Power BI reports with both R and Python visualizations!
Why R and Python?
Power BI offers a whole range of different visual types to satisfy all (or almost all) business reporting needs, that one would wonder: why on Earth do I need to use R and/or Python in addition?! That’s a fair question!
First of all, there are certain scenarios where you need to perform more advanced data analysis, beyond the built-in capabilities of Power BI. Don’t forget, both R and Python are well-established full programming languages, that offer a myriad of libraries to support more advanced data manipulation and data analysis approach.
Next, maybe your organization has already developed a lot of solutions using R/Python, so the natural extension would be to incorporate these solutions into the Power BI ecosystem.
Finally, it can happen that most of the data analysts in your organization are proficient in R/Python, so why bother them with learning the ins and outs of the Power Query, if they can prepare and manipulate the data using the language they already know?
How to use R and Python in Power BI?
R and Python are not something that comes out-of-the-box once you start developing your Power BI solution. To be able to use them, you first need to install the language and its relevant packages on the same computer where Power BI is. If we’re talking about R, tidyverse collection of data science related packages is recommended, while for Python, you should have pandas and matplotlib libraries installed, so you can handle data frames as the main data structure, and Python visuals.
In this article, we’ll cover Python-related scenarios, but the majority of the steps and prerequisites apply to R as well.
Using Python script as a data source
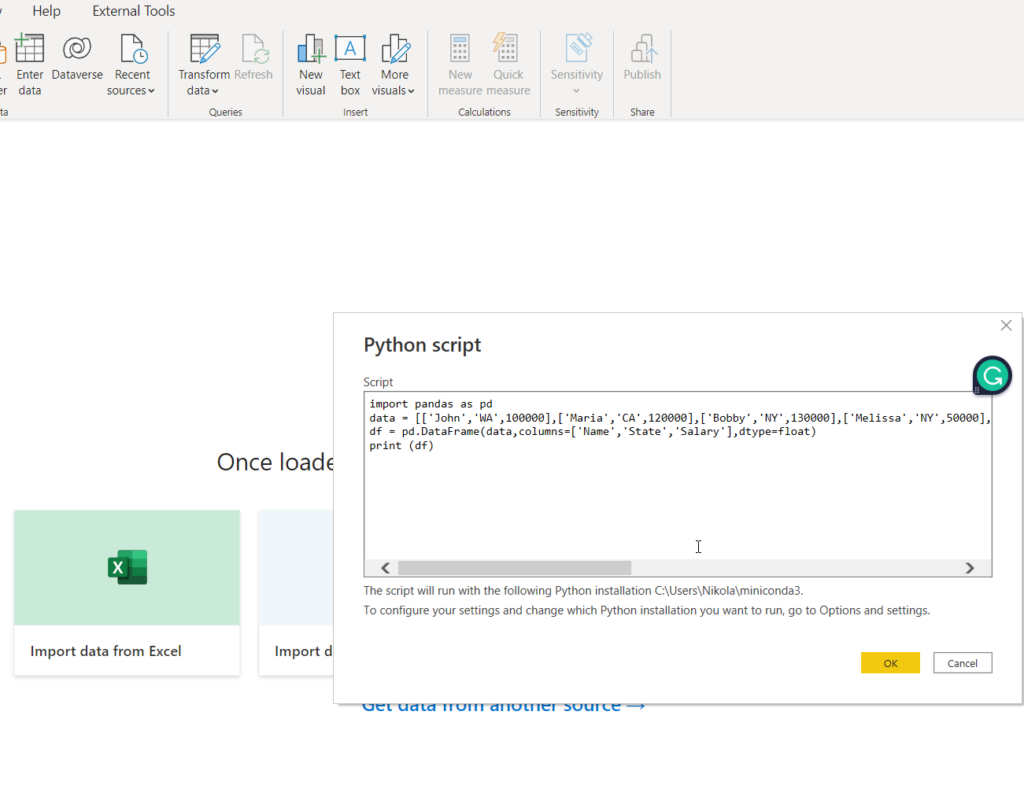
Once I installed all the necessary prerequisites, as described here, I’m ready to run my first Python script in Power BI Desktop! This script will generate a data frame, a 2-dimensional data structure similar to a table, containing data about the name, states, and salaries of various people.
import pandas as pd
data = [['John','WA',100000],['Maria','CA',120000],['Bobby','NY',130000],['Melissa','NY',50000],['Marie','NY',80000],['Oliver','CA',60000],['Paul','CA',40000],['Josephine','WA',90000],['Michael','WA',75000],['Debbie','NY',85000]]
df = pd.DataFrame(data,columns=['Name','State','Salary'],dtype=float)
print (df)
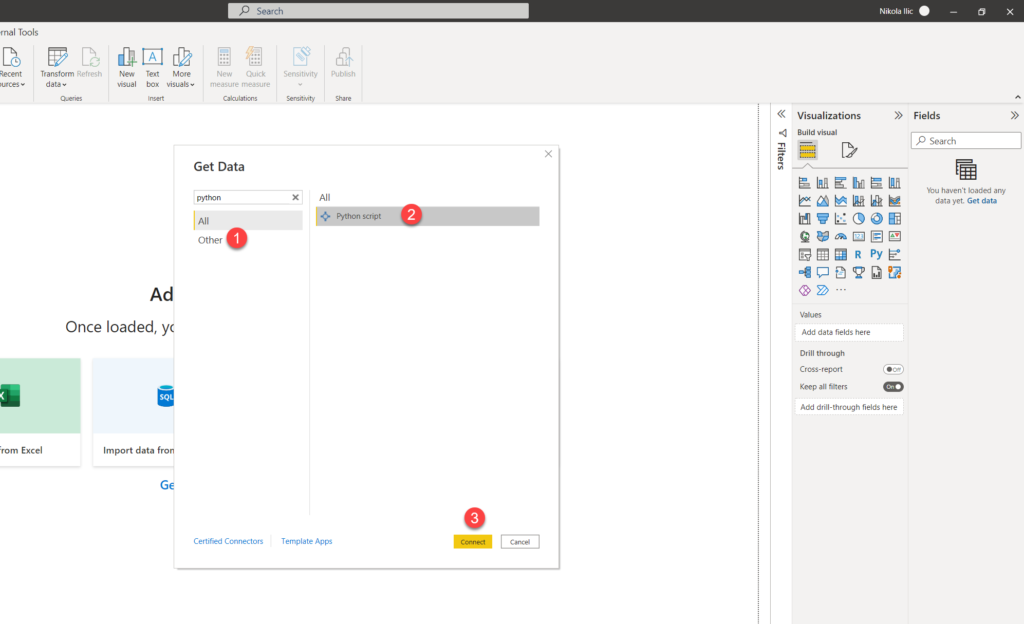
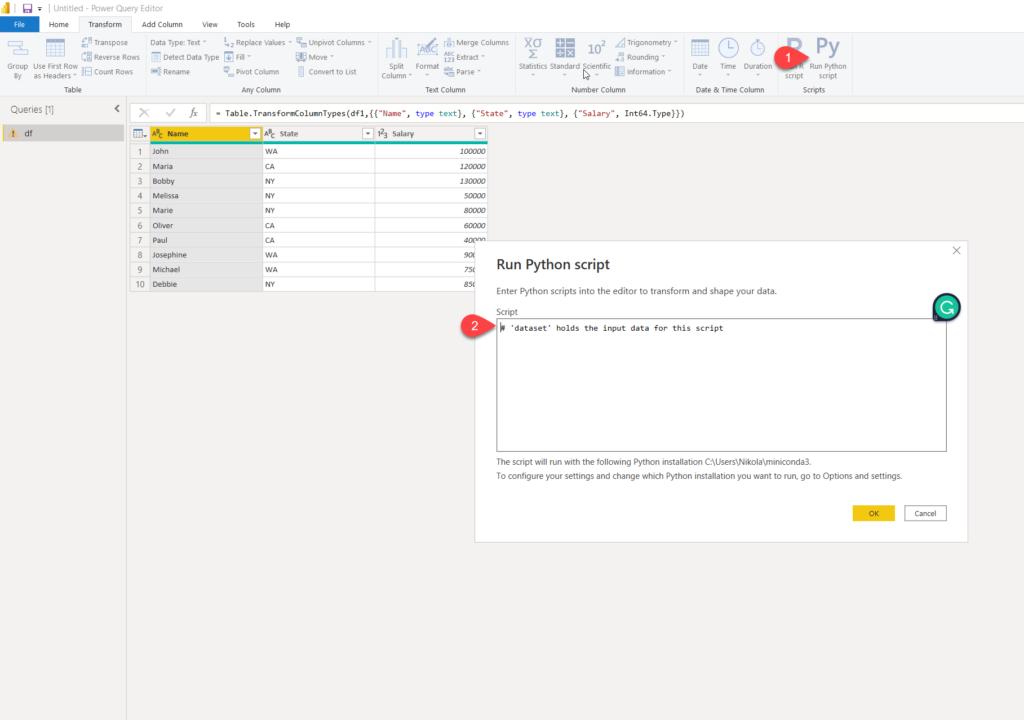
I’ll go to Get Data and choose Python script as a data source:
Once prompted, I’ll paste my Python script in the window:
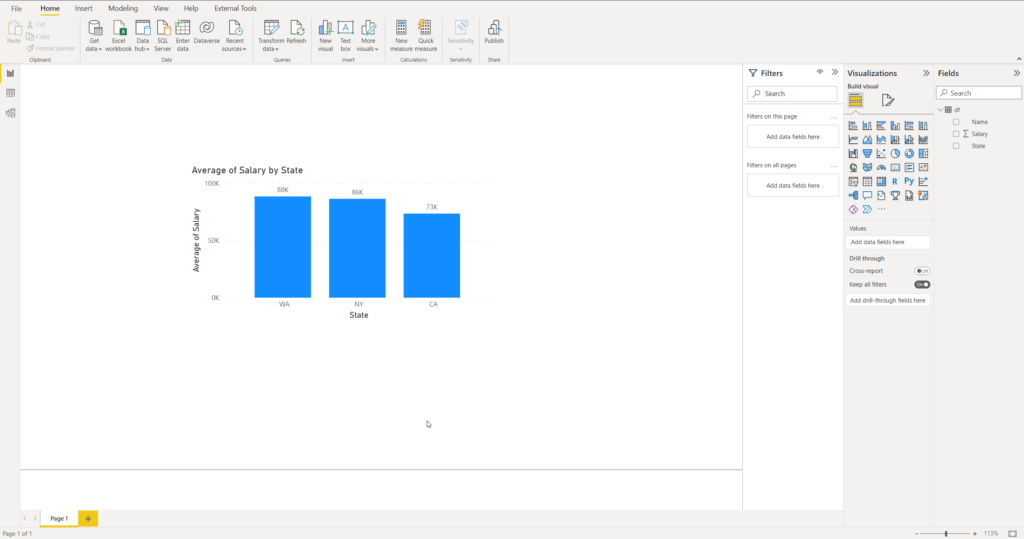
And, I can now use this data as a “regular” data source in Power BI and build visualizations like I’d build them using, let’s say, an Excel file or SQL table:
Using Python script in Power Query
You can also take advantage of the Python features in the Power Query editor. You can find here the step-by-step tutorial on how to fill the missing values in the column using Python code:
However, there are certain limitations when using Python scripts created in the Power Query:
- All Python data source settings and all steps defined in Power Query Editor must be set to Public
- To enable scheduled refresh of your Python visuals or dataset, you must have a Personal Gateway installed on the machine where your workbook and Python installation are installed
Using Python visual in Power BI
Finally, the third option when dealing with Python in Power BI is to leverage a special, Python visual type!
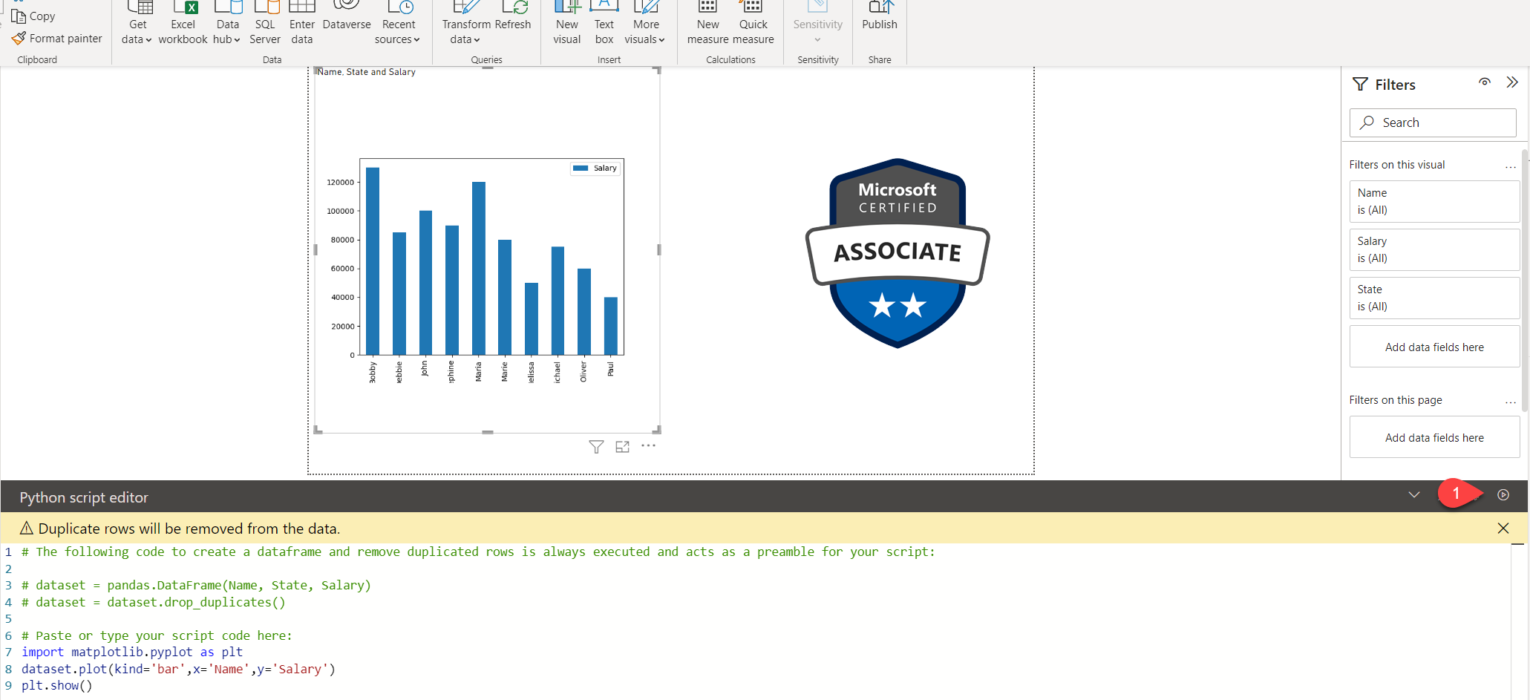
The first step is to select a Python visual in the Power BI Desktop. Straight after that, I’ll choose the fields from my dataset:
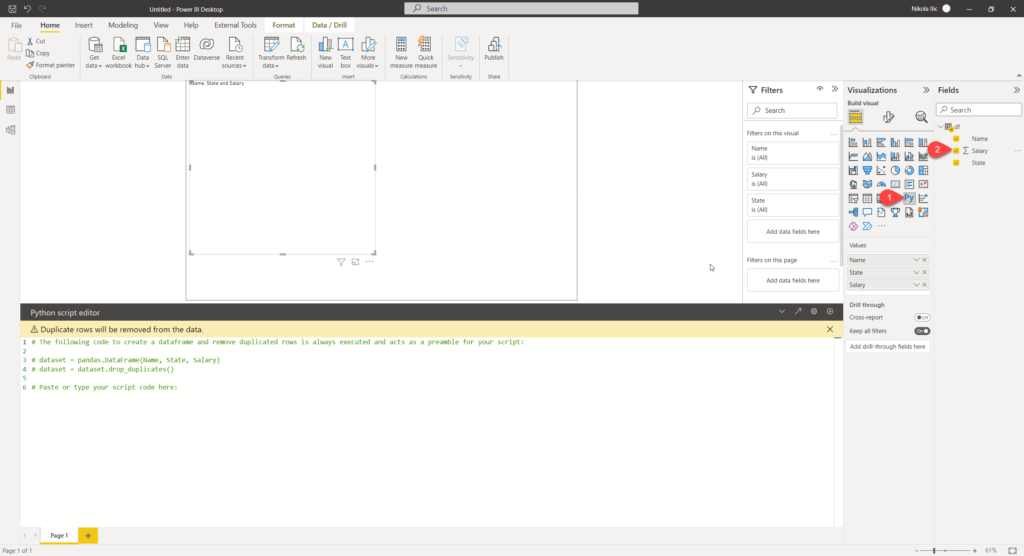
As you may see, once I’ve dragged the fields in the Values area of the Python visual, the script was automatically generated for me in the Python script editor. Now, I’m ready to extend this script and build a Python visual!
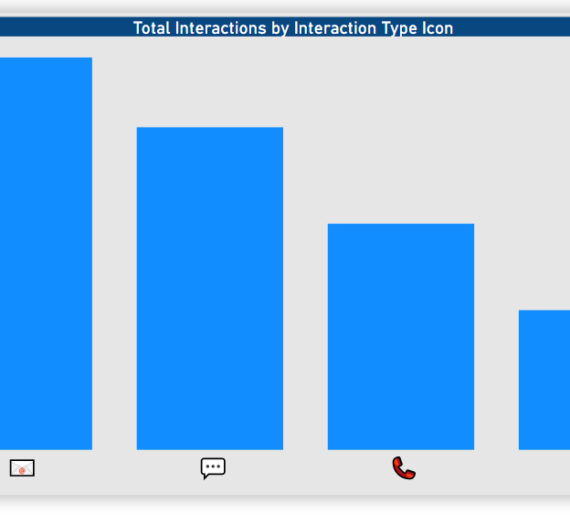
Let’s say that I want to see the salaries of each of the participants in the salary survey:
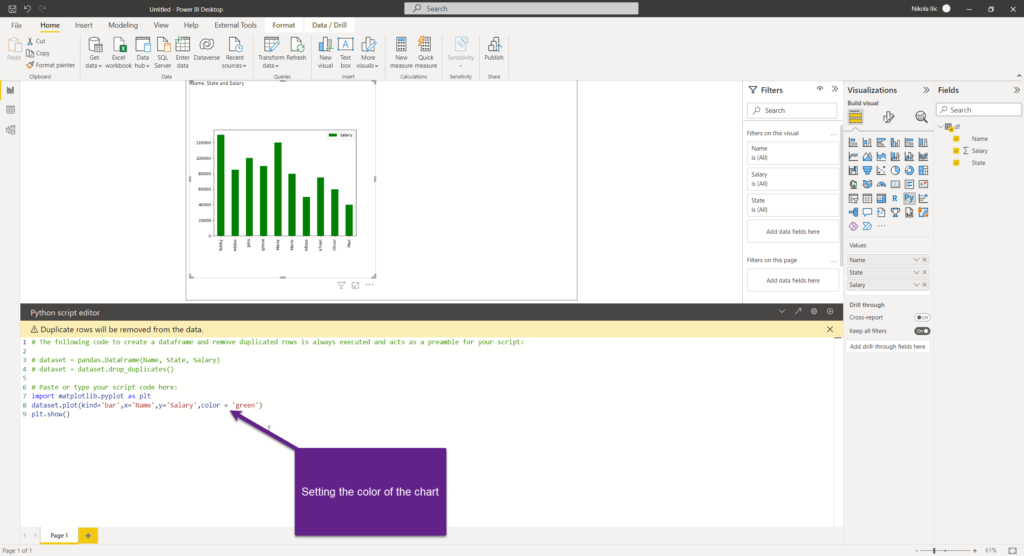
import matplotlib.pyplot as plt
dataset.plot(kind='bar',x='Name',y='Salary')
plt.show()
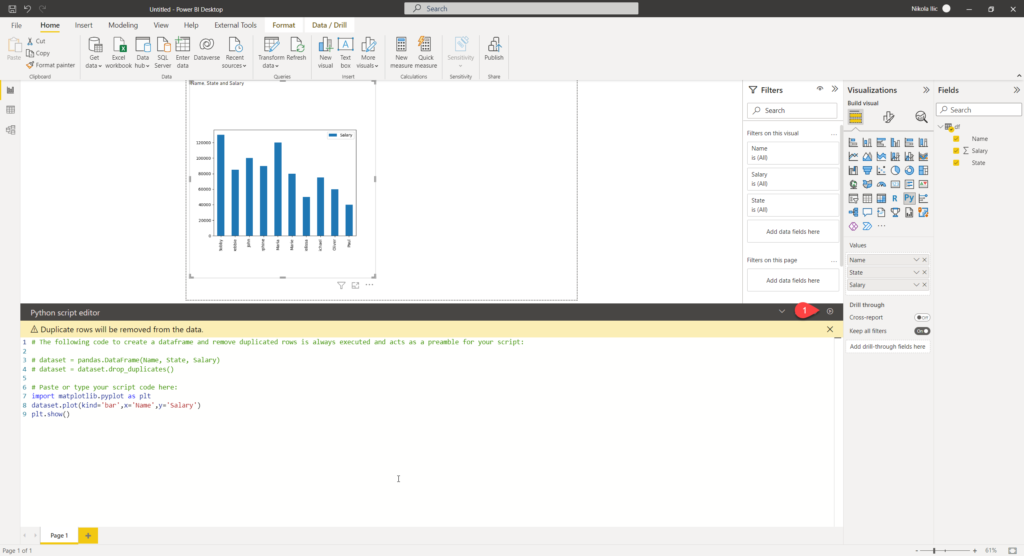
There you go! I have a column chart showing me values for all my names, built completely using Python script in the background. Depending on the specific data you want to visualize, you can also adjust the chart type, and use a line or scatter chart, for example: kind = ‘scatter’, or kind = ‘line’.
You can also change the color of the data points, by providing an additional argument color:
At this moment, Python visual comes with various limitations, as listed here. Most notably, there is a limit in terms of data size, as you can’t use more than 150.000 rows for plotting. Additionally, the size limit is 250 MB of data.
Conclusion
As you may have seen, Power BI offers a handy integration with powerful programming languages that are not part of the ecosystem “per-se”. That means, you can leverage R and Python to enhance your Power BI solutions and make your R/Python-oriented-data-analysts feel more comfortable when working with Power BI.
Of course, this was a super basic example of using Python in the Power BI, but in case you’re interested to dig deeper into this topic, I warmly recommend reading a book by Luca Zavarella: Extending Power BI with Python and R (I’ve shared the book review a few months ago). It’s a fantastic resource!
Additionally, I suggest reading this great article by David Eldersveld, focusing on potential performance challenges when using R and Python visuals in Power BI.
Thanks for reading!
Last Updated on January 20, 2023 by Nikola