A few months ago, while scrolling through posts on social media, one of them immediately grabbed my attention! It was about a new tool, called DAX Optimizer, which promised to identify and remove performance bottlenecks in your DAX formulas. For all of us dealing with optimizing Power BI reports on a day-to-day basis, that was a huge promise (and one I was impatiently waiting to see in action).
By the way, if you’re dealing with Power BI performance tuning on a daily basis, maybe you want to check my course on the topic.
After a few weeks on the waitlist, I finally got in! And, I finally found some time to give it a shot in the previous days.
What is DAX Optimizer?
As explained in the “Introducing DAX Optimizer” article on their website, this is a tool that performs deep, static analysis of your DAX code and not only identifies issues but also suggests solutions. Issues are ranked based on priority, so you can switch your focus on solving the most critical problems first.
First of all, DAX Optimizer is not a free tool! This is, to some extent, logical, since the tool mainly targets complex, enterprise-scale Power BI solutions, not small, home-made projects. Of course, you can use it for smaller projects as well, but I believe the biggest potential for improvements lies in enterprise-grade environments.

You can check the current pricing here. Essentially, you are paying for a certain number of “runs”. If you are wondering what counts as a “run” and how many models can be “scanned”, please refer to the relevant documentation page.
DAX Optimizer in action
The main purpose of this blog post is to show you DAX Optimizer in action and get you familiar with the capabilities of the tool.
Let’s start by creating a simple Power BI report page:
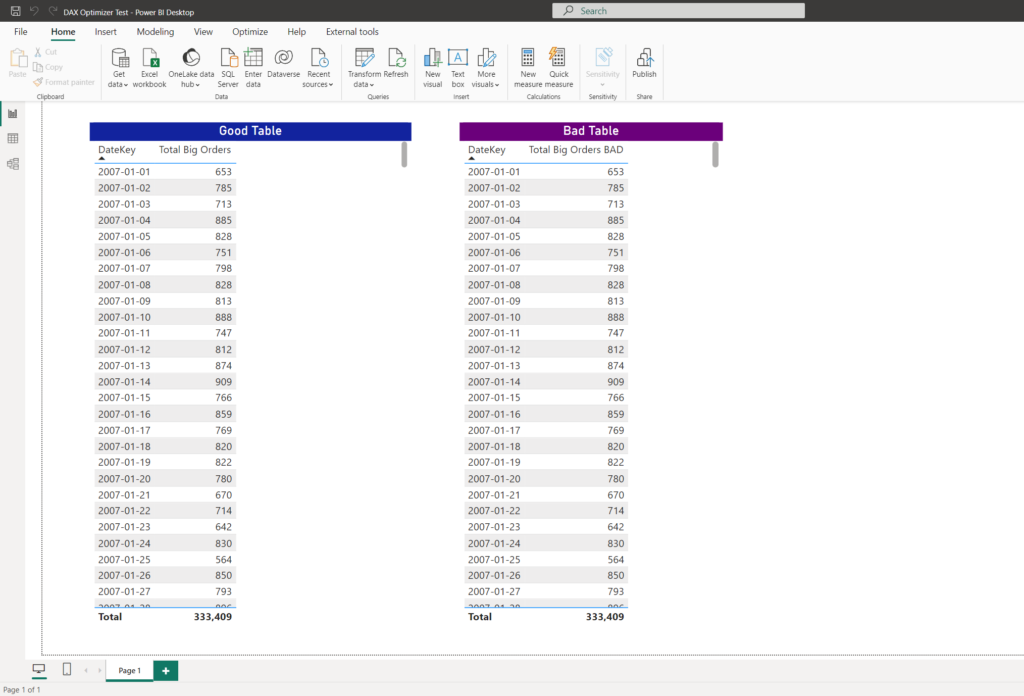
As you can see, I have two tables on the page, displaying exactly the same numbers. The figure shows the total number of orders with a sales amount greater than 500$. Good table leverages the following DAX statement:
Total Big Orders = CALCULATE(
                            [Total Orders],
                            KEEPFILTERS(FactOnlineSales[SalesAmount] > 500)
)
On the other hand, the “bad” table shows the same figure obtained by the following DAX statement:
Total Big Orders BAD = CALCULATE(
                            [Total Orders],
                            FILTER(FactOnlineSales,FactOnlineSales[SalesAmount] > 500)
)
I’ve intentionally written this DAX formula in a bad way (by providing the whole FactOnlineSales table as an argument to the FILTER function, although the filter is being applied on a single column). I know that this is an anti-pattern and non-optimal way to obtain results, but let’s see if DAX Optimizer will figure it out!
Once I log in to DAX Optimizer, the first thing that the tool asks me is to Add a model:

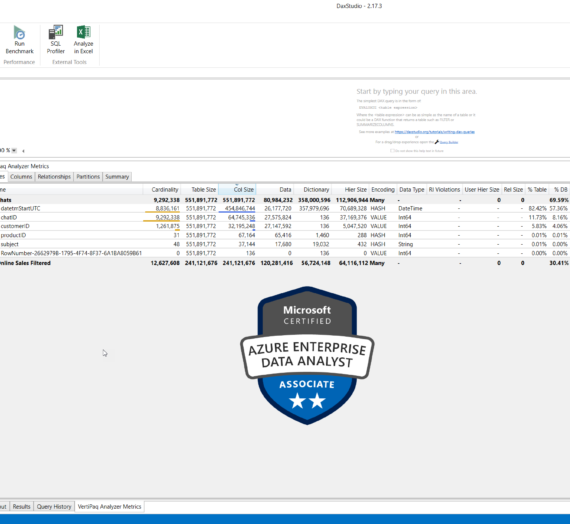
This assumes creating a .vpax file (VertiPaq Analyzer format), and I’ll use DAX Studio to accomplish this task.
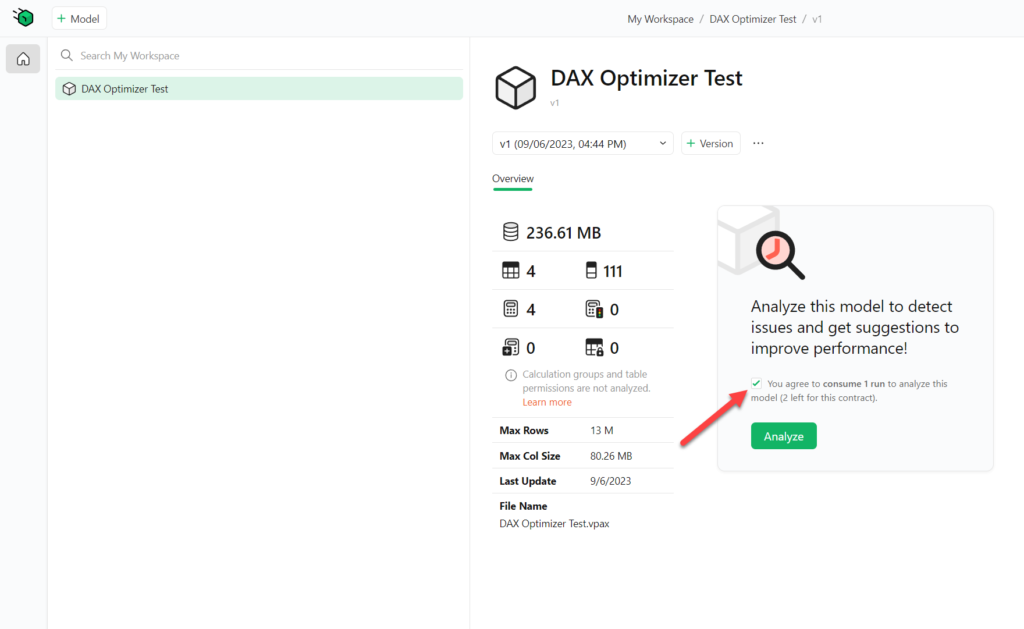
Once the model is uploaded, DAX Optimizer will first provide a high-level overview of the model – information about the total model size, number of tables and columns, measures, etc. Similar to what we currently have in VertiPaq Analyzer and Bravo for Power BI:
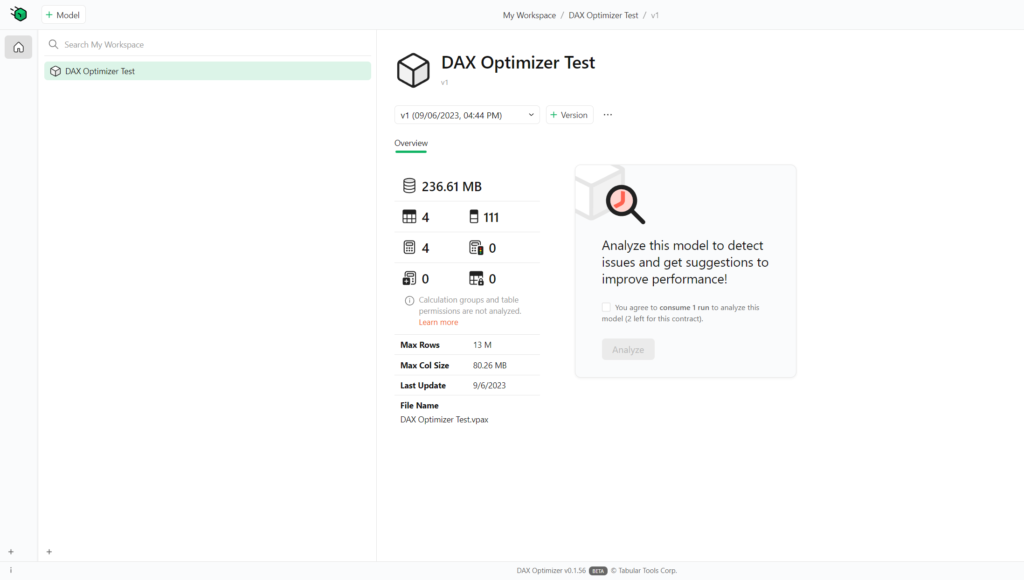
Since I got 2 “runs” for free, as part of the Beta program testing, I need to be mindful before clicking the Analyze button:). Not just that I need to be mindful, but I need to explicitly confirm by checking the box that I agree to spend one “run” now.
DAX Optimizer will need a few minutes to thoroughly scan all the “garbage” I put into my model, so let’s grab a coffee while waiting…
It took less than “promised” 5 minutes, so let’s take a look into results:
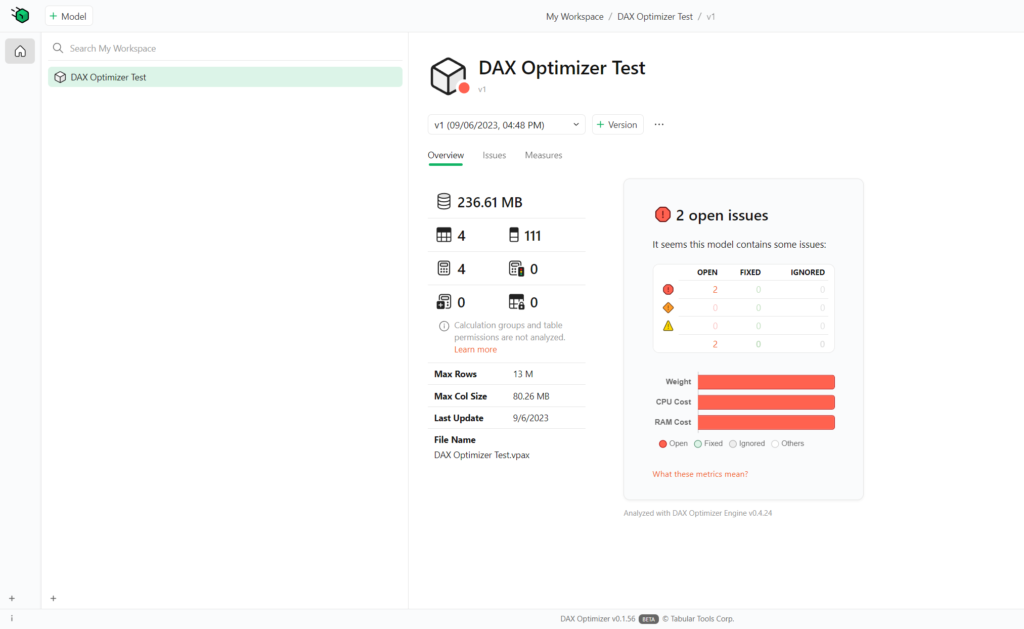
Looks like it’s not that bad at all! Only 2 issues identified, but both were flagged with the High priority. If you’re not sure what these metrics mean, you can always click on the helper link and find out more details. In short, Weight represents the estimated impact of the measure on the overall model performance. CPU Cost is the estimated CPU cost of the measure inclusive of referenced measures. RAM Cost is the estimated RAM cost of the measure based on the maximum materialization expected.
Although this looks fairly straightforward at first glance, there are some sophisticated processes happening in the background. As explained in this article, DAX Optimizer dives deep into TOM (Tabular Object Model) statistics, and based on the insight, estimates the potential impact of various code segments.
Ok, let’s now move on to discover more about the issues in our data model. Once I click on the Issues tab on the top, I’ll see both my issues, providing more details about the problem:
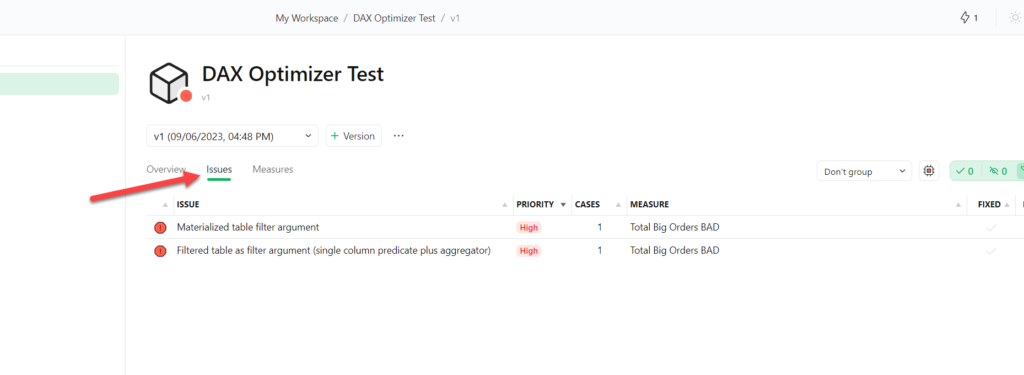
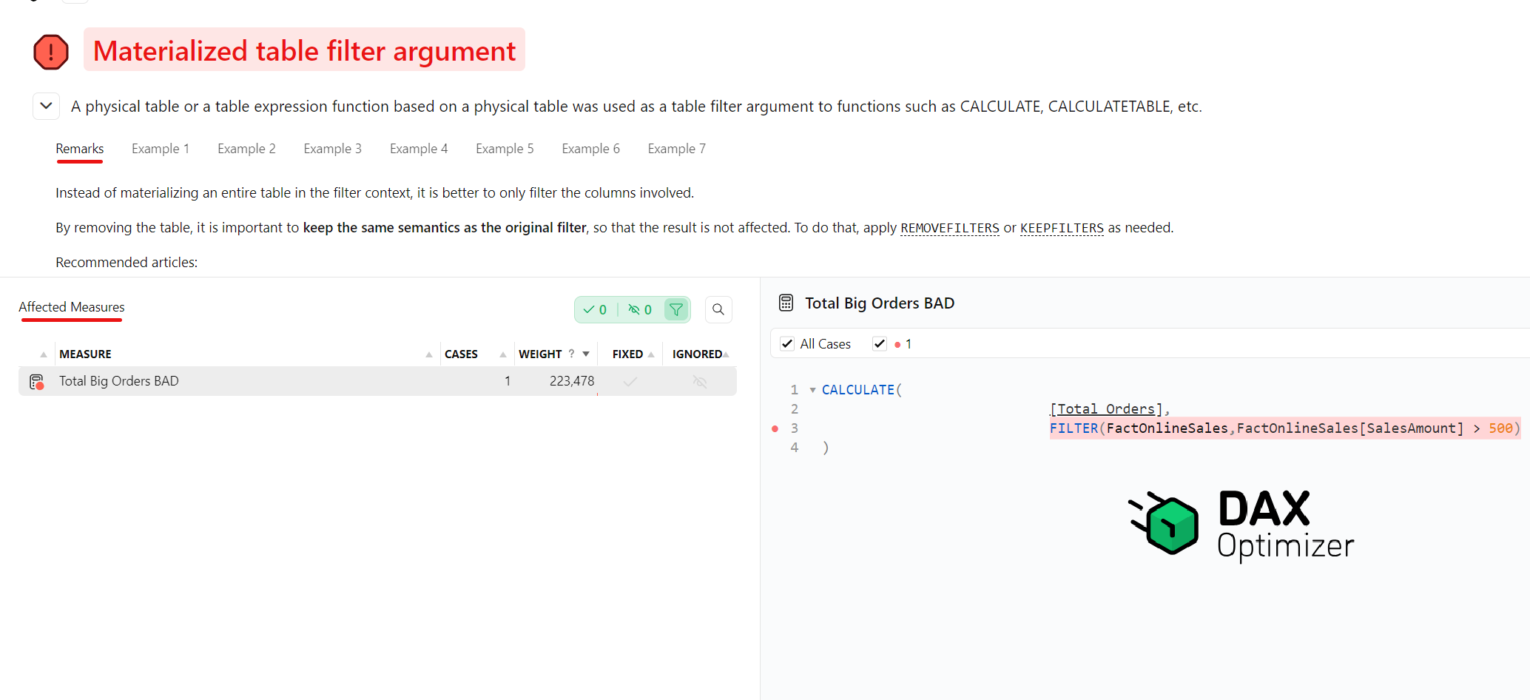
Issues are “clickable”, so let’s click the first one and see what DAX Optimizer will do:
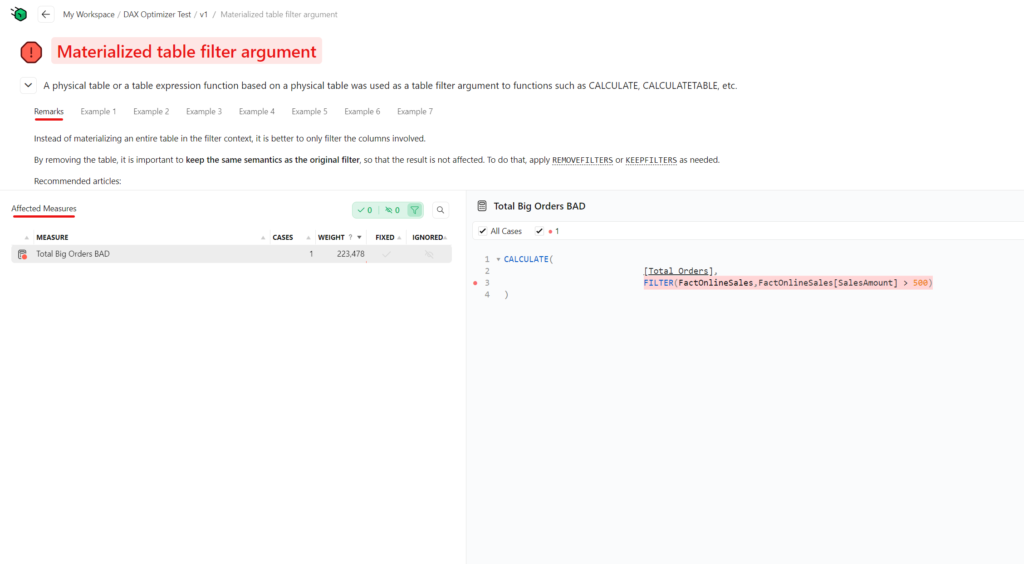
Oh, nice! Not only that the problematic chunk of the code has been marked, but I also see an explanation of WHY this is considered a bad practice!
The next step is to take care of these issues (essentially, I have only one issue, but it falls into two different categories as per DAX Optimizer’s criteria):
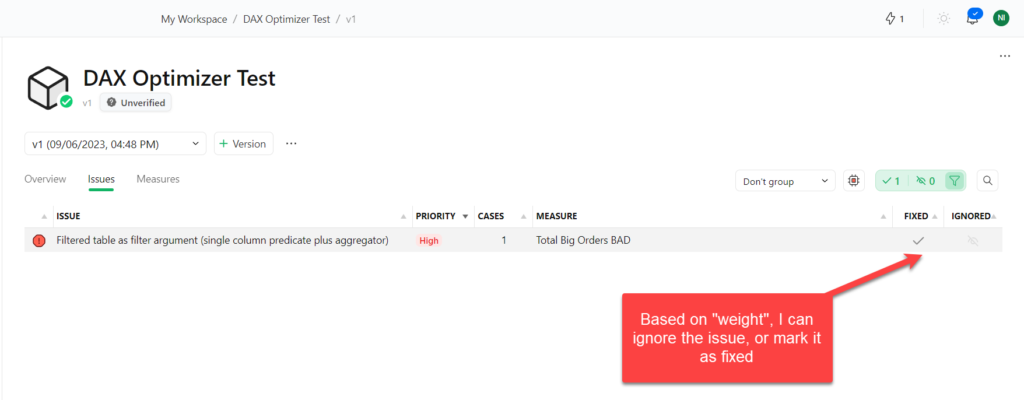
In this case, I can go back to my Power BI report and fix the problem by rewriting a measure, and then mark the issue as fixed. Or, in case I believe that this will not affect the performance of my model, I can simply ignore the issue.
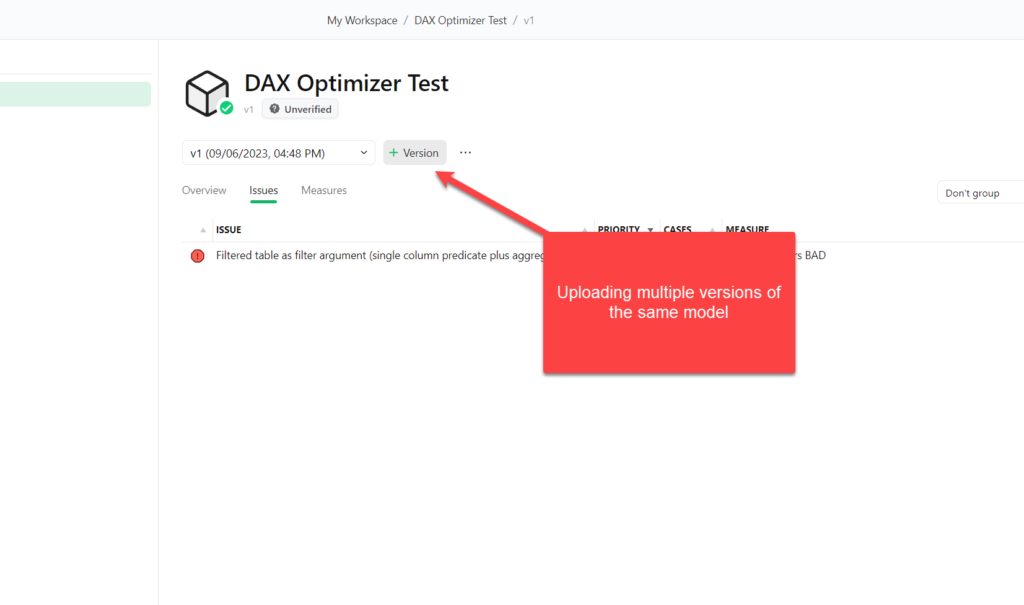
Finally, I can also create multiple versions of the same model, which may come in handy if you want to follow the optimization trajectory over time.
Conclusion
First of all, DAX Optimizer is still in Beta – which means, it’s definitely too early to draw any important conclusions.
Is it cool? Yesssss! The idea, the concept, and the people behind DAX Optimizer are absolutely magnificent, so no doubt that this tool will quickly become your best friend for optimizing Power BI performance.
Is it worth the price? Well, it depends:)…If you are a small “shop” and don’t deal with heavy complex models, there are definitely cheaper options for learning DAX…But, if your solutions serve enterprise-grade clients, or if you’re working with complex data models, then DAX Optimizer is for sure a smart investment.
I’m really looking forward to seeing how the tool develops in the future and what else it brings to the “Power BI Performance Tuning” toolbox.
Thanks for reading!
Last Updated on September 6, 2023 by Nikola