
Last week in Las Vegas, during the Microsoft Power Platform Conference 2023, there were many announcements from Microsoft about what’s coming next in the world of data and AI. Obviously, Copilot will be integrated everywhere and that probably stole all the headlines (and for a good reason, I would say). However, during Arun Ulag’s keynote, we also heard about the brand-new feature that is available right now – Semantic Link for Microsoft Fabric!
I won’t spend time explaining what Semantic Link is – you can check a wonderful article written by my friend Sandeep Pawar, or refer to the official blog post. Sandeep’s blog post does a great job explaining not just what Semantic Link is, but also what are the possible use cases of this new feature.
Therefore, I will focus on explaining how you can leverage Semantic Link for a specific use case: I call it “Augmenting Gold Layer” (copyrights reserved😆). And, we will perform this “operation” by using SQL! Yes, you heard me well – we will leverage SparkSQL language to go above and beyond and “transform” the data currently sitting in Power BI datasets.
If you’re not sure what the gold layer is, I suggest you first read this article, which is part of the “Data Modeling for Mere Mortals” series, or this one written by my friend Tom Martens.
Understanding the use case
Ok, if we agree that the gold layer contains business-reporting-ready data (who said, Star schema data model) and all the necessary, verified business logic (calculations that are checked and verified by domain experts), the common scenario is to use a reporting tool of choice (let’s say Power BI) to consume the data from this gold layer.
In real life, we usually create data marts to support individual departments or business groups (i.e. Financials, Marketing, HR, etc.), so we end up having multiple reports (let’s say Sales, Forecast, Customer Retention, etc.), each connecting to a particular dataset (or semantic model, which is the new official name for Power BI dataset, so from now on, I’ll refer to Power BI datasets as semantic models).
Now, imagine the following scenario: you get the requirement from a user (let’s say that it’s a very important user, like a CFO for example), who needs to have both sales and forecast data at their disposal. Sure thing, we can either create a dashboard and pin visuals from both reports, or design another semantic model Sales+forecast to combine information from the existing models. Let’s now discard the “dashboard option” and focus on the option to merge info from multiple semantic models.
At first glance, this might look like a trivial task – grab tables from here and there, and there you go! But, let’s stop for a moment and consider the following:
- This approach requires serious involvement of IT (or someone responsible for creating semantic models). This means, there is a dependency on the availability of these individuals
- What about the calculations that were already verified and are part of the existing semantic models? If we create a new semantic model by simply combining tables from the existing ones, calculations need to be defined from scratch! Which is fine if you have just a few of them…But, what if your semantic model contains hundreds of calculations?
Introducing Semantic Link
It’s finally time to introduce our new “friend” – Semantic Link.
Disclaimer 1: Microsoft Fabric is, at the moment of writing, still in public preview. That means, the Semantic Link feature (same as other features in Microsoft Fabric) can work and behave quite differently at the moment of reading this article
Disclaimer 2: I’m a SQL guy and by no means a Python expert, so if you’re a Python ninja please be “polite” and don’t laugh at my Python code in this article😆
With Semantic Link, you can do many cool things! For example, you can read the data from Power BI semantic models, as described here. You can also run a DAX code against the semantic model directly from the cell, by using the %%dax cell magic!
However, as I mentioned that I’m a SQL guy, my plan is to leverage SQL (in this case Spark SQL) to augment the data from the existing semantic models and expose newly created data structures to different target audiences. I will examine two different scenarios:
- Combining the data from two different existing semantic models into a new one, while keeping the existing calculation logic in place
- Adjusting the data granularity of the existing semantic model to support different business requirements, while keeping the existing calculation logic in place
As you may notice, the emphasis is on keeping the existing calculation logic in place. That’s why we are using Semantic Link in the first place and not creating a brand new semantic model from scratch.
In full honesty, using a Semantic Link to create a new semantic model should be more of an exception than the rule, and you should stick with the “traditional” approach of creating semantic models in the gold layer. The purpose here is to show what’s possible and why in certain scenarios you might want to consider going this path.
1, 2, 3…Action!
Ok, enough talking, let’s kick off some cool stuff!
As a prerequisite for using Semantic Link, we need to install the SemPy Python library in our notebook kernel, although this step is not required if you are only going to use Spark SQL (thanks to Pawel Potasinski for pointing this out😉):
%pip install semantic-link
Then, we need to configure Spark to use the Power BI Spark native connector:
spark.conf.set("spark.sql.catalog.pbi", "com.microsoft.azure.synapse.ml.powerbi.PowerBICatalog")
Now, we are ready to start exploring our Power BI semantic model by using Spark SQL!
%%sql

SELECT
    a.`Contoso Product[BrandName]`
    , CAST(SUM(`Sales Amt`) AS DECIMAL (18,2)) as SalesAmt
FROM
    pbi.`Chef Big Book MPPC`.`_Metrics` as a
GROUP BY
    a.`Contoso Product[BrandName]`
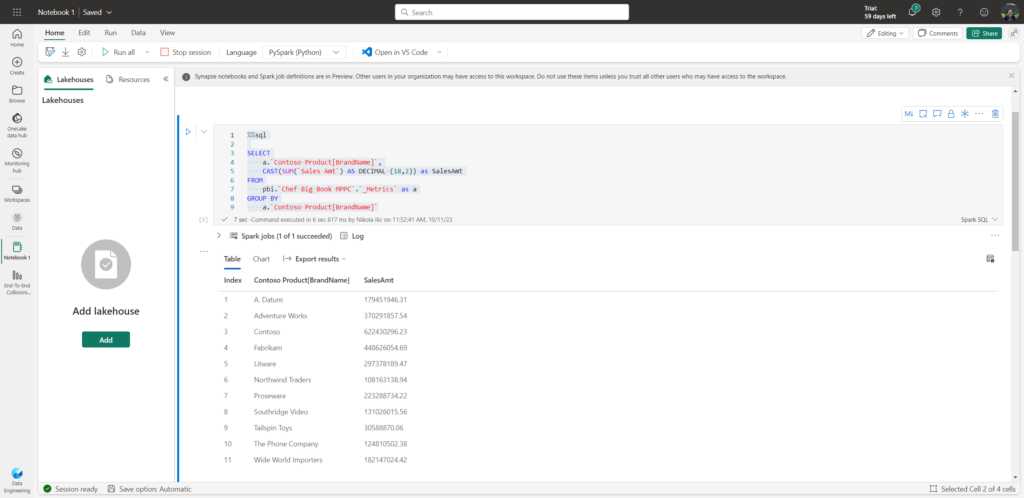
To briefly explain what is happening here: we are referencing a virtual _Metrics table, that exposes all the measures from the existing Power BI semantic model. We are calculating the sum of the sales amount and grouping the numbers per brand name (column from the Contoso Product table in the semantic model). Relationships from the underlying semantic model are automatically inherited! Results are displayed in the table, but you can also switch to Chart mode, or export results to CSV directly.
So, the first obvious benefit of this feature is quick ad-hoc data exploration, without the need to physically move the data out of the Power BI semantic model. That’s really cool!
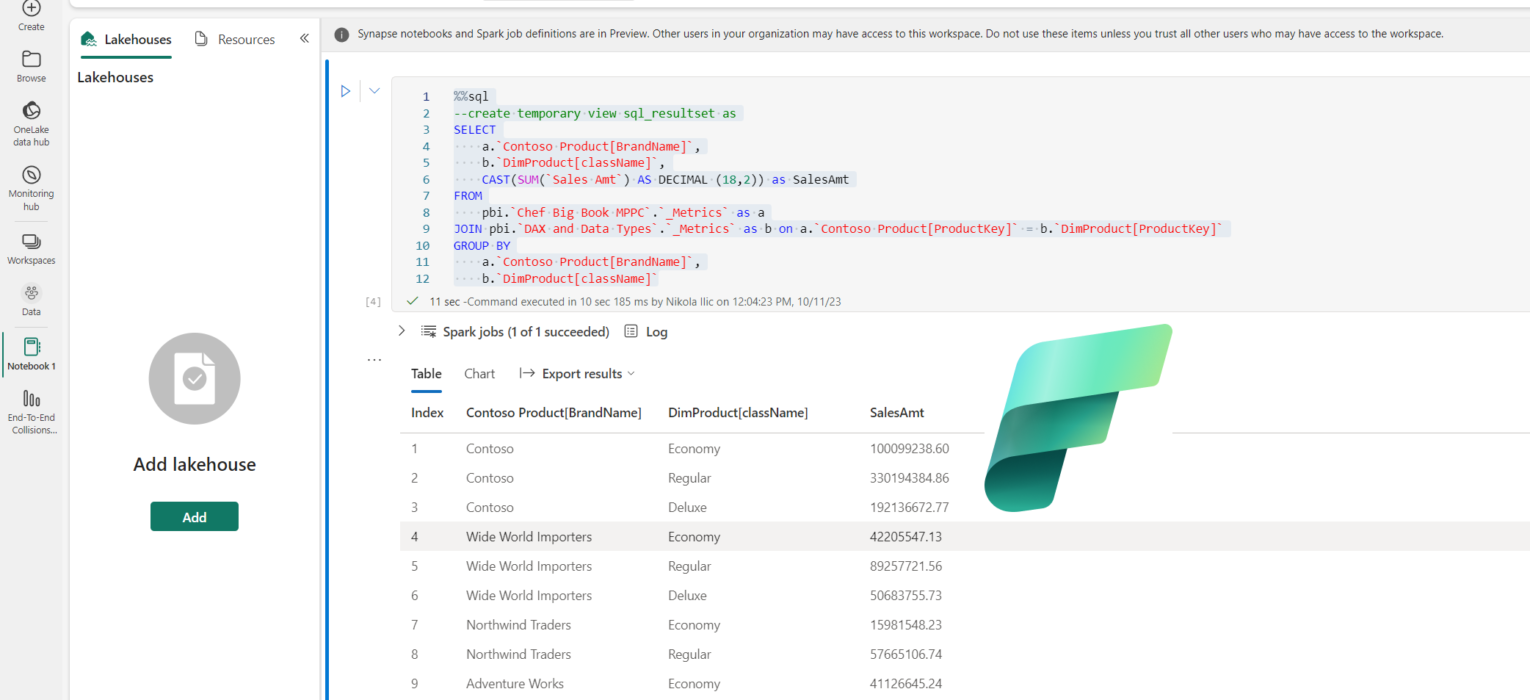
Now, imagine that my user also needs to see the information about the product class. This column is not part of the current semantic model that I’m querying, but it is part of another semantic model. So, what should we do? Of course, we will join the other semantic model to this one to combine results!
%%sql

SELECT
    a.`Contoso Product[BrandName]`
    , b.`DimProduct[className]`
    , CAST(SUM(`Sales Amt`) AS DECIMAL (18,2)) as SalesAmt
FROM
    pbi.`Chef Big Book MPPC`.`_Metrics` as a
INNER JOIN pbi.`DAX and Data Types`.`_Metrics` as b
                     ON a.`Contoso Product[ProductKey]` = b.`DimProduct[ProductKey]`
GROUP BY
    a.`Contoso Product[BrandName]`
    , b.`DimProduct[className]`

Wait, what?! I’ve just been able to combine the data from two DIFFERENT Power BI semantic models (“Chef Big Book MPPC” and “DAX and Data Types”)! That’s really super cool!
What next, I hear you asking for more…Well, let’s put the result of this query into the DataFrame, so we can then apply all of the fancy Python Pandas “thingies” on top of it.
%%sql
create temporary view sql_resultset as
SELECT
    a.`Contoso Product[BrandName]`
    , b.`DimProduct[className]`
    , CAST(SUM(`Sales Amt`) AS DECIMAL (18,2)) as SalesAmt
FROM
    pbi.`Chef Big Book MPPC`.`_Metrics` as a
INNER JOIN pbi.`DAX and Data Types`.`_Metrics` as b
                     ON a.`Contoso Product[ProductKey]` = b.`DimProduct[ProductKey]`
GROUP BY
    a.`Contoso Product[BrandName]`
    , b.`DimProduct[className]`
It’s the same code as in the previous case, but this time I’ve added a line of code at the top, to create a temporary view. Once done, I’ll execute the following code to create a DataFrame containing results from the previous SQL query:
df = spark.sql("SELECT * FROM sql_resultset")
df.show()

Now, you can probably guess where I’m going with this. The next step is to store this as a new Delta table in my Lakehouse, so that users can leverage whatever tool they want (when I say “whatever”, I mean any tool capable of reading Delta format). Yes, you can also use Direct Lake mode with Power BI to expose this newly created semantic model…
Scenario #2 – Adjusting the data granularity
In the second scenario, let’s imagine that you have an existing semantic model with a 1 billion rows fact table on a day level of granularity. The semantic model contains 100+ verified calculations. Now, there is a requirement from a small group of users that need to analyze the data on a monthly level (budgeting, forecasting, etc.). To satisfy this requirement, you have a few options at your disposal:
- Extend the existing semantic model with the aggregated table (on a monthly level) – this approach may work very well until your aggregated tables are being hit by the queries. If not, well, then performance will probably suffer. In addition, someone needs to create those aggregated tables, add them to a semantic model, establish relationships, set the proper storage mode for each table, and finally manage aggregations from Power BI…
- Create a new semantic model with a fact table on a monthly level – the performance of this model should definitely be better than the previous one, but what happens with 100+ calculations? Yes, you’re right, you would have to re-create them in the new semantic model
- Augment the existing data model by leveraging the Semantic Link – this would be a mix of the previous two approaches: you’ll create a new semantic model (assuming that we store the SQL query results in the Delta table, as in the previous scenario), but this semantic model may also include 100+ verified calculations available out-of-the-box
%%sql

SELECT
    YEAR(`Dates[Date]`) as _Year
    , MONTH(`Dates[Date]`) as _Month
    , CAST(SUM(`Sales Amt`) AS DECIMAL (18,2)) as SalesAmt
    , CAST(SUM(`Sales Qty`) AS DECIMAL (18,2)) as SalesQty
FROM pbi.`Chef Big Book MPPC`.`_Metrics`
GROUP BY YEAR(`Dates[Date]`)
    , MONTH(`Dates[Date]`)
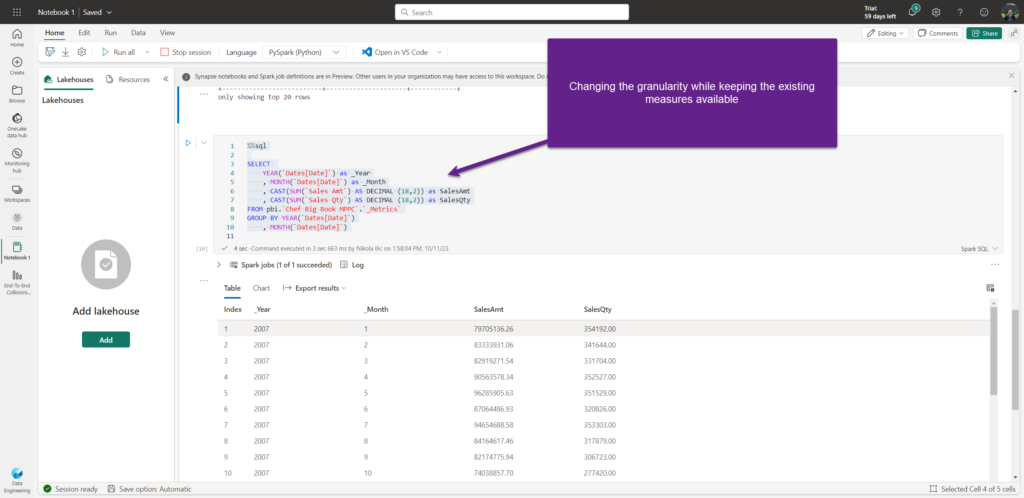
As you may notice, we are adjusting the data granularity – moving from the individual date to the year/month level – while at the same time keeping all the verified calculations available within the new, augmented semantic model. Again, very cool!
Word of warning…
Now, I want you to remember: being able to do something, doesn’t necessarily mean that you SHOULD do it. Leveraging Semantic Link for this purpose, although looks very handy, is far from the best practice and it should definitely not be your default choice. However, it’s good to have the possibility to choose between different options, and based on the specific scenario, decide which one works in the most efficient way in that particular use case.
Conclusion
Semantic Link is much more than creating an “augmented gold layer”. Its main purpose is to support data scientists and ML engineers to build upon cleaned and refined data from Power BI semantic models, using their preferred toolbox (pandas, Spark APIs). As Sandeep rightly points out in his blog post, Semantic Link opens a whole new world of possibilities and I’m really curious to see all the real-life applications of this new feature.
Thanks for reading!

Last Updated on January 9, 2024 by Nikola

Anand
Thank you for the detail article.
A quaetion on Scenario #2 – Adjusting the data granularity –
Augment the existing data model.
When a PBI report refers to Sales Amt and Sales Qty in a monthly aggregate visual, will MS Fabric Semantic Model (a.k.a PBI dataset) automatically use the aggregate table? And when the PBI report using daily granularity in the report it will then hit the detail level fact table?
I am sure that is what you are mentioning, but I wanted to double check that it is the case.
Nikola
Hi Anand,
If you are referring to Manage aggregations feature in Power BI – the answer is: No, in this scenario aggregated table will not be automatically used, since Power BI is not “aware” of it (aware in terms of “knowing” that queries can be pushed to the aggregated table version).
Bob Kundrat
Hey Nicola,
I agree that this would be an exception for the example you used when combining data from two different semantic models. It seems like this would be a good way for both IT and an advanced business user to play with the data and proof the results during requirement gatherings to make sure the data as it’s modeled in both SMs can be brought together.
Would you agree?
Nikola
Hey Bob,
Yes, it absolutely make sense in certain scenarios (such as the one you mentioned), although this is definitely not a default “modus operandi” when working with semantic models.
Cheers,
Nikola
MICHEL PIERRE-LOUIS
Hello,
I need to take courses for DP-600 as well as for Microsoft Fabric.
Do you offer those courses like you do or did for DP-500? I am talking about online courses.
Thanks
Nikola
Hi Michel,
Thanks for your interest in the DP-600 course. I’m currently working on the course and hope to have it ready in the next few weeks.
Best,
Nikola
Raphael
I was thinking I know the goal is not to create new datasets based on an existing dataset.. But I can’t get over the fact that I would need to recreate all customizations for dimensions in all semantic models it is needed.
Calendar table is an example. I would create hierarchies, hidden columns, descriptions, etc. and this table will be used across all semantic models.
Why shouldn’t I use semantic links to recreate all curated dim tables from our MASTER semantic model as the first step generating new semantic models?