

Aggregate functions are one of the main building blocks in Power BI. Being used explicitly in measures, or implicitly defined by Power BI, there is no single Power BI report which doesn’t use some sort of aggregate functions.
What are aggregate functions ?
Aggregating means combining values in your data performing some mathematical operation. That can be SUM, AVERAGE, MAXIMUM, MINIMUM, COUNT, COUNT DISTINCT, MEAN, STANDARD DEVIATION, etc.
However, in-depth observation of aggregate functions is not in the scope of this article. Here, I wanted to demonstrate how you can use aggregate functions in an unconventional way, since I believe it can be useful in some specific scenarios.
Default behavior of aggregate functions
By default, aggregations are being calculated on columns. Let’s take a look at following basic example:
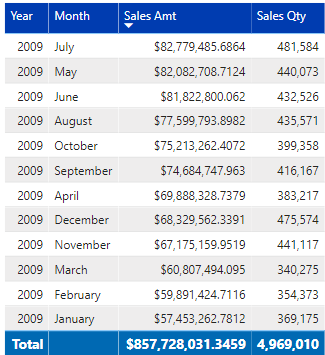
This is a typical example of SUM aggregate function. Numbers are being aggregated on Year and Month level, and finally in the end we can see the total of individual values in the table.
We could also perform AVERAGE to find average values, MIN or MAX to find the minimum and maximum values, etc. Pretty straightforward and probably already known for most of the people who ever worked with Power BI or Excel.
Aggregation on rows – without unpivoting!
But, what if we wanted to perform aggregations on rows instead of columns? Is it possible to do that? And if yes, how?
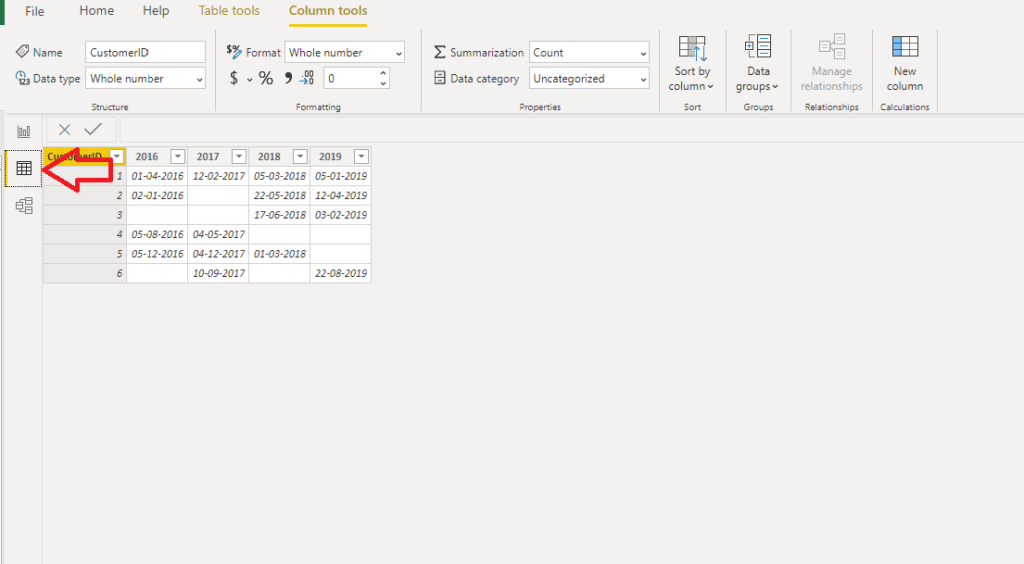
Let’s head over to a Power BI and check immediately. I have an Excel file as a data source and a dummy table which contains data about customer and first date within a single year when he made a purchase:
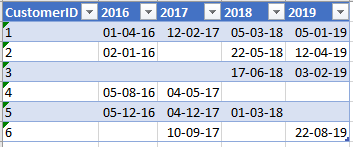
As you can see, some customers made a purchase in every single year, some have gaps, some came in later years, etc.
Now, I want to retrieve earliest date when a customer made a purchase, so I can later perform analysis based on that date (for example, to analyze how many customers made first purchase in February 2017).
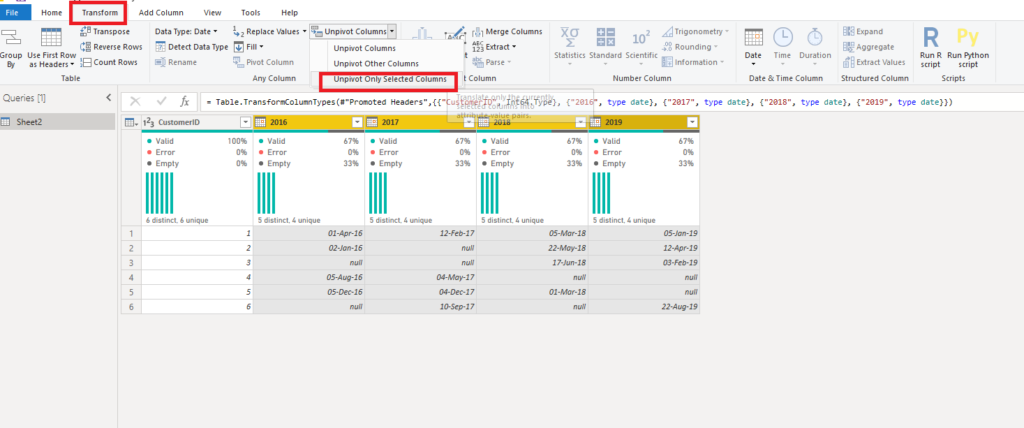
I know, most of you would probably go with Power Query transformation and Unpivoting years’ columns, something like this:
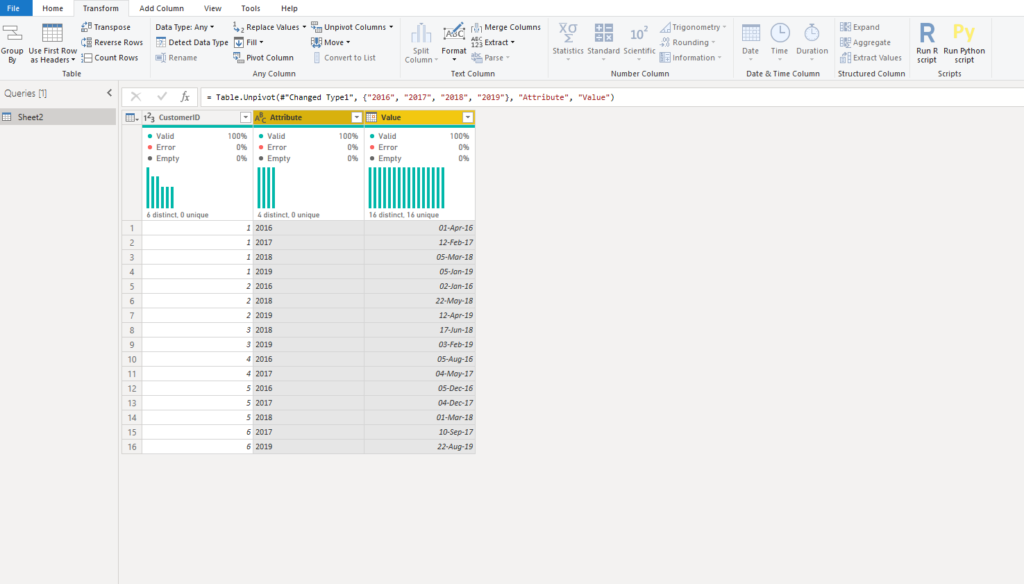
And you get nice new look of the table, with all dates grouped by customer:
However, an additional workload is necessary to build a separate column which will hold data about the earliest date (or MIN date) for every single customer, so we can later use this column for filtering purposes, or even for building a relationship to a date dimension.
What if I tell you that you can do this with a single line of code and without any additional transformations?
First, I will close Power Query editor and go straight to Power BI Data view:
You see that this table looks exactly the same as in Excel. Now, I choose to create a new column and, when prompted, enter following DAX code:
First Purchase Date = MINX({Sheet2[2016],Sheet2[2017],Sheet2[2018],Sheet2[2019]},[Value])
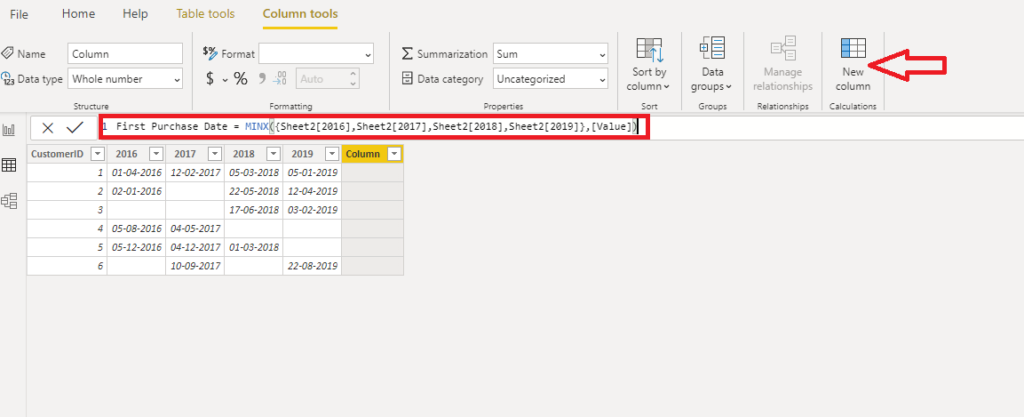
Let’s stop here for the moment and explain what we are doing. So, we want to extract the minimum date from every single row. We could do that by using multiple nested IF statements and using MIN aggregate function. Since MIN function accepts only two arguments, we would have multiple levels of nested IF statements, which is quite ugly and pretty much hardly readable.
The magic here is in the curly brackets! By using them, we are telling DAX that we want it to create a table from the list within the curly brackets, and using MINX iterator aggregate function, we are simply iterating through this table and pulling minimum value from it.
How cool and elegant is that! It worked like a charm and here is the resulting column:
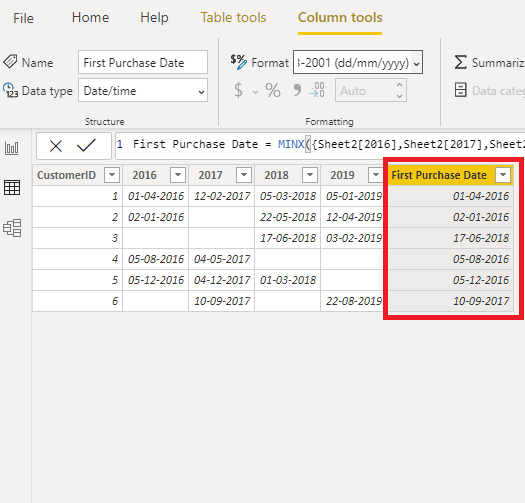
You can easily spot that DAX returned expected values, so now we can use this column as an axis in our charts, create regular date hierarchies on it, or we can even create a relationship between First Purchase Date and date dimension in our data model if we like to.
Conclusion
Power BI and DAX are full of hidden gems. In complete honesty, I have to admit that you might not face scenario like this every single day, but in some specific situations, it’s good to know that you can perform aggregate functions on row level in very simple, yet powerful manner – using literally single line of code!
Last Updated on July 7, 2020 by Nikola


Vivek Ranjan
Great article. Thanks!
I have a question: How can we get the column header name instead?
Nikola
You’re welcome. Sorry, but I’m not sure that I understood your question: column header name instead of what?
Bharat
Wow amazing article must know for Power Bi developer.
Nikola
Thank you Bharat!
Daniel Clark
Have you tested the performance on this?
Nikola
Hi Daniel,
Honestly, I haven’t tested performance, because my table was really small (<1000 records).
Peter Hui
This is still pretty amazing, could have saved me so much time !
Nikola
Thanks Peter, I’m glad to hear that you find it useful!