

After my article on Fabric Warehouse CU metering, which caused a lot of people reaching out and mentioning that it helped them understand the topic better, I decided to cover SQL database in Fabric from a similar angle too.
Imagine opening an internal application, updating a few records, and closing it two minutes later. You check consumption afterward and see that compute continued accruing.
Before blaming the application, it helps to understand what keeps the database online, and what Fabric actually measures.
CPU has a company
SQL database compute draws from your shared Fabric capacity. Microsoft specifies 2.611 CUs per database vCore, with memory converted at 3 GB per vCore. Billing uses the higher of CPU usage and the memory equivalent.
While online, a database has a 2 GB memory minimum. Compute is released after 15 minutes of inactivity. Storage continues accruing. These are the rules in Microsoft’s billing documentation.
For an interval with constant usage, the calculation is:
CU-seconds = max(vCores used, memory GB used / 3) x seconds x 2.611
Calculate the changing usage interval by interval. Memory here means the database memory used for billing, so please don’t substitute an individual query’s memory grant.
The following are illustrative workload scenarios, not measurements from a customer environment. Each calculation states its inputs. Totals use the published multiplier without rounding intermediate values.
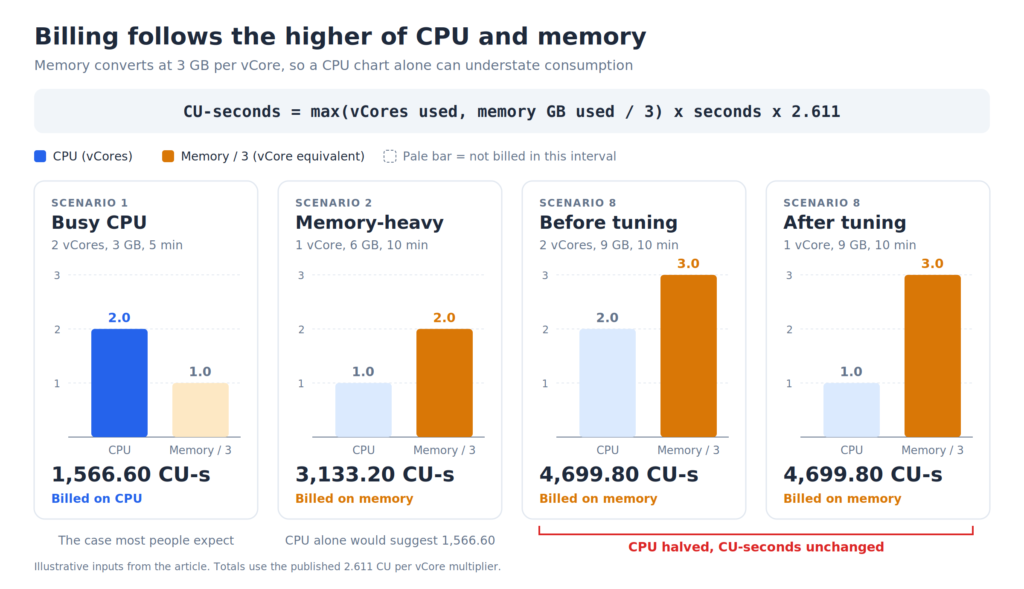
1. Five minutes of busy CPU
An order-processing application runs a burst of work. For five minutes, measured database usage stays at 2 vCores and 3 GB of memory.
CPU: 2 vCores
Memory equivalent: 3 / 3 = 1 vCore
Compute: 2 x 300 x 2.611 = 1,566.60 CU-seconds
CPU determines this interval’s consumption. This is the straightforward case most of us would expect when we first hear about vCore billing.
2. Less CPU, more memory
Now consider a ten-minute application workload using 1 vCore and 6 GB of memory throughout.
CPU: 1 vCore
Memory equivalent: 6 / 3 = 2 vCores
Compute: 2 x 600 x 2.611 = 3,133.20 CU-seconds
Using CPU alone would produce 1,566.60 CU-seconds, half the correct result for these inputs.
This is the first thing I’d check when someone says their database is consuming more capacity than the CPU chart suggests.
3. A full table scan leaves memory behind
Suppose an ad hoc query scans a large table and loads 30 GB of data pages into memory. The database has enough memory available for this example. The query finishes, but those cached pages can remain available for later queries. That retained memory can continue to drive compute consumption even when CPU usage falls.
Fabric’s billing documentation confirms that cache reclamation reduces memory during quiet periods. Microsoft’s Azure SQL serverless memory-management guide describes gradual reclamation when CPU or active cache usage is low. Cache activity and background work can delay it.
For a worked example, suppose total billable database memory remains at 30 GB for 15 minutes after the scan, and CPU stays below the equivalent 10 vCores throughout:
Memory equivalent: 30 / 3 = 10 vCores
Compute: 10 x 900 x 2.611 = 23,499 CU-seconds
That is 15 times the 1,566.60 CU-seconds for 15 minutes at the 2 GB online minimum. This calculation covers the period after the scan only. It excludes the scan itself and any other database memory beyond the stated 30 GB.
The 15 minutes at 30 GB is an illustrative resource profile, not a documented minimum cache-retention time. The Azure SQL guide doesn’t promise that all pages stay cached for that long. Fabric’s 15-minute inactivity timeout describes when compute is released; memory can be reclaimed while the database is still online. If memory falls sooner, calculate each interval at its actual level.
This is why I’d look at memory after an occasional reporting query finishes. A full scan can affect consumption beyond its execution time, and the 2 GB minimum isn’t a reliable estimate for that whole period.
4. The two-minute application session
Let’s return to that internal application. Use the following resource profile:
| Interval | CPU | Memory | Calculated CU-seconds |
| Two minutes of activity | 2 vCores | 3 GB | 626.64 |
| Next 15 minutes, inactive but online | 0 vCores | 2 GB | 1,566.60 |
| Remaining 43 minutes, compute released | 0 vCores | 0 GB | 0 |
| Hour total | 2,193.24 |
In this example, the idle period contributes more compute consumption than the application session itself!
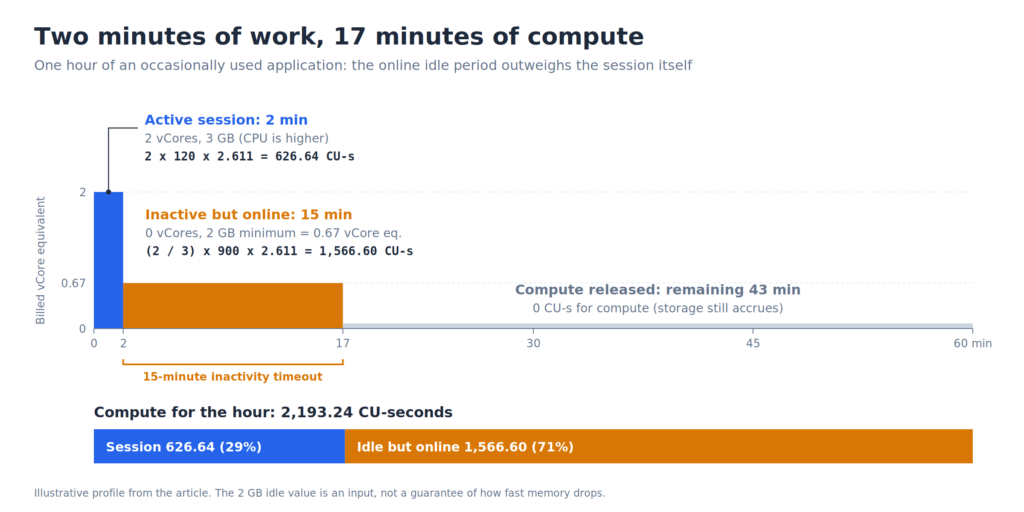
The 2 GB idle value is an explicit input, not a promise that memory immediately drops to that level. Microsoft describes cache reclamation during quiet periods, while retaining the online minimum. Its own example also describes two active minutes followed by 15 online minutes. Source.
For an application used occasionally, I would measure the whole session and its aftermath before estimating a day’s consumption.
5. A small task every ten minutes
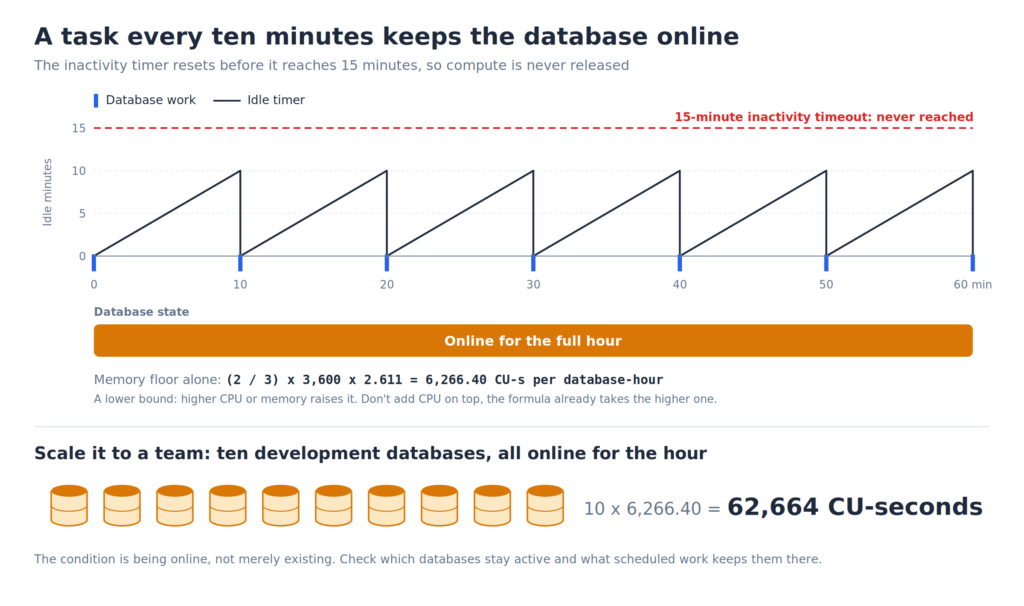
Suppose an application executes database work every ten minutes. If that activity prevents the documented inactivity period from completing, the database remains online between calls.
For one full online hour, the memory-floor calculation alone is:
(2 / 3) x 3,600 x 2.611 = 6,266.40 CU-seconds
That is a lower bound for this scenario. Higher memory or CPU usage can increase it. Don’t add the full CPU charge on top of the memory charge, because the formula already selects the higher dimension.
A scheduled status query would be worth investigating here. I would verify its effect in consumption data before changing its schedule. The three reference docs don’t establish the idle-timer behavior of every connection, probe, or client tool.
6. Ten development databases
For a team with ten databases, suppose all ten remain online for one hour. Their combined memory-floor calculation becomes:
10 x 6,266.40 = 62,664 CU-seconds
This doesn’t mean that ten databases simply existing incur that compute consumption. Being online for the hour is the condition in this example.
I’d review which databases actually remain active during a working day. A database that nobody intentionally uses is a good place to investigate scheduled activity before deciding that the capacity needs upgrading.
7. The application that stays busy all day
Take an eight-hour interval with sustained usage of 4 vCores and 9 GB of memory:
Memory equivalent: 9 / 3 = 3 vCores
Compute: 4 x 28,800 x 2.611 = 300,787.20 CU-seconds
Here, CPU determines consumption. The example covers the working interval only, while excluding any subsequent online time and storage.
For this application, my tuning effort would start with the frequently executed CPU-heavy queries. Spending time trying to create idle gaps would make little sense if the business needs the application throughout the day.
8. You halve CPU usage, but the CU total stays put
Consider two ten-minute measurements before and after tuning:
| Measurement | CPU | Memory | Billing equivalent | CU-seconds |
| Before | 2 vCores | 9 GB | 3 vCores | 4,699.80 |
| After | 1 vCore | 9 GB | 3 vCores | 4,699.80 |
For these inputs, the arithmetic produces no CU reduction. Memory determines both results.
The CPU improvement may still be useful. But I wouldn’t turn a CPU percentage reduction into a savings claim without checking duration and memory over the same workload.
9. The database is paused, but storage remains
Microsoft includes backup storage up to the allocated database size; only the excess is chargeable. Backup billing rules.
For a database with 120 GB allocated storage:
| Backup storage | Excess backup storage |
| 90 GB | 0 GB |
| 120 GB | 0 GB |
| 170 GB | 50 GB |
The last row means 120 GB of database storage plus 50 GB of chargeable backup storage, at their applicable rates. It doesn’t mean 170 GB of backups are all chargeable.
For spend, inspect the billing period as well as the current size. Microsoft’s monitoring walkthrough explains that billable storage reflects hourly averages apportioned over the month. A current storage reading and a billable figure therefore needn’t match.
Finding the explanation in Fabric
My starting point would be the Capacity Metrics app. Filter the item kind to SQLDbNative and inspect SQL Usage. Its Duration(s) value represents a 60-second reporting window, so bear in mind that this field doesn’t establish a one-minute billing minimum. Billing and utilization reporting provides a detailed overview of the compute usage of the SQL database in Fabric.
Microsoft’s monitoring guide explains that capacity reporting includes user and system-generated T-SQL activity. For query investigation, it points to the Performance Dashboard and DMVs, accessible through tools such as SSMS and the SQL query editor.
Open Performance summary from the database’s Home toolbar. Then follow the symptom:
| What you notice | What to investigate |
| Expensive application processing | High CPU usage queries and execution history |
| Memory-heavy workload | Memory consumption and high memory usage queries |
| Surprisingly frequent activity | Requests per second and most frequent queries |
| Slow responses with little apparent CPU work | Blocked queries and longest-running queries |
| Growing database storage | Allocated size and largest tables |
Those views are documented in the Performance Dashboard guide. Microsoft also makes a crucial distinction: its CPU trends cover user queries, excluding provisioning, maintenance, and other background work. The dashboard doesn’t directly correlate with Fabric consumption.
I would use it to find queries worth investigating, then return to Capacity Metrics to assess consumption. Most SQL database operations are interactive with five-minute smoothing, according to Microsoft’s monitoring walkthrough. Allow for that when comparing timelines.
A practical limit for development workloads
Microsoft also documents a Max vCore limit setting under Settings > Compute, (still in preview at the moment of writing). The available limits have these associated resource ceilings:
| Max vCores | Max memory | Max storage |
| 2 | 6 GB | 512 GB |
| 4 | 12 GB | 756 GB |
| 32, default | 96 GB | 4 TB |
Autoscaling stays within the configured limits. Reducing the vCore ceiling also reduces the storage ceiling; Microsoft notes that a lower setting cannot be enforced if the database is already too large. Control compute usage.
For a development database, I’d consider this setting alongside a representative test run. A lower peak doesn’t establish a lower total and the workload’s duration still matters in the calculation.
For your own database, pick an ordinary hour. Include the application calls, the quiet periods, and whatever happens after users leave. Compare its CU consumption with CPU, memory, and query activity. That gives you something useful to tune, and a much better explanation than counting queries alone.
Thanks for reading!
Special thanks to Sukhwant Kaur from the SQL database in Fabric product team for the proofreading and feedback on the article.
Last Updated on September 16, 2026 by Nikola



Francesco Mantovani
Amazing. Thank you so much.