If you are using Microsoft Fabric, you’ve probably received the same email notification as me:)
I’m talking about the one about Fabric Data Warehouse and SQL analytics endpoint metering.
Starting in August 2026, Warehouse CU consumption is moving away from the current per-query CPU-time model and toward a per-workspace, virtual-node time model.
In plain English: Fabric will care less about how much CPU a specific query burned, and more about how much Warehouse compute was allocated, for how long, in that workspace.
And this, in my opinion, is where things get interesting, because this is not just a pricing footnote. This changes how we should think about Fabric Warehouse workloads.
What is changing?
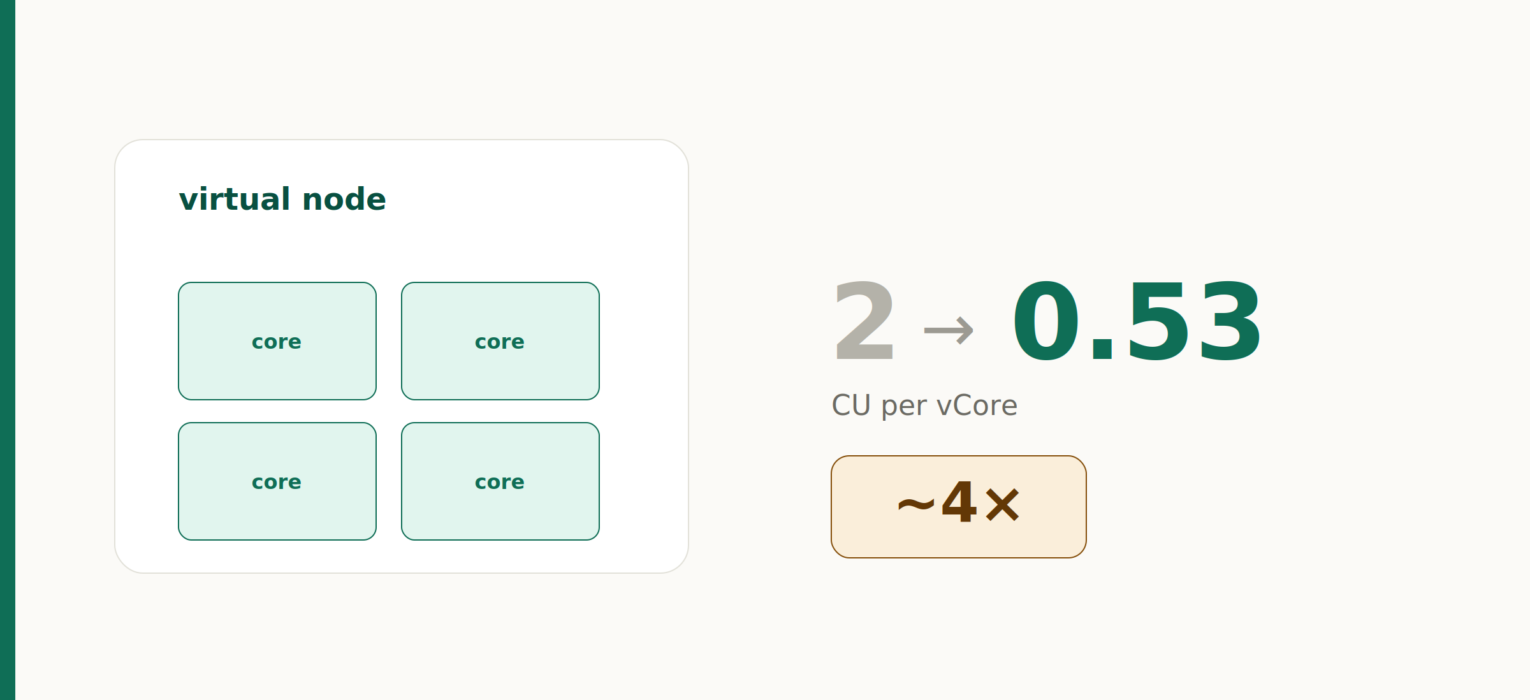
According to Microsoft’s email notification, the new unit is a virtual node. One virtual node is a 4-core unit of Warehouse compute, automatically allocated and scaled by Fabric based on workload demand.
The email also says the CU rate changes from 2 CU per vCore to 0.53 CU per vCore.
So, the new rough math is:
1 virtual node = 4 vCores
1 vCore = 0.53 CUs
1 virtual node = 2.12 CUs while active
There is also a one-minute minimum per workspace. If activity lasts less than one minute, the virtual-node uptime is rounded up to one minute. After that, it is measured per second.
This is the part everyone should underline twice.
The new model changes the metering logic for Fabric warehouse (and SQL endpoint of the lakehouse) workload, but not the capacity model itself. Your F-SKU, reservations, and capacity admin experience remain the same. What changes is how Warehouse activity eats into that capacity.
Why this matters for workloads
The old model was closer to “how much CPU did this query consume?”
The new model is closer to “how much compute did Fabric allocate to this workspace, and for how long?”
That sounds subtle, but it’s not:)
Dense workloads should generally like this model. Think ETL windows, scheduled transformations, report refresh waves, or repeated analytical queries that keep Warehouse compute busy once it has started. If the virtual nodes are doing useful work most of the time they are allocated, the lower CU-per-vCore rate can be very attractive.
Sparse workloads are where the pain may show up. Think one tiny query every few minutes. Metadata checks, monitoring probes, a dashboard that wakes the Warehouse, asks a small question, then disappears. Those workloads may now pay for allocated compute time that is only lightly used.
In other words: the new question is not only “is my query efficient?” It is also “am I keeping the allocated compute busy?”
That is a very different mental model in the first place.
“Wait, this sounds familiar…”
If your thoughts were like this from the heading above…Well, that’s because it IS familiar.
This brings Fabric Warehouse closer to how the other big cloud data platforms already think about SQL compute.
How it compares to Snowflake?
Snowflake charges virtual warehouses based on warehouse size, number of clusters, and how long the compute runs. Snowflake’s documentation says there is a 60-second minimum when compute resources are provisioned, and after that, billing is per second.
That is very close in spirit to the Fabric update:
- Snowflake: warehouse compute runs, credits accrue.
- Fabric: virtual nodes run for a workspace, CUs accrue.
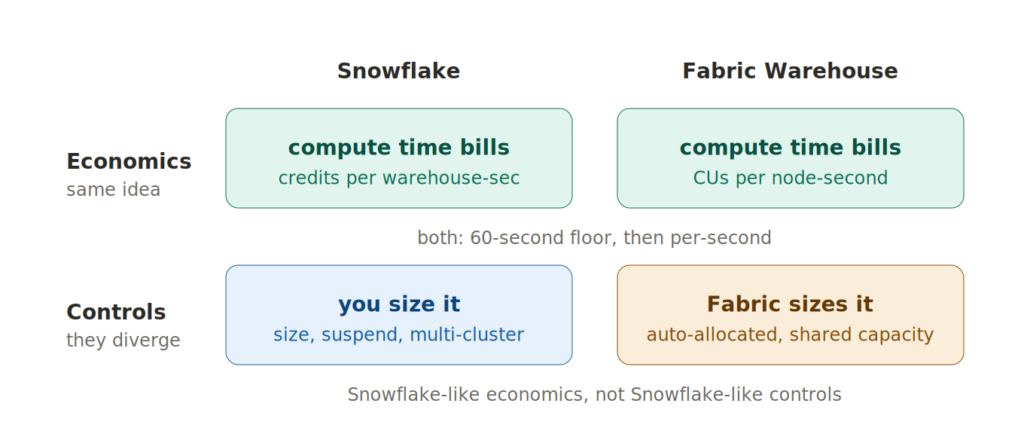
The similarity is the important part: both models reward dense usage and punish constant start-stop-start-stop patterns.
But there is a big difference.
In Snowflake, I explicitly choose the virtual warehouse size, auto-suspend settings, and, if needed, multi-cluster behavior. The warehouse is the cost-and-performance boundary.
In Fabric, Microsoft is saying the virtual nodes are automatically allocated and scaled by Fabric. The workspace becomes much more important as the practical metering boundary, but you do not manually size it like a Snowflake warehouse.
So, Fabric is becoming Snowflake-like in economics, but not Snowflake-like in controls.
How it compares to Databricks?
Databricks SQL Warehouses are also familiar territory here. Databricks documents SQL warehouses as compute resources for queries, recommends serverless SQL warehouses when available, and describes serverless SQL warehouses as dynamically managing resources using Intelligent Workload Management. Databricks also states that pricing uses per-second granularity.
Again, very similar direction:
- Databricks serverless SQL: managed compute scales for query demand.
- Fabric Warehouse: virtual nodes are automatically allocated and scaled for Warehouse demand.
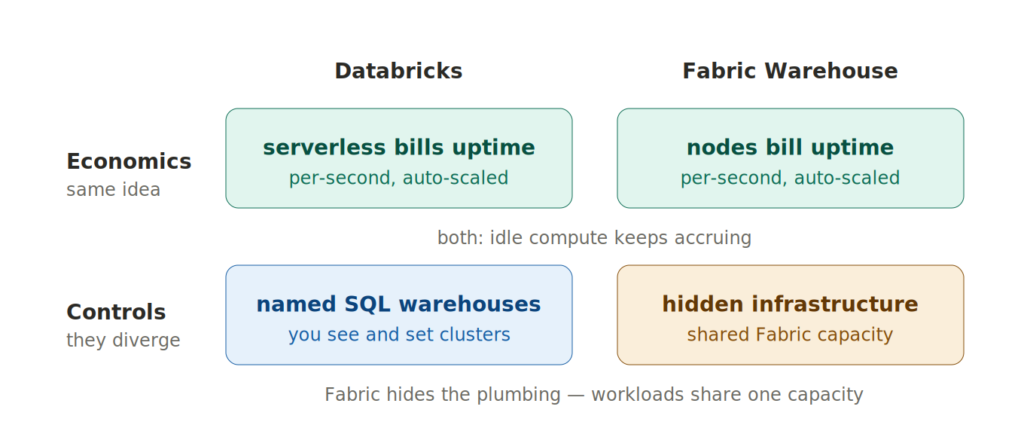
The difference is again in the packaging.
Databricks still exposes SQL warehouses as named compute resources with settings such as cluster size, scaling, and auto-stop. Its documentation also states that idle SQL warehouses continue to accumulate DBU and cloud instance charges until stopped.
Fabric hides more of that infrastructure layer. You still consume from a shared Fabric capacity, alongside Power BI, Data Factory, notebooks, Eventhouse, and everything else living on the same capacity.
That makes Fabric’s version both elegant and slightly dangerous. Elegant, because there is less compute plumbing to manage. Dangerous, because noisy Warehouse behavior can affect the same shared capacity that your other Fabric workloads depend on.
Example 1: short burst, small query
The examples below are not price estimates. They are just mechanical CU-second calculations using the unit definitions from the email. In real life, Fabric decides how many virtual nodes to allocate.
Imagine a workspace wakes up one virtual node for a small query that runs for 20 seconds.
Under the new model, the one-minute minimum applies (20 seconds are rounded to 60 seconds):
1 virtual node x 60 seconds x 2.12 CUs = 127.2 CU-seconds
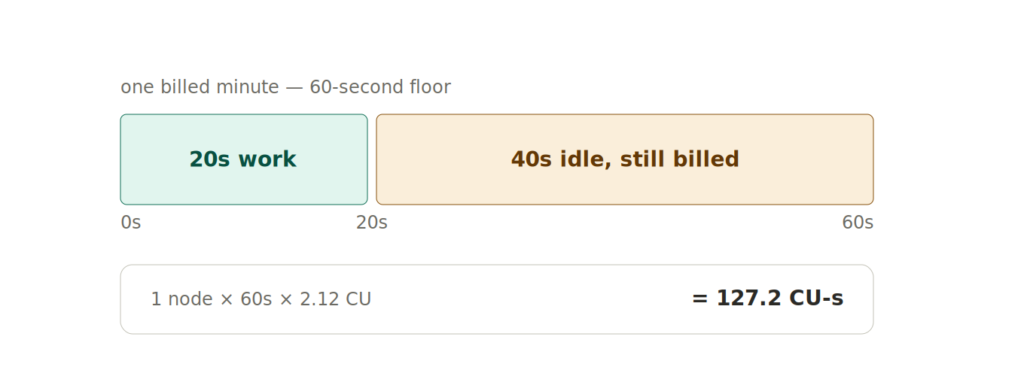
If the query used very little CPU under the current model, this may be more expensive than before. That is the sparse workload problem in one line: you are paying for the compute allocation window, not only the useful CPU work inside it.
This is the dashboard-with-one-lonely-query scenario.
Example 2: same start, more useful work
Now imagine the same workspace runs several queries inside that first minute. The virtual node is already allocated, and more useful work gets packed into the same billing window.
The new charge for that first virtual node-minute is still:
1 virtual node x 60 seconds x 2.12 CUs = 127.2 CU-seconds
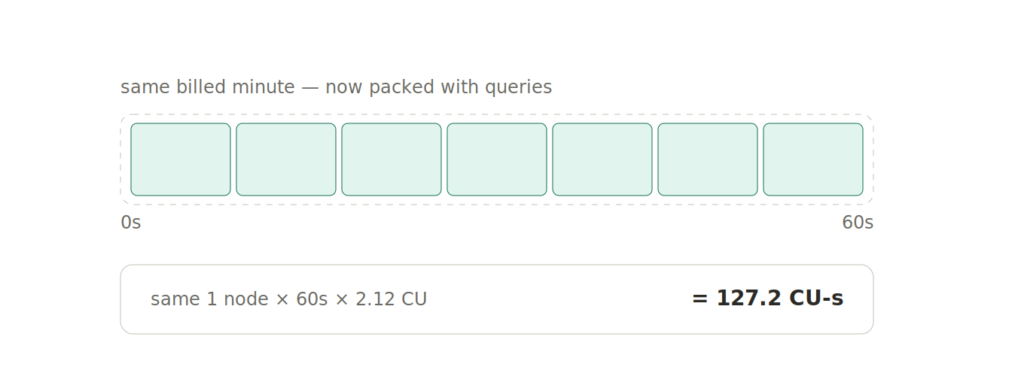
But now five or ten queries share that cost window. This is why workload density matters. The platform is not only asking whether each query is efficient. It is asking whether the workspace makes good use of the compute while it is alive.
Example 3: steady ETL window
Now take a more warehouse-shaped workload: 10 virtual nodes running for 20 minutes during an ETL job.
10 virtual nodes x 1,200 seconds x 2.12 CUs = 25,440 CU-seconds
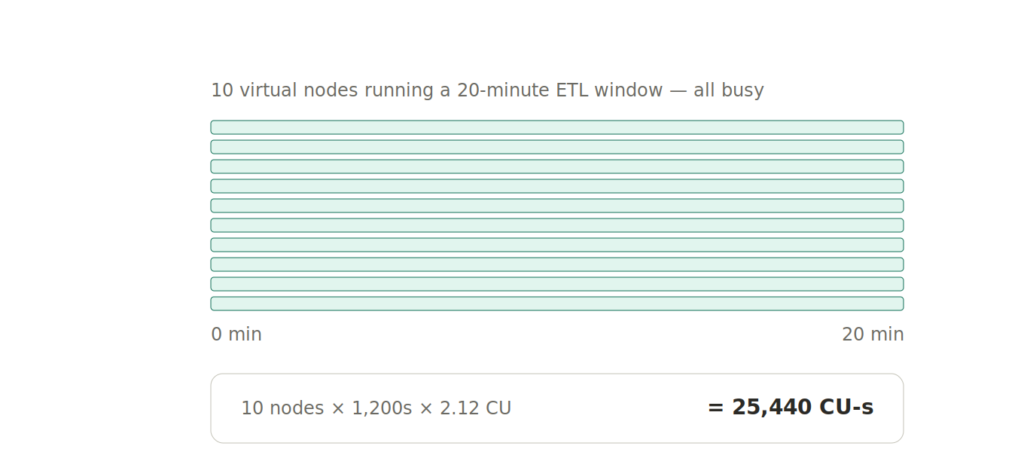
There is no one-minute weirdness here, because the workload runs long enough that the floor is irrelevant.
This is where the new model can look good. If those nodes are busy doing scans, joins, aggregations, statistics, and optimization work, the lower CU-per-vCore rate can reduce consumption compared with CPU-time accounting.
But if the nodes are allocated while the workload waits on something else, the bill keeps ticking.
Example 4: many workspaces, same tiny workload
This is the example I would watch carefully.
Suppose 10 different workspaces each run a tiny query for 20 seconds. Each workspace hits the one-minute minimum.
10 workspaces x 1 virtual node x 60 seconds x 2.12 CUs = 1,272 CU-seconds
Now compare that with one workspace running those same small queries close together inside one active minute:
1 workspace x 1 virtual node x 60 seconds x 2.12 CUs = 127.2 CU-seconds
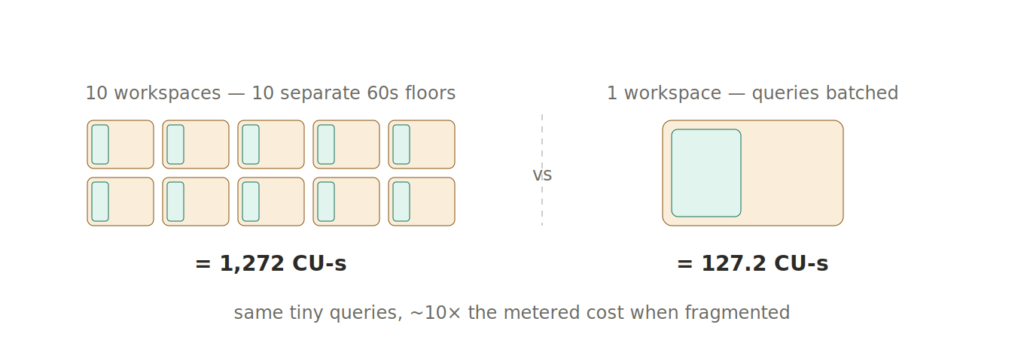
Same tiny analytical intent, but a very different metering shape.
This does not mean “put everything in one workspace.” Governance, security, lifecycle, deployment, and ownership still matter. But it does mean that workspace design may become part of cost design.
My thoughts
This change makes Fabric Warehouse look more like the rest of the cloud data platform world.
Snowflake has been teaching us for years that compute time matters. Databricks has been pushing SQL users toward managed, elastic, serverless compute. Fabric is now moving Warehouse CU accrual in the same direction: allocated compute over time.
The good news: dense, stable workloads may get cheaper.
The bad news: sparse, chatty, fragmented workloads may get a surprise.
Hence, the practical takeaway is simple:
Stop looking only at expensive queries. Start looking at active compute windows.
For Fabric Warehouse, I would review:
- Workspaces with many short Warehouse or SQL endpoint activities
- Dashboards or monitoring jobs that wake compute for small queries
- System-generated activity, since Microsoft documents that Warehouse Query and SQL Endpoint Query include both user-generated and system-generated statements
- ETL windows where the compute is probably dense and may benefit from the new model
- Workspace fragmentation that creates repeated one-minute minimums
The old question was: “Which query burned the most CPU?”
The new question is: “When Fabric allocated Warehouse compute for this workspace, did we actually use it?”
Thanks for reading!
Sources
- Microsoft email notification: Fabric Data Warehouse virtual-node CU metering update, rolling out August 2026.
- Microsoft Learn: Billing and utilization reporting in Fabric Data Warehouse
- Microsoft Learn: Fabric operations
- Snowflake Docs: Warehouse considerations
- Databricks Docs: SQL warehouse sizing, scaling, and queuing behavior
- Databricks Docs: Create a SQL warehouse
- Databricks: Pricing
Thanks to Claude for creating these nice-looking illustrations.
Last Updated on July 1, 2026 by Nikola