

This article is part of the series related to mastering DP-600 certification exam: Implementing Analytics Solutions Using Microsoft Fabric
Table of contents
Star schema all the things! This “maxim”, coined by my fellow Data Platform MVP, Koen Verbeeck (X) is something that every BI professional should always keep in mind! And, for a good reason, which was explained and defined by many people who are definitely smarter than me. Don’t forget – technologies and tools are coming and passing, we keep hearing messages that “star schema is dead” and similar, but the reality can’t be more different – 30 years after it was introduced by Ralph Kimball and his colleagues, the concept of star schema is still absolutely relevant when modeling your data for analytical workloads. I could go even further and say that it’s a de facto standard for analytical data modeling scenarios, but let’s not spread the flame because the purpose of this article is not to debate if the star schema is still relevant:)
But, what is a star schema in the first place? I have good and bad news for you:)…The bad news is that I’m not covering it in this article because this one focuses on explaining how to implement a star schema in Fabric Lakehouse (assuming that you already know what star schema is). The good news is: I’ve already written about it, so go and read this article first, if you’re not sure what star schema represents in the world of data modeling…
In one of the previous articles, I also shown how to implement a star schema in Power BI, by leveraging Power Query Editor.
Now, let’s get our hands dirty and build a star schema by using PySpark in the Fabric notebook!
Setting the stage
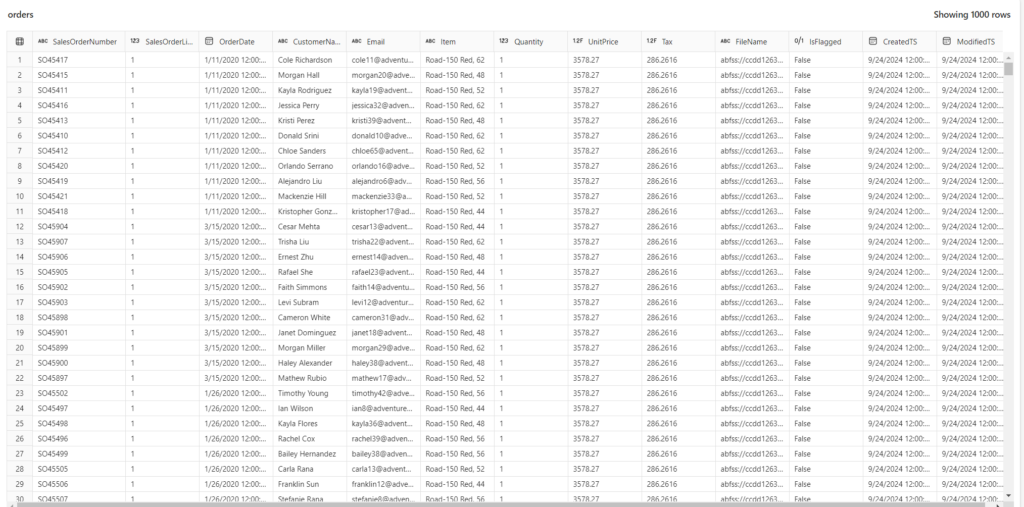
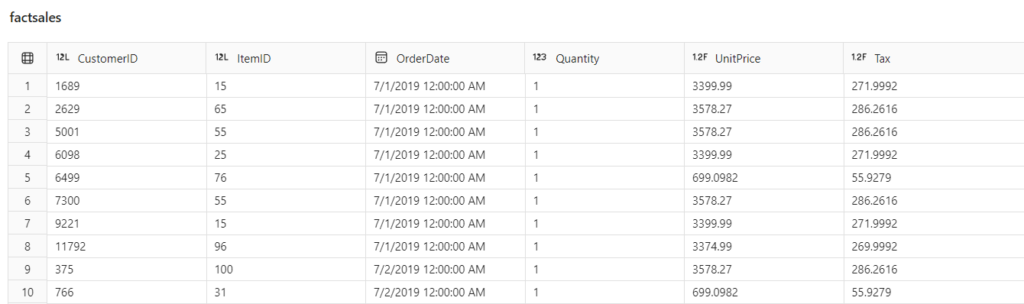
In this blog post, I’m going to use a sample dataset that you can download from Microsoft’s GitHub here. It consists of three separate csv files, containing orders from three different years. Once you unzip the data, you may notice that the data is structured, but it’s not cleaned, and the “model” is, in fact, a single flat table:
Since the skill measured for the exam is called “Implement a star schema in the Lakehouse”, I’m intentionally skipping all the preceding operations and activities – namely data cleaning and data validation – which should be done in advance. I may cover the entire workflow in one of the next articles
Generally speaking, a star schema should be implemented in your final Lakehouse layer – you can call it a gold layer if you wish – I prefer to call it an enriched or curated layer. If you are not sure what I’m talking about, I suggest you first read my previous article about organizing your lakehouse into so-called medallion architecture.
From now on, I’ll assume that you have already cleaned and validated the data in the lakehouse and that you’re ready to put the “icing on the cake” by building a star schema model for downstream consumption…
Let’s shoot for the star!
Disclaimer: In this example, I’m using a Fabric notebook to transform the data. You can also transform the data by using other tools in Microsoft Fabric, such as Dataflows Gen2 (if you prefer a low-code approach) and/or T-SQL scripts. I’ll cover all the options in detail in one of the next articles.
We will use our Orders table as a blueprint for creating a star schema model.
For the starter, we need to load the orders data into a dataframe, a special structure that exists in PySpark for storing the data.
 # Load data to the dataframe that will be used as a blueprint for star schema model
 df = spark.read.table("orders")
I’ll start by creating a dimcustomer dimension table. The first step is to create a delta table itself in the Lakehouse:
 from pyspark.sql.types import *
 from delta.tables import *

 # Create customer dimension delta table
 DeltaTable.createIfNotExists(spark) \
     .tableName("dimcustomer") \
     .addColumn("CustomerName", StringType()) \
     .addColumn("Email",  StringType()) \
     .addColumn("First", StringType()) \
     .addColumn("Last", StringType()) \
     .addColumn("CustomerID", LongType()) \
     .execute()
The code above will check if the table dimcustomer already exists, and if not, it will create a table in the Lakehouse. Please keep in mind that this is just a placeholder for the customer data, since we just defined a table and its column data types.
Next, I’ll create a dataframe dfdimcustomer, which removes duplicates from the CustomerName and Email columns. Then, I’ll add new columns First and Last, where we extract the first and last customer names from the CustomerName column. WithColumn PySpark method adds a new column if the column with the same name doesn’t already exist in the dataframe, or overwrites the existing column with the same name.
 from pyspark.sql.functions import *

 # Create customer dataframe

 dfdimCustomer = df.dropDuplicates(["CustomerName","Email"]).select(col("CustomerName"),col("Email")) \
     .withColumn("First",split(col("CustomerName"), " ").getItem(0)) \
     .withColumn("Last",split(col("CustomerName"), " ").getItem(1))
Finally, we have to create a surrogate key in the dfdimcustomer dataframe and insert the data from the dataframe into our dimcustomer table:
# Create a surrogate key CustomerID

from pyspark.sql.functions import *

 dfdimCustomer_temp = spark.read.table("dimcustomer")

 MAXCustomerID = dfdimCustomer_temp.select(coalesce(max(col("CustomerID")),lit(0)).alias("MAXCustomerID")).first()[0]

 dfdimCustomer = dfdimCustomer.join(dfdimCustomer_temp,(dfdimCustomer.CustomerName == dfdimCustomer_temp.CustomerName) & (dfdimCustomer.Email == dfdimCustomer_temp.Email), "left_anti")

 dfdimCustomer = dfdimCustomer.withColumn("CustomerID",monotonically_increasing_id() + MAXCustomerID + 1)
# Merge command is used for UPSERT operation: update records that changed and insert new values

from delta.tables import *

deltaTable = DeltaTable.forPath(spark, 'Tables/dimcustomer')

dfUpdates = dfdimCustomer

deltaTable.alias('silver') \
  .merge(
    dfUpdates.alias('updates'),
    'silver.CustomerName = updates.CustomerName AND silver.Email = updates.Email'
  ) \
   .whenMatchedUpdate(set =
    {

    }
  ) \
 .whenNotMatchedInsert(values =
    {
      "CustomerName": "updates.CustomerName",
      "Email": "updates.Email",
      "First": "updates.First",
      "Last": "updates.Last",
      "CustomerID": "updates.CustomerID"
    }
  ) \
  .execute()
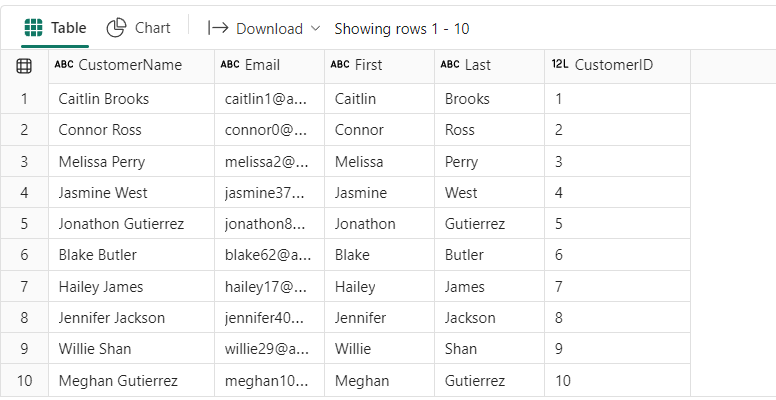
We can now check how the data in the dimcustomer table looks like:
%%sql
SELECT *
FROM dimcustomer
ORDER BY CustomerID
LIMIT 10;
As you might have noticed, I’m using SparkSQL in this notebook cell – it’s not mandatory, as you can check the data also by using PySpark (or Scala) – this is just to show you how you can combine various languages inside one single notebook.
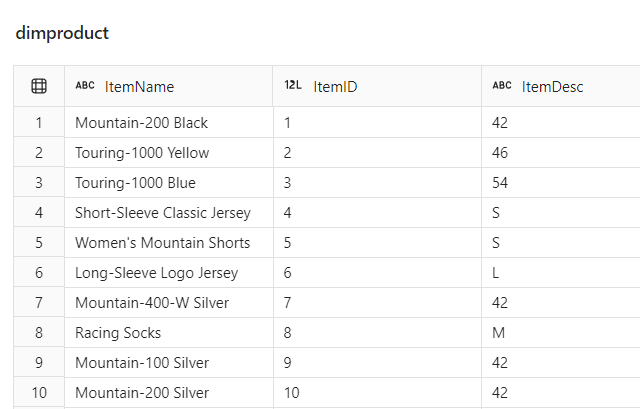
Create Product dimension
By following a similar logic, we will now create a dimproduct table in the lakehouse and populate it with the data from our orders table:
# Create a Product dimension

from pyspark.sql.types import *
from delta.tables import *

DeltaTable.createIfNotExists(spark) \
    .tableName("dimproduct") \
    .addColumn("ItemName", StringType()) \
    .addColumn("ItemID", LongType()) \
    .addColumn("ItemDesc", StringType()) \
    .execute()
Next, we will extend the product dimension with two additional columns: ItemName and ItemDesc, which we are deriving from the existing Item column:
from pyspark.sql.functions import *

# Create product dataframe

dfdimProduct_silver = df.dropDuplicates(["Item"]).select(col("Item")) \
    .withColumn("ItemName",split(col("Item"), ", ").getItem(0)) \
    .withColumn("ItemDesc",when((split(col("Item"), ", ").getItem(1).isNull() | (split(col("Item"), ", ").getItem(1)=="")),lit("")).otherwise(split(col("Item"), ", ").getItem(1)))
Finally, let’s create a surrogate key and insert the data:
# Create a surrogate key ItemID

from pyspark.sql.functions import *

#dfdimProduct_temp = dfdimProduct_silver
dfdimProduct_temp = spark.read.table("dimProduct")

MAXProductID = dfdimProduct_temp.select(coalesce(max(col("ItemID")),lit(0)).alias("MAXItemID")).first()[0]

dfdimProduct_gold = dfdimProduct_silver.join(dfdimProduct_temp,(dfdimProduct_silver.ItemName == dfdimProduct_temp.ItemName) & (dfdimProduct_silver.ItemDesc == dfdimProduct_temp.ItemDesc), "left_anti")

dfdimProduct_gold = dfdimProduct_gold.withColumn("ItemID",monotonically_increasing_id() + MAXProductID + 1)
# Merge command is used for UPSERT operation: update records that changed and insert new values

from delta.tables import *

deltaTable = DeltaTable.forPath(spark, 'Tables/dimproduct')

dfUpdates = dfdimProduct_gold

deltaTable.alias('silver') \
  .merge(
        dfUpdates.alias('updates'),
        'silver.ItemName = updates.ItemName AND silver.ItemDesc = updates.ItemDesc'
        ) \
        .whenMatchedUpdate(set =
        {

        }
        ) \
        .whenNotMatchedInsert(values =
         {
          "ItemName": "updates.ItemName",
          "ItemDesc": "updates.ItemDesc",
          "ItemID": "updates.ItemID"
          }
          ) \
          .execute()
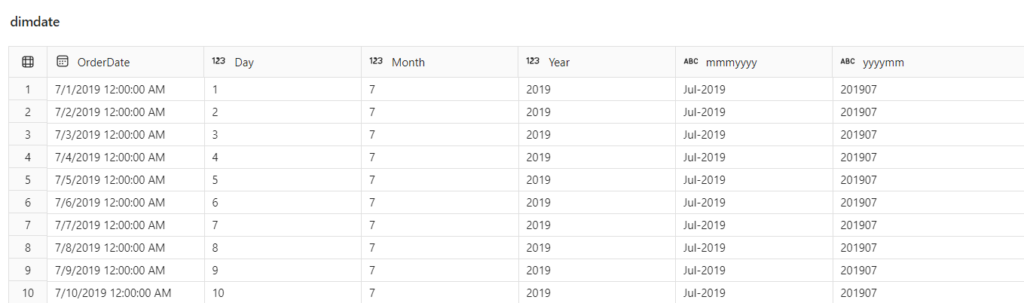
Create Date dimension
Our last dimension will be dimdate.
 from pyspark.sql.types import *
 from delta.tables import*

 # Define the schema for the dimdate_gold table
 DeltaTable.createIfNotExists(spark) \
     .tableName("dimdate") \
     .addColumn("OrderDate", DateType()) \
     .addColumn("Day", IntegerType()) \
     .addColumn("Month", IntegerType()) \
     .addColumn("Year", IntegerType()) \
     .addColumn("mmmyyyy", StringType()) \
     .addColumn("yyyymm", StringType()) \
     .execute()
Please observe how we will leverage a single column from the original Orders table (OrderDate) to create a whole bunch of attributes for the date dimension.
 from pyspark.sql.functions import *

 # Create dataframe for dimDate

 dfdimDate_gold = df.dropDuplicates(["OrderDate"]).select(col("OrderDate"), \
         dayofmonth("OrderDate").alias("Day"), \
         month("OrderDate").alias("Month"), \
         year("OrderDate").alias("Year"), \
         date_format(col("OrderDate"), "MMM-yyyy").alias("mmmyyyy"), \
         date_format(col("OrderDate"), "yyyyMM").alias("yyyymm"), \
     ).orderBy("OrderDate")
The code snippet above will remove duplicates from the OrderDate column and then create new columns whose value is being calculated by applying built-in PySpark functions for date manipulation.
Let’s now insert the data from the dataframe into dimdate table:
 from delta.tables import *

 deltaTable = DeltaTable.forPath(spark, 'Tables/dimdate')

 dfUpdates = dfdimDate_gold

 deltaTable.alias('silver') \
   .merge(
     dfUpdates.alias('updates'),
     'silver.OrderDate = updates.OrderDate'
   ) \
    .whenMatchedUpdate(set =
     {

     }
   ) \
  .whenNotMatchedInsert(values =
     {
       "OrderDate": "updates.OrderDate",
       "Day": "updates.Day",
       "Month": "updates.Month",
       "Year": "updates.Year",
       "mmmyyyy": "updates.mmmyyyy",
       "yyyymm": "yyyymm"
     }
   ) \
   .execute()
Please observe that we are not creating a surrogate key for the date dimension, since we’ll be using the OrderDate as a natural key.
Create FactSales table
Fantastic! Now that we’ve created our three dimension tables, the final step is to create a fact table that will contain only measurements (numeric values) and foreign key columns to our dimension tables:
from pyspark.sql.types import *
from delta.tables import *

DeltaTable.createIfNotExists(spark) \
    .tableName("factsales") \
    .addColumn("CustomerID", LongType()) \
    .addColumn("ItemID", LongType()) \
    .addColumn("OrderDate", DateType()) \
    .addColumn("Quantity", IntegerType()) \
    .addColumn("UnitPrice", FloatType()) \
    .addColumn("Tax", FloatType()) \
    .execute()
The next step is to create a dataframe for the fact table, where we perform all of the necessary transformations to bring consolidated data into the fact table:
from pyspark.sql.functions import *

dfdimCustomer_temp = spark.read.table("dimCustomer")
dfdimProduct_temp = spark.read.table("dimProduct")

df = df.withColumn("ItemName",split(col("Item"), ", ").getItem(0)) \
    .withColumn("ItemDesc",when((split(col("Item"), ", ").getItem(1).isNull() | (split(col("Item"), ", ").getItem(1)=="")),lit("")).otherwise(split(col("Item"), ", ").getItem(1))) \


# Create a dataframe

dffactSales_gold = df.alias("df1").join(dfdimCustomer_temp.alias("df2"),(df.CustomerName == dfdimCustomer_temp.CustomerName) & (df.Email == dfdimCustomer_temp.Email), "left") \
        .join(dfdimProduct_temp.alias("df3"),(df.ItemName == dfdimProduct_temp.ItemName) & (df.ItemDesc == dfdimProduct_temp.ItemDesc), "left") \
    .select(col("df2.CustomerID") \
        , col("df3.ItemID") \
        , col("df1.OrderDate") \
        , col("df1.Quantity") \
        , col("df1.UnitPrice") \
        , col("df1.Tax") \
    ).orderBy(col("df1.OrderDate"), col("df2.CustomerID"), col("df3.ItemID"))
# Insert data into fact table

from delta.tables import *

deltaTable = DeltaTable.forPath(spark, 'Tables/factsales')

dfUpdates = dffactSales_gold

deltaTable.alias('silver') \
  .merge(
    dfUpdates.alias('updates'),
    'silver.OrderDate = updates.OrderDate AND silver.CustomerID = updates.CustomerID AND silver.ItemID = updates.ItemID'
  ) \
   .whenMatchedUpdate(set =
    {

    }
  ) \
 .whenNotMatchedInsert(values =
    {
      "CustomerID": "updates.CustomerID",
      "ItemID": "updates.ItemID",
      "OrderDate": "updates.OrderDate",
      "Quantity": "updates.Quantity",
      "UnitPrice": "updates.UnitPrice",
      "Tax": "updates.Tax"
    }
  ) \
  .execute()
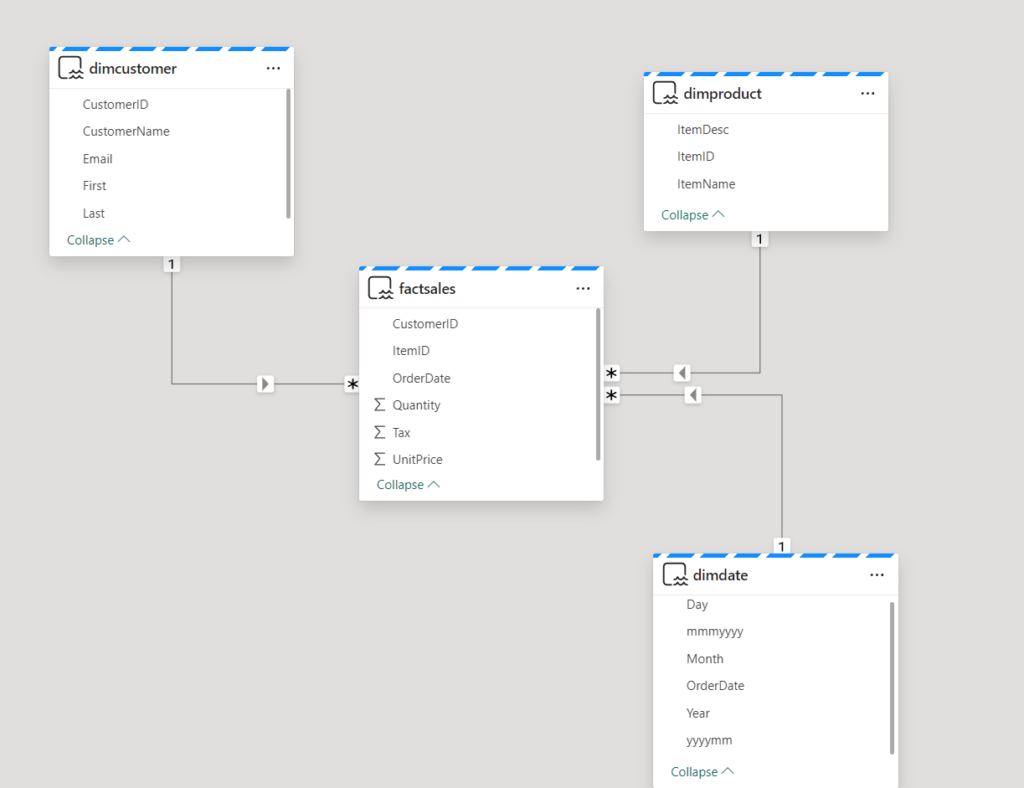
From here, we can simply create relationships between the fact table and dimension tables and our star schema model is ready to shine! In the illustration below, you can spot how I created a Direct Lake model for Power BI reports:
Conclusion
As you’ve witnessed, we managed to create a proper star schema in just a few steps using PySpark code and Fabric notebook. After you establish star schema, Power BI reports should be more performant, but not only that – you’ll save yourself from the DAX complexity as well.
Thanks for reading!
Last Updated on September 30, 2024 by Nikola


Implementing a Star Schema in a Microsoft Fabric Lakehouse – Curated SQL
[…] Nikola Ilic builds a lakehouse: […]