This article is the part of the series related to mastering DP-500/DP-600 certification exam: Designing and Implementing Enterprise-Scale Analytics Solutions Using Microsoft Azure and Microsoft Power BI and Implementing Analytics Solutions Using Microsoft Fabric
Table of contents
DISCLAIMER: This is NOT a deep-dive article about DAX! The main purpose of this article is to help you get familiar with various tools for troubleshooting your DAX queries’ performance. If you want to learn and understand the DAX language, here is the list of my go-to resources to help you get on track:
- Jeffrey Wang’s famous article about DAX table cross-filtering
- sqlbi.com
- The Definitive Guide to DAX (2nd edition) – book for intermediate to advanced users
- Elements of DAX with Brian Grant
In the previous article of the series, we introduced a built-in feature in Power BI, Performance Analyzer, that can help you understand different metrics behind your report page performance, and quickly identify potential bottlenecks. However, Performance Analyzer is more than that – it also offers you the possibility to grab the DAX query generated to populate a certain visual and then leverage additional tools to troubleshoot that query!
The most common workflow when troubleshooting poor-performing Power BI reports is as follows:
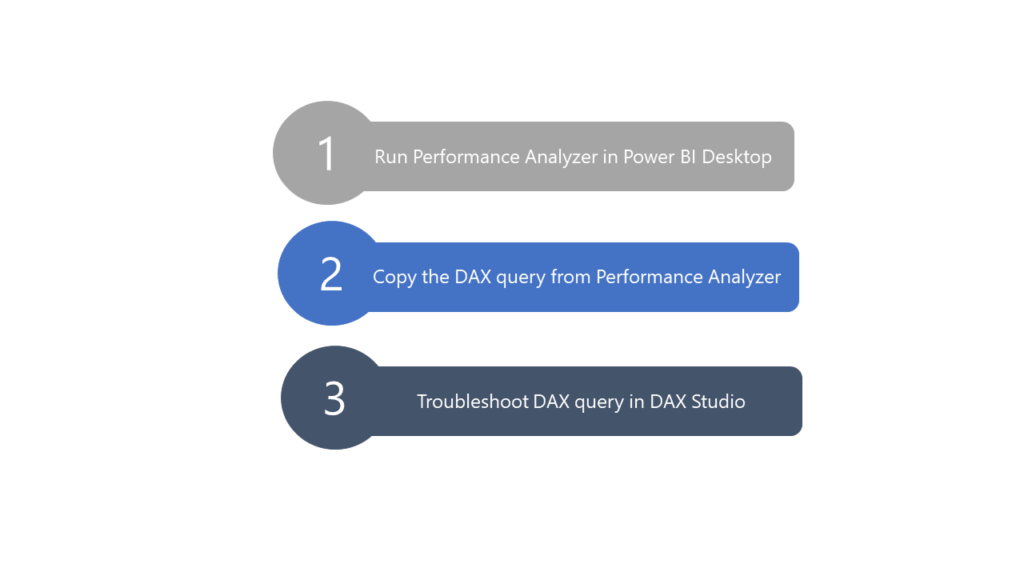
The first two steps are quite straightforward and simple. However, the third step requires not just knowing DAX syntax, but moreover a solid understanding of the Power BI internals and the way the engine works. You can find more details about two key components of the underlying architecture – Formula engine and Storage engine – in this article, and I strongly encourage you to read it before proceeding further, as it will help you to get a much better understanding of the steps and processes described here.
Understanding what to troubleshoot…
Now, the first question when you’re dealing with poor report performance is – what should I troubleshoot?! That’s a fair question. And, Performance Analyzer may help you to identify the main issue, which should be then investigated in more depth.
To illustrate, I’ll show you a simple report page with 3 visual elements on it – two simple card visuals and one table visual. The base metric is the total number of orders, while I’m also interested to see how many big orders my customers placed. What is a big order? Every order where the sales amount is greater than 500$.
Here is the measure definition I’m using to calculate a total number of orders with sales amount greater than 500:
Total BIG Orders Bad =
CALCULATE (
    DISTINCTCOUNT ( 'FactOnlineSales'[SalesOrderNumber] ),
    FILTER ( 'FactOnlineSales', 'FactOnlineSales'[SalesAmount] > 500 )
)
You’ll realize soon why I added “BAD” to the measure name…
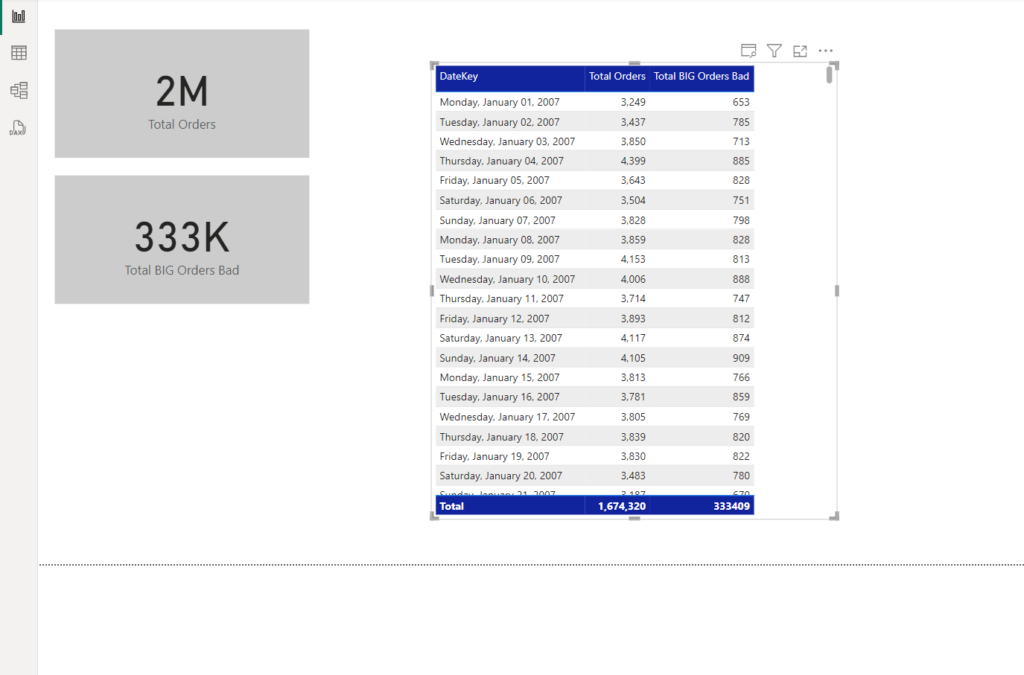
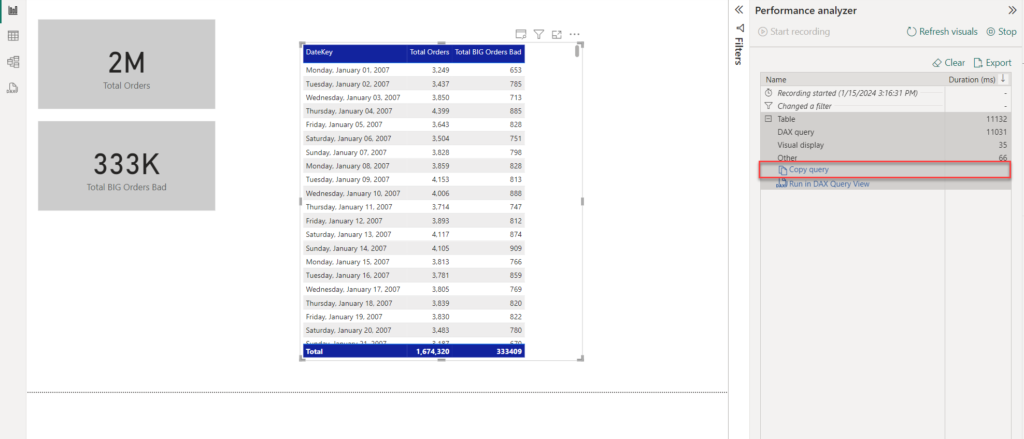
This is how my report page looks. So, let’s turn on Performance Analyzer and see how this report performs:
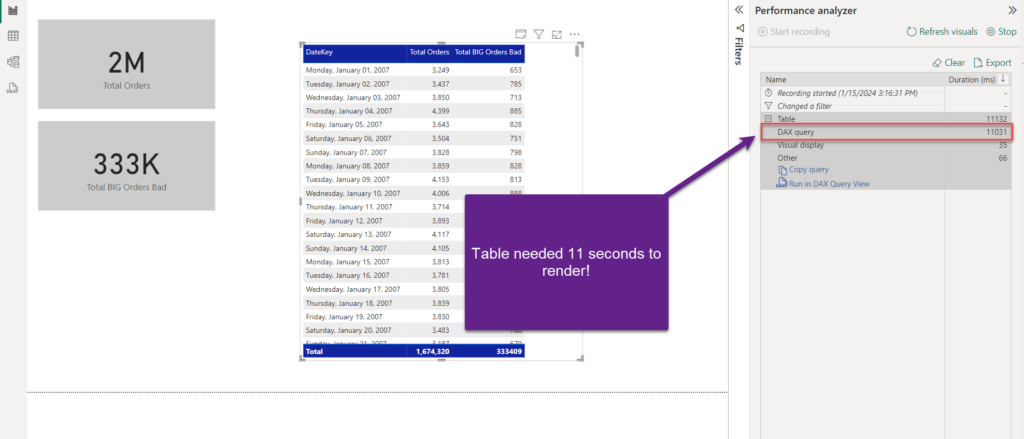
As you may see, card visuals were quite fast. But, the table visual needed more than 11 seconds to render! And, unlike in the previous article, when a lot of page visuals were the main cause for the slow report performance (remember Other value in the Performance Analyzer), this time Other is no issue at all! Almost all 11.1 seconds of the total time were spent on the DAX query – that means your “enemy” is probably the DAX query!
I’ve intentionally used the word probably, as it may happen that your dataset is simply too large, so even though your DAX code is optimal, the engine simply requires more time to scan the data and retrieve the results. However, in this case, my table has “only” 12.6 million rows, which is nothing special in terms of volume for the VertiPaq database.
So, we made a very important first step in the troubleshooting workflow – we identified the most problematic query! Therefore, we will forget about the card visuals at this moment and switch our focus to understanding why this table visual is so slow…
Step #2 Capture query plan and analyze with DAX Studio
Once you identify the problematic element, you can easily grab the query generated to populate that specific visual:
I’ll now move to DAX Studio, a fantastic free tool developed by Darren Gosbell. This tool is a must-have in your Power BI development toolbelt, and I’ll not waste much time describing all the amazing features and capabilities of the DAX Studio in this article.
The goal here is to show you how to leverage DAX Studio for troubleshooting DAX performance:

To be able to troubleshoot the query, you need to have more details about it. Therefore, I’ll turn on Query Plan and Server Timings features, to start tracing my query. The next step is to paste the query captured from Performance Analyzer in the main window of DAX Studio:
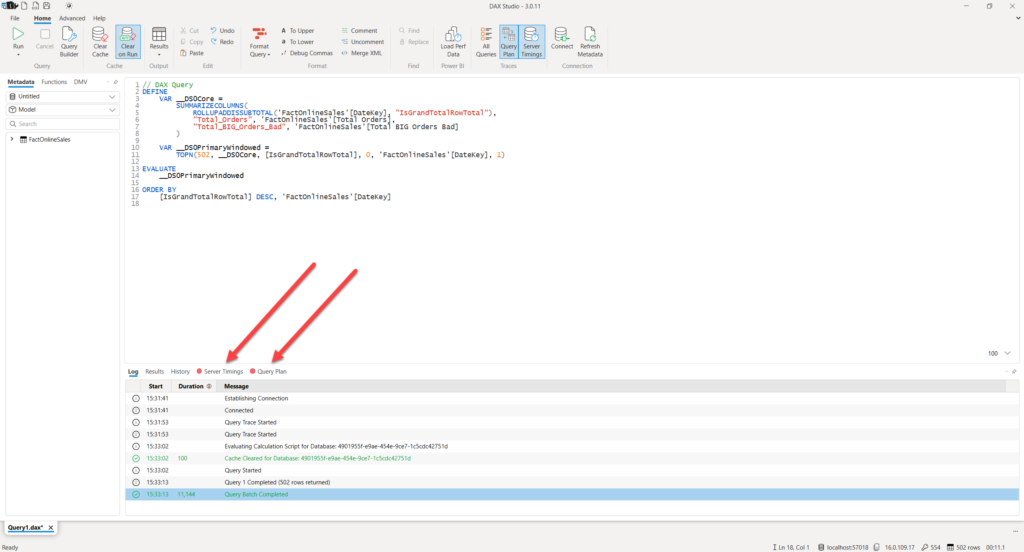
Let’s first take a look at the Server Timings tab:
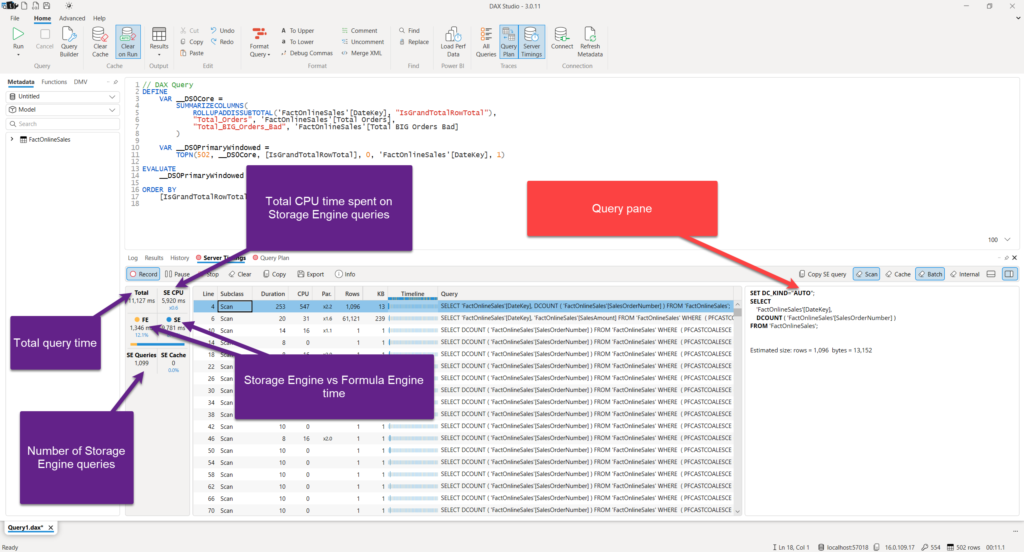
Let me stop for a few seconds and explain the key properties of the Server Timings tab:
- Total – shows the total query duration in milliseconds. In other words, you see that my query took 11.1 seconds to execute
- SE CPU – Amount of CPU time spent on Storage Engine queries. As Storage Engine works in a multi-threaded way, it’s able to achieve a certain degree of parallelism when running the queries. In our case, the query spent a total of 5.9 seconds of CPU time
- SE and FE – time split between Storage Engine and Formula Engine. Displayed both as a number value, and as a percentage
- SE Queries – number of Storage Engine queries
Let’s quickly review our specific calculation here. As you may notice, there are a whole bunch of queries in the central area of the Server Timings tab. Each of them is quite fast – takes less than 10 milliseconds! But, the problem is that are many of them…To be completely accurate, there are 1099 queries! When you multiply 1099 queries with ca. 10ms each, you get our ~11 seconds in total!
The main issue, in this case, is my inappropriate usage of the FILTER() function within the DAX formula used to calculate the total number of big orders. FILTER function accepts two types of objects as a first argument – table or column. If you pass the whole table as an argument (especially if the table is large), that means Storage Engine will have to scan and materialize a lot of data, like in my case, where I have a separate query running for every single date!
Now, because the only criteria in my calculation are based on the single column value, and that is the sales amount value, instead of passing the whole table as an argument, I can rewrite my calculation to apply filtering based only on one certain column:
Total BIG Orders Good =
CALCULATE (
    DISTINCTCOUNT ( 'FactOnlineSales'[SalesOrderNumber] ),
    KEEPFILTERS('FactOnlineSales'[SalesAmount] > 500)
)
The difference between the two formulas is subtle yet significant: in both cases, the calculation logic is the same, but different usage of the FILTER function may have a huge implication on the query performance. Unlike in the first definition, this time I’ll be using a KEEPFILTERS function – to keep only those rows where the sales amount is greater than 500. But, this time, instead of putting in the scope the whole table, I’m operating on a single column level.
I’ve created two separate tables in my Power BI report, to measure the performance of two calculations separately:
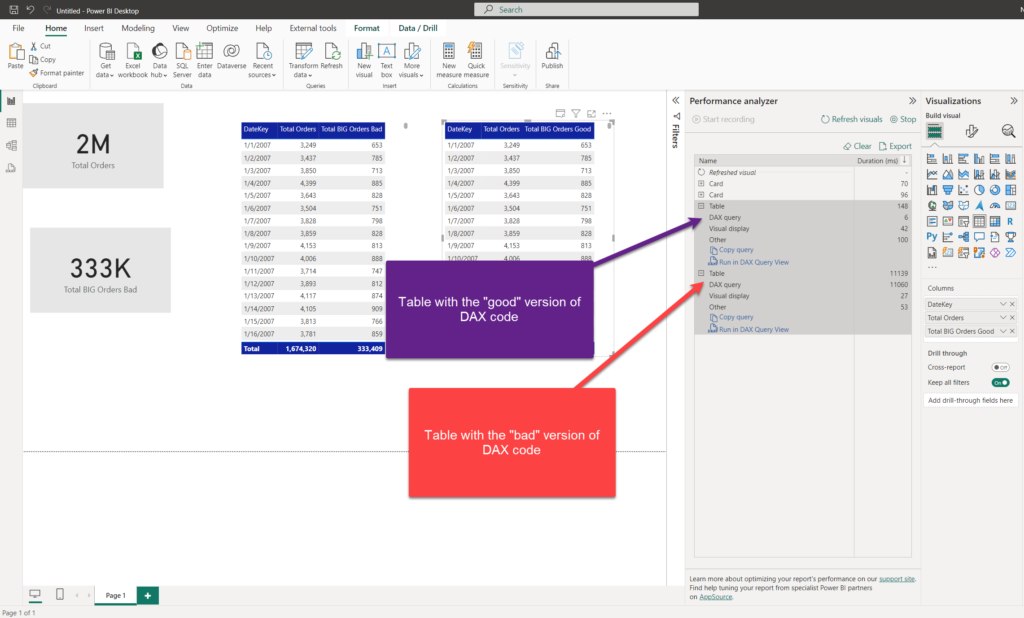
As you may notice, the “bad” table still needs more than 11 seconds to render, while the “good” twin took slightly more than 1/10 of the second! That’s a HUGE difference! Additionally, we can confirm that the results are exactly the same across both tables.
I’ll copy the faster query now and check how it looks in DAX Studio:
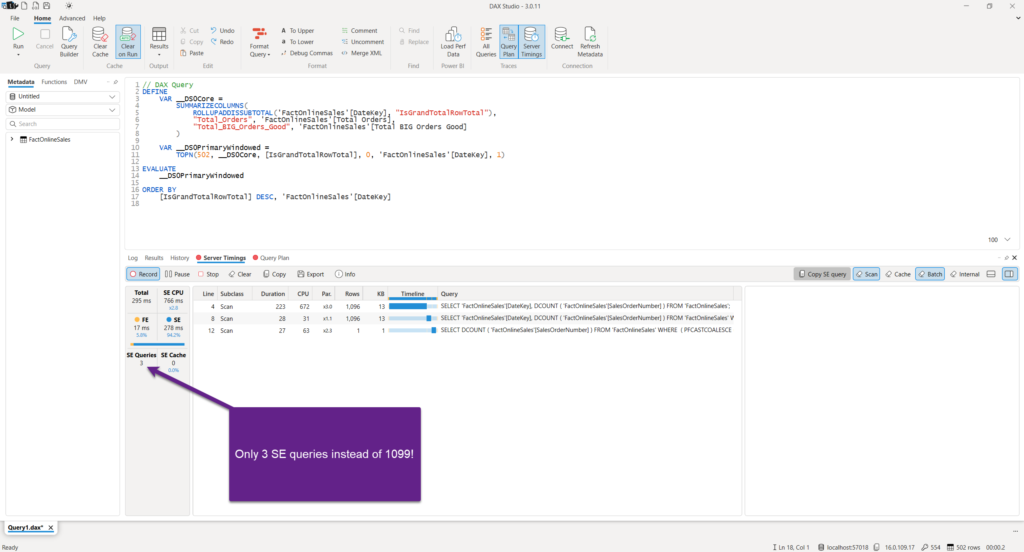
This time, instead of 1099 SE Queries, we have only 3 (2 of them are calculating totals)! And, instead of 5.9 seconds of SE CPU time, it’s now only 0.7 seconds! Finally, the total query execution time went down from 11.1 seconds to 295 milliseconds…
In addition to the Server Timings tab, you may also want to examine the Query Plan tab. Here, you can check the actual physical and logical query plan. Understanding query plans is out of the scope of this article, as this is a complex and challenging process even for seasoned Power BI professionals. However, it can be very helpful when trying to understand various steps performed by the Formula Engine in translating your DAX code to a sequence of physical operations that should be performed by the Storage Engine. Keep in mind that a physical query plan doesn’t necessarily have to follow the order of steps defined in the logical plan.

Now, this example wasn’t necessarily introduced to demonstrate how to optimize DAX formulas (even though, it certainly doesn’t hurt if you learned something in that regard too😉) – I wanted to show you how to leverage DAX Studio and its amazing built-in features, such as Server Timings and Query Plan, to understand the details about the process of data retrieval for your visuals.
Conclusion
Troubleshooting DAX queries is one of the most challenging tasks when working with Power BI! However, at the same time, this is the area where you can achieve the most significant performance improvements.
This is a high-level overview of the DAX optimization workflow:
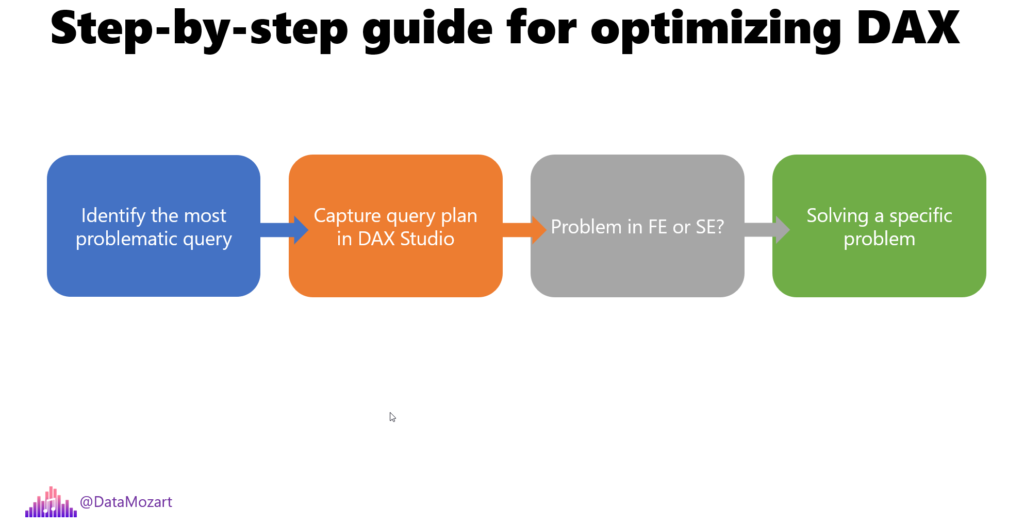
DAX Studio plays a key role in this workflow, because it enables you to troubleshoot potentially problematic DAX queries and understand in more depth what is happening behind the scenes when your report visuals are rendered.
Thanks for reading!
Last Updated on January 16, 2024 by Nikola