
A few weeks ago, I was tasked with optimizing a slow-performing Power BI report. Of course, there can be dozens of reasons why your Power BI report performs slow. I cover all of them in depth in my on-demand course, Mastering Power BI Performance Tuning.
In this post, I want to share with you the “low-hanging fruit” and how you can significantly improve Power BI semantic models by applying some very simple optimization techniques.
Setting the stage
For demo purposes, I’ll be using a fact table that contains the data about chats performed by a customer support department of the fictitious company Customer First. This table includes approximately 9 million rows, which is not considered a large table in the context of Power BI and analytical workloads. For the sake of simplicity, let’s pretend that our model consists of only this single table. Finally, a semantic model is configured as an Import mode model. If you want to learn how your data is stored in Power BI, I suggest you start by reading this article first.
Data was loaded into Power BI from the underlying data source (SQL Server database) as-is, without any additional optimizations applied.
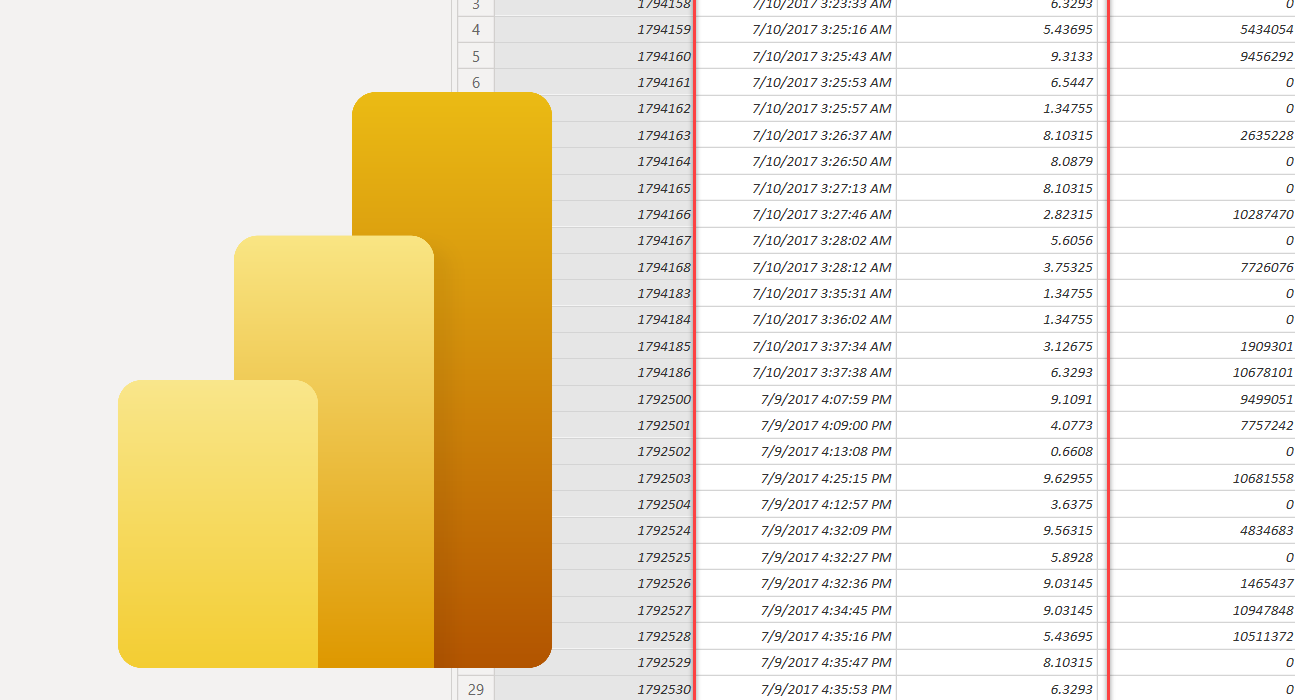
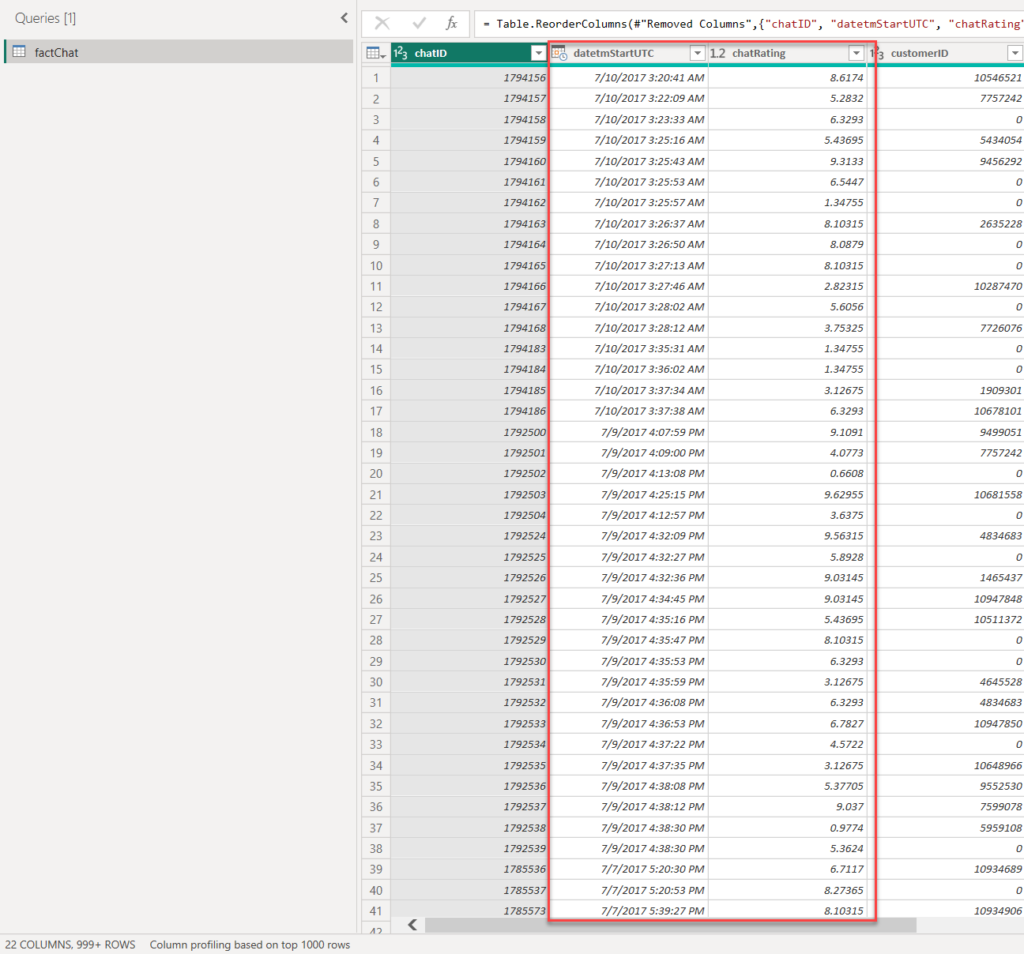
For this exercise, I’d like you to focus on two columns:
- datetmStartUTC – which stores the information about the chat starting date in UTC time. This column is of DateTime data type
- chatRating – chat satisfaction rating submitted by the customer. Stored as a decimal number with 5 digits precision
Before I show you how to optimize this semantic model in literally 5 clicks, let’s check our starting point and understand the metrics behind our model. For that purpose, I’ll use a fantastic free tool, DAX Studio and its built-in VertiPaq Analyzer feature.
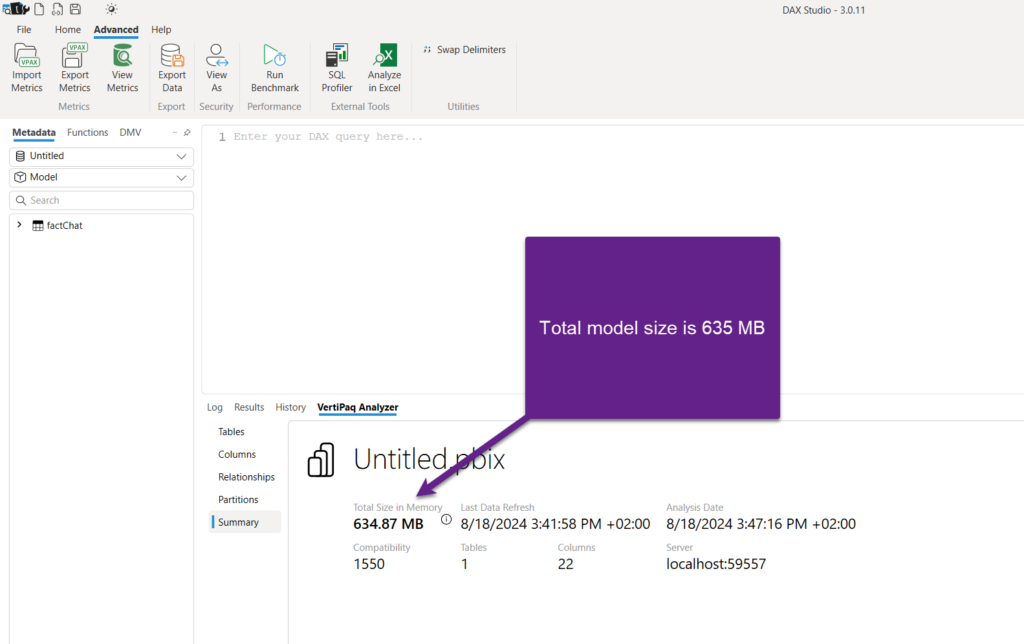
As you may see in the illustration above, the total size of the model is 635 MB. If we drill down to see the information about individual columns, you may notice that the datetmStartUTC column is by far the most expensive in our model – consuming exactly 2/3 of the entire model!
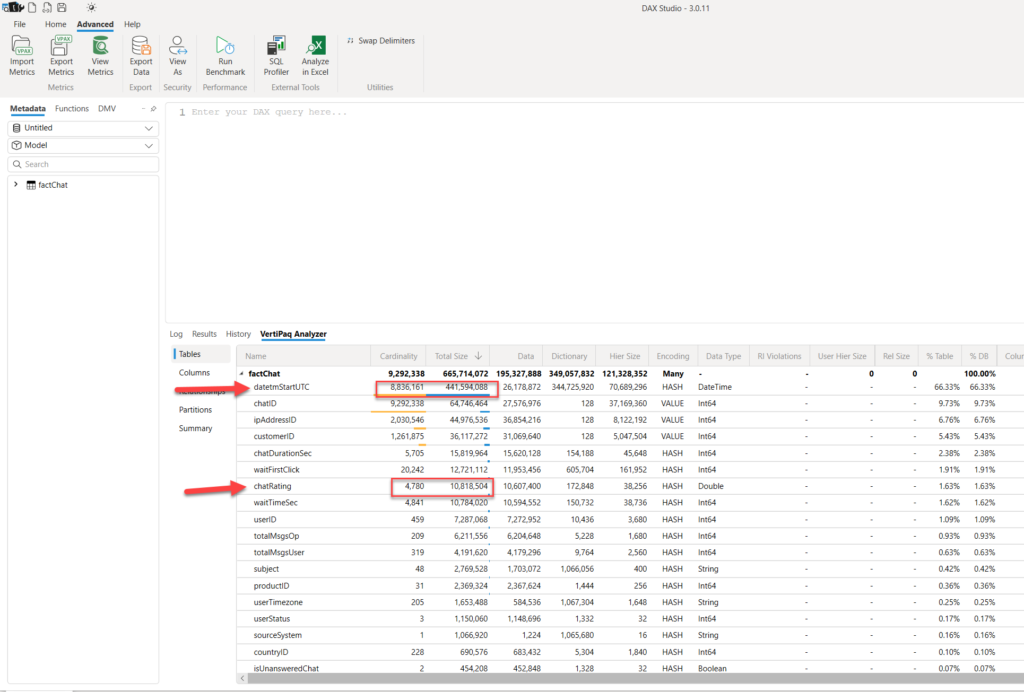
If you are wondering why the size of the datetmStartUTC column is so huge, you may want to refer to my other article that explains the concept of cardinality and how it affects the data model size. In a nutshell, the higher the cardinality of the column (the more distinct values in the column), the harder it is for VertiPaq to compress the data optimally. This, consequentially, leads to a bigger data model size and slower queries.
Optimizing datetime columns
Now, before we jump into modifying the semantic model structure, it’s of key importance to check with business stakeholders if your decisions could potentially impact data accuracy and if a modified semantic model will meet their expectations. Trust me, I made this mistake myself a couple of times and then had to do double work because of the lack of communication…
The main question is: what is the lowest level of detail (granularity) for displaying the data in the report?
In 99% of cases, analytical reports focus on providing the data on a daily level. On some rare occasions, you might want to include analysis per hour, whereas creating analytical reports to display numbers per minute is an extremely isolated requirement.
In my case, the requirement was to analyze the data on a daily level. So, why on Earth should we store information about hours, minutes, and seconds in Power BI?!
Let’s simply change the data type of the datetmStartUTC column from DateTime to date:

Let me stop for a second and examine a few important things. First of all, I’ve used Power Query and its rich GUI to apply the desired data transformation step. Instead of doing this, I could have also created a SQL view and implemented data type conversion in the view definition. If you’re wondering why someone should use views instead of tables in Power BI, I got you covered in this article.
Another approach might be to split the existing DateTime column into two separate columns: one would contain only date information, whereas the other would keep the time portion. This technique would definitely reduce cardinality, but then you need to invest additional time and effort on the report development side, where you would need to bring date and time data together by rewriting your measures. Hence, I advise people to stay away from this approach, unless they are dealing with really huge amounts of data and/or if there is no other viable option for optimizing the model than splitting a column.
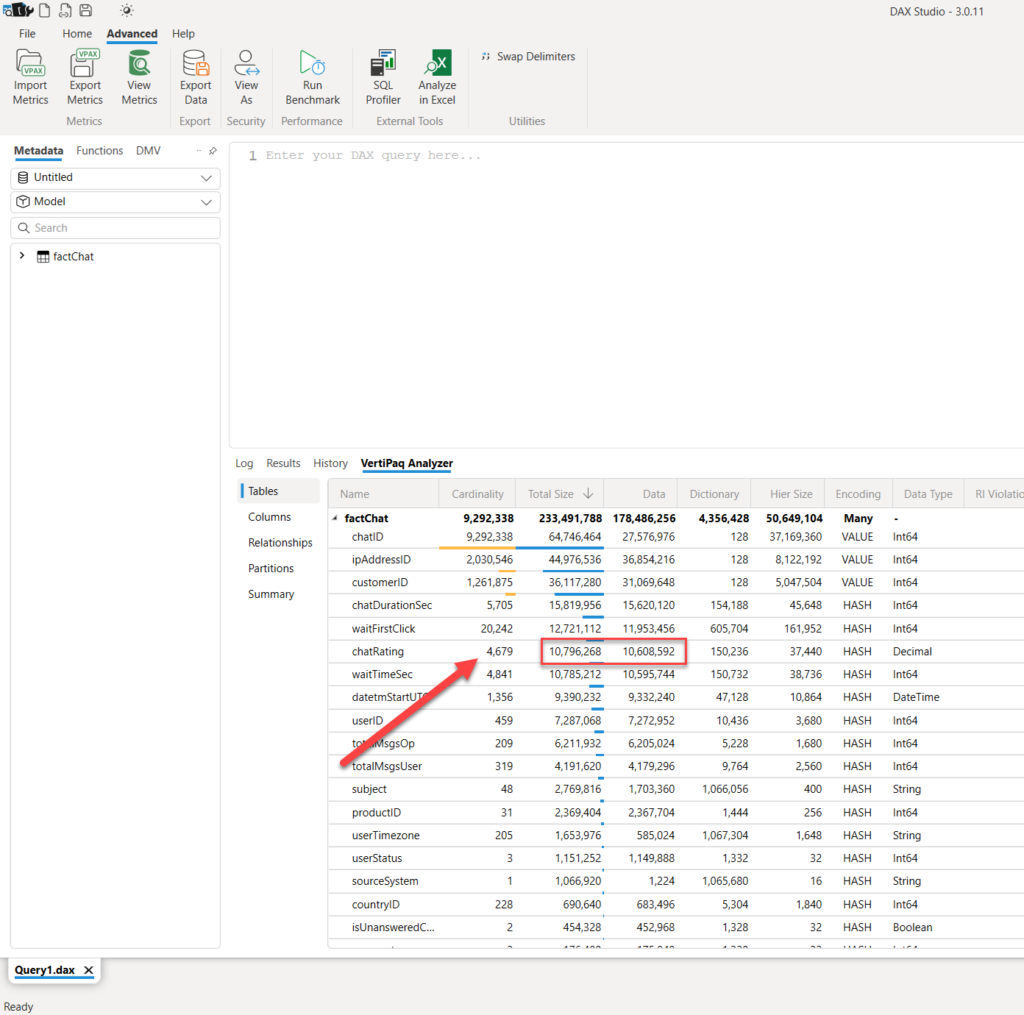
Fine, let’s now take another look into our model metrics:
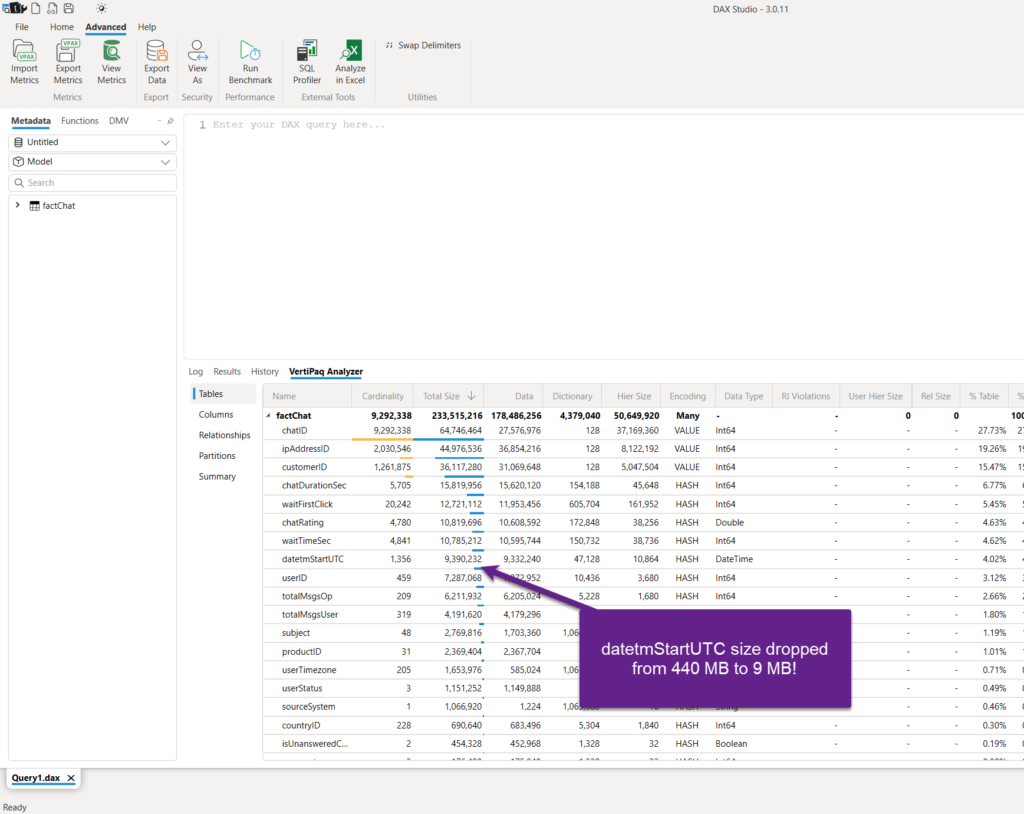
This is awesome! By simply clicking twice in the Power Query Editor and switching from DateTime to date type, the column size dropped from 440 MB to 9 MB! And, the entire model size is now ca. 220 MB instead of 635 MB.
Optimizing columns with high precision
Let’s face the reality and ask ourselves: How many times do our end users really need to see a value like 123.45678 in their reports? OK, maybe there are certain scenarios where this level of precision is truly needed, but as in the previous case with DateTime columns, in 99% of cases, it’s absolutely acceptable to have this same number displayed as 123.5 or 123.46.
Let’s play safe and opt for the latter – keeping two digits after the decimal point. Again, I’ll apply my transformation in the Power Query Editor:
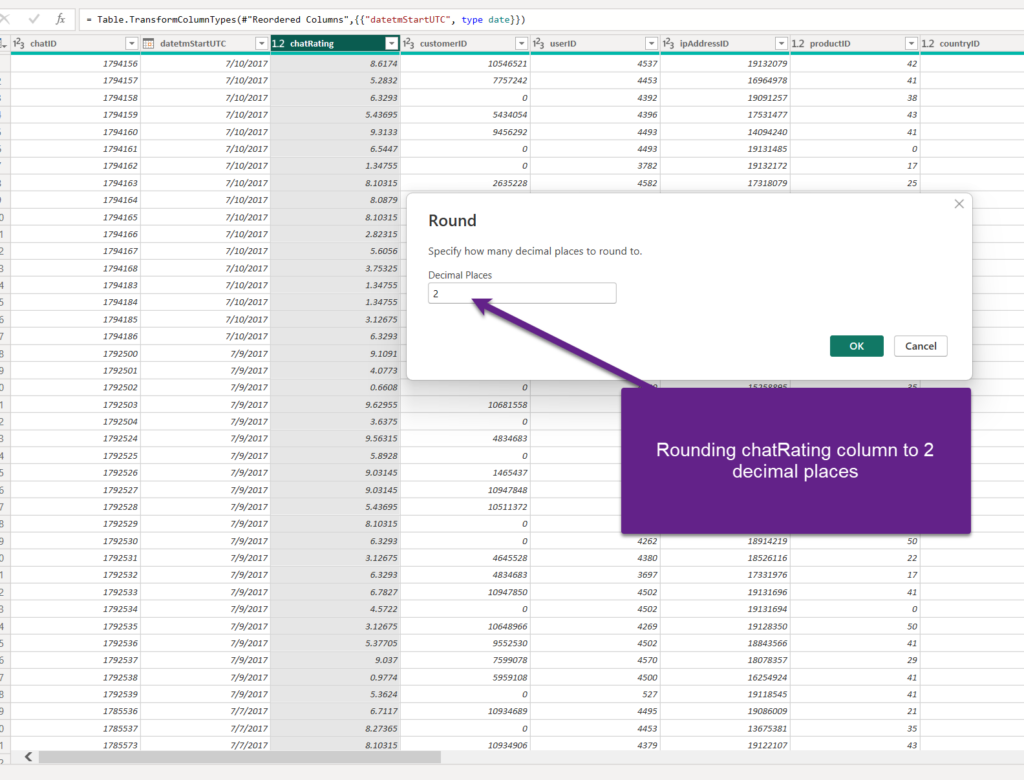
So, instead of 8.6174 in the first row, there will be 8.62…Instead of 5.2832 in the second row, there will be 5.28, and so on. My end users can definitely live with that (but, check with them first!).
Again, two clicks in the Power Query Editor, and our column is 30% smaller, because we managed to reduce its cardinality. In terms of memory savings, this might look trivial compared to the gain we obtained by changing the DateTime column data type, but in large models, and especially with higher cardinality, this technique can also result in significant memory savings.
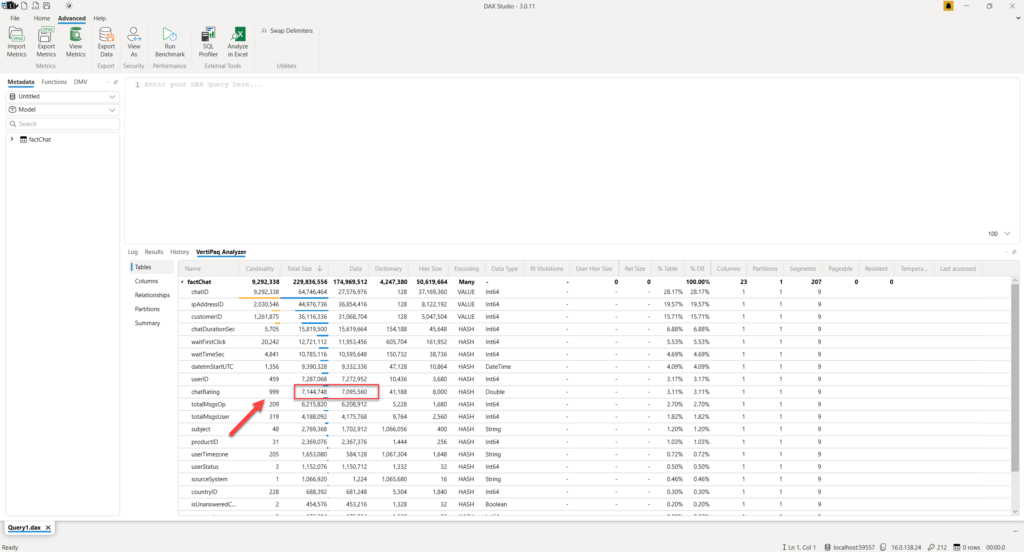
Here, I would like to emphasize another point: You might think that changing a data type of this column from a “regular” decimal number to a Fixed decimal number could produce a similar outcome, but it’s not true. Explaining details about various data types is out of the scope of this article, but you can read more about it here. Although you’ll see only two digits after the decimal point in the chatRating column, in reality, a fixed decimal number type always stores four digits after the decimal point!
You can see that almost nothing changed in terms of cardinality and memory footprint of the column when I changed its data type to Fixed decimal number.
In this case, rounding had much more impact on the column size than changing its data type.
Conclusion
Optimizing the Power BI semantic model doesn’t always have to be a daunting and time-consuming task. You can often celebrate many quick wins, by understanding how the data is stored under the hood and how to implement various cardinality-reduction techniques to reduce the data model size. As you may have witnessed, with just a few clicks here and there, I was able to significantly improve the performance of the Power BI semantic model.
Thanks for reading!
Last Updated on September 19, 2024 by Nikola


ben
Have you assessed the impact of converting data types on query folding? As it often breaks query folding, this can have a net negative impact on the refresh timings.
Nikola
Do you have any examples of converting data types that break query folding? Because, in SQL Server/Azure SQL DB and other Microsoft solutions, changing the data type usually doesn’t break the folding. Thanks!
Julian
Round is a great tip, it folds and Fixed Decimal doesn’t! BPA isn’t happy but it doesn’t know everything.