When I was young, I used to watch Dr House. If you’ve never seen it: a brilliant, grumpy doctor and his team get the cases nobody else can solve, and the patients almost never tell the truth. “Everybody lies”, says House, so he stops listening to what the patients say and looks at the evidence instead. And, of course, it’s never lupus.
Lakehouse tables are not that different. Your pipelines are green, your notebooks finish without errors, and every table tells you it’s perfectly fine. Everybody lies! And in Fabric, it’s never lupus – it’s (almost) always small files 🙂
Last week, I opened a report on top of a Direct Lake semantic model, and the first visual took sooooo long to show up. Nothing had changed in the model. No new measures, no new relationships, no new data volume worth mentioning. However, the table had more than 2000 small files, and the initial query took 15 seconds to load the data! After optimizing the table layout, it went down to sub-second!
And that’s the thing with lakehouse tables: they don’t break. They just get slower, a little bit every day, until somebody complains. By then, nobody remembers which pipeline, notebook, or “quick fix” made them that way.
So I built a doctor for them. In this article, I’ll show you what Dr Lakehouse does, how it works under the hood, and a few things Fabric taught me while I was building it.
Why do lakehouse tables get sick?
In my experience, most people working with Fabric lakehouses don’t know enough about what’s actually stored underneath their tables. Which is perfectly understandable – you write a DataFrame, you get a table, and everything works. Until it doesn’t.
Let’s quickly recap. A lakehouse table is a Delta table: a folder of Parquet files, plus a transaction log (_delta_log) that records every change ever made to the table. If you need a refresher on Parquet itself, row groups, metadata and why columnar storage is so efficient, I’ve covered it in detail here.
Now, every write to a Delta table creates at least one new Parquet file and one new commit in the log. That’s by design, and it’s what gives you ACID transactions and time travel. But, it also means that the way you write the data shapes how the table looks on disk. And that’s where the problems start:
- Small files. A pipeline that appends a few thousand rows every 15 minutes produces almost 100 tiny files per day. Every query now has to open, read, and merge all of them. And for Direct Lake, every file and every row group is extra work when the column data gets loaded into memory on a cold run, as described in this article.
- Soft-deleted rows. With deletion vectors enabled, a DELETE or UPDATE doesn’t rewrite the file. It only marks the rows as deleted. Fast to write, but those rows are still physically there, and every reader has to skip them.
- A long transaction log. To read the current state of the table, the engine replays the log from the last checkpoint. Writers that don’t create checkpoints leave the engine with more and more JSON files to replay.
- No maintenance at all. Many tables have never seen an OPTIMIZE since the day they were created.
None of these will throw an error. Your pipelines stay green, and your tables keep getting slower. I hear you: Nikola, that’s why we have OPTIMIZE!
“Can’t I just run OPTIMIZE?”
Yes, you can. And you should! Put it in your pipeline, right after the ETL, in a notebook activity, for every table you own. If you need it just once, the lakehouse explorer has a Maintenance option that runs OPTIMIZE (and VACUUM) on a single table.
But, both of these options assume one thing: you already know which table needs it.
In a real tenant, you usually don’t…
- A scheduled OPTIMIZE treats every table on the list, healthy or not. On the healthy ones, you’re paying capacity for nothing.
- Tables that are not on the list never get treated at all. A colleague’s lakehouse, last month’s “temporary” ingestion, the workspace somebody created for a POC that somehow became production…
- The lakehouse explorer works one table at a time, in one lakehouse, and leaves no record of who ran what.
- And, as I learned while building this, “Succeeded” doesn’t mean “fixed”. More on that later.
When I started, I wanted something that doesn’t exist today, neither on the market nor as a native Fabric feature: a tool that checks every table in the tenant, tells you which ones are sick and why, lets you treat them from the same screen, and then checks whether the treatment actually worked. The initial spark came from Thibauld’s excellent lakehouse table health dashboard post. I just wanted to take it one step further: what if the dashboard could also treat what it diagnoses?
Meet Dr Lakehouse
Dr Lakehouse does four things, just like a real doctor:
- Examines. It scans every Delta table in every lakehouse its service account can see. No IDs to copy, no list to maintain: a new workspace is picked up on the next scan.
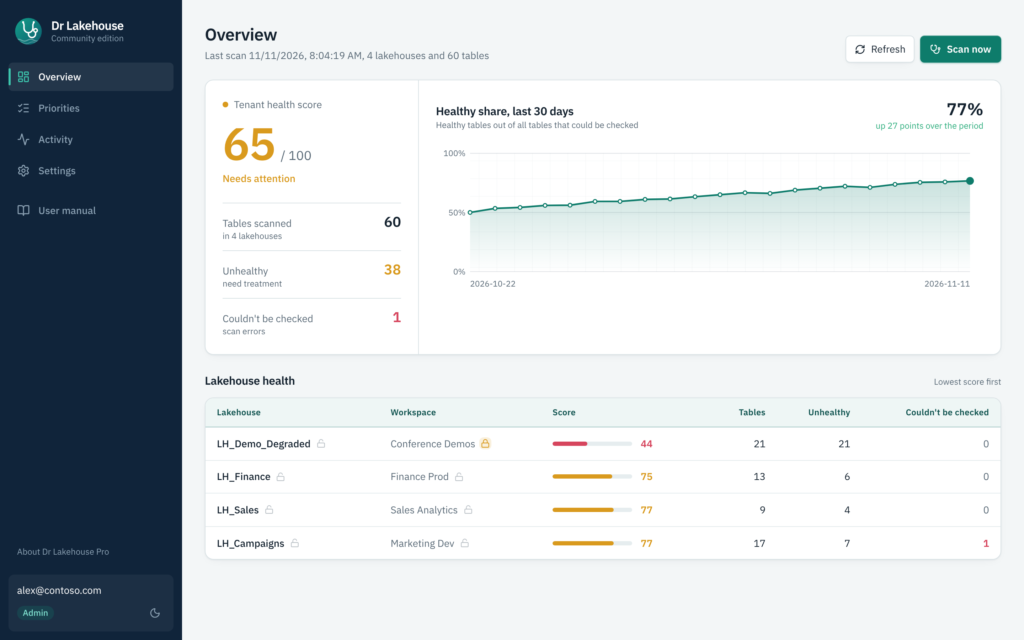
- Diagnoses. Every table gets a health score from 0 to 100 and a list of problems.
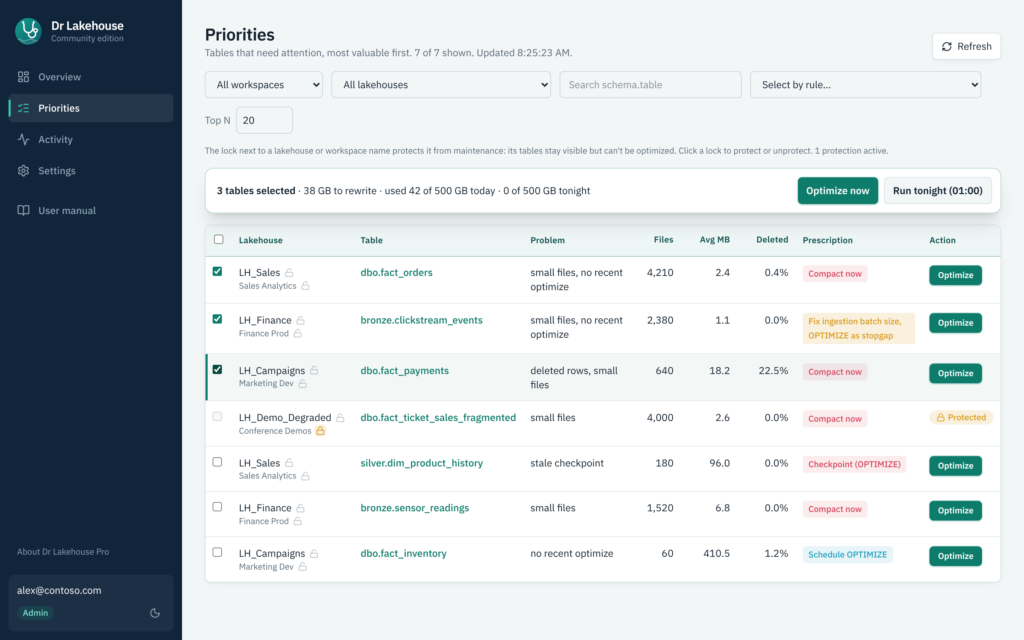
- Prescribes. Every unhealthy table gets one treatment: Compact now, Fix ingestion batch size, Schedule OPTIMIZE, and so on.
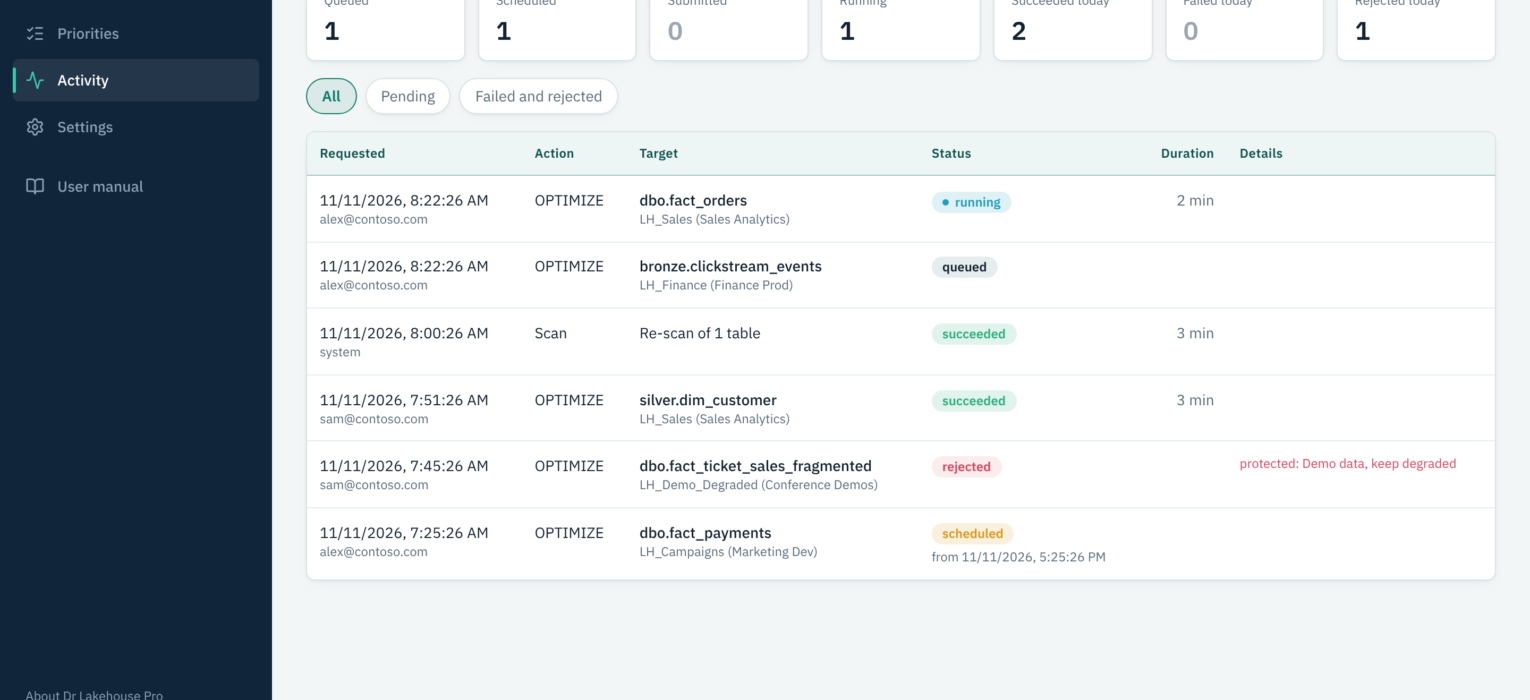
- Treats. You run OPTIMIZE (with V-Order, by default) straight from the list: one table or a whole selection. Now, or tonight at 01:00 when the capacity is quiet.
How the diagnosis works
The examination is a Python notebook (drl_collect) that runs once a day. For every lakehouse, it refreshes the SQL analytics endpoint metadata, and then for every table, it combines two sources:
- Fabric’s own health check. The SQL analytics endpoint exposes a system stored procedure,
sys.sp_get_table_health_metrics, that returns the file count, size, physical and deleted row counts, and the checkpoint version, plus Fabric’s own verdict on what’s wrong with the table. - The Delta log. The notebook reads the table history with the
deltalakePython library: when was the last OPTIMIZE, the last VACUUM, how many versions does the table have, is V-Order enabled, are deletion vectors on.
Every table starts at 100 points, and every problem takes points off:
| Problem | When it applies | Points off |
|---|---|---|
| Small files | Average file size under 128 MB, on a table large enough to compact | 40 |
| Deleted rows | More than 10% of stored rows are soft-deleted | 30 |
| Invalid statistics | Fabric reports the statistics as unusable | 30 |
| Flagged by Fabric | Fabric reports another problem | 20 |
| Stale checkpoint | More than 10 commits since the last checkpoint, on a table large enough to compact | 15 |
| No recent OPTIMIZE | No OPTIMIZE for 30 days on a table with more than 20 commits, large enough to compact | 10 |
80 to 100 is healthy, 50 to 79 needs attention, and below 50 is critical. All thresholds are stored in a table, so you can tune them without touching the code.
The prescription follows from the problems. One of them is my favorite: when a table has small files and more than 200 commits, the prescription is not “Compact now”, but “Fix ingestion batch size, OPTIMIZE as stopgap”. Because, if your pipeline writes 200 tiny batches a day, OPTIMIZE only treats the symptom. Tomorrow, the table will be sick again.
Finally, the order on the Priorities page is not the score alone. It’s the score deficit multiplied by the table size, so a 500 GB table at 60 points comes before a 5 MB table at 20.
How the treatment works
The treatment itself is nothing exotic. Dr Lakehouse calls the same table maintenance job that the lakehouse explorer uses, through the Fabric REST API. OPTIMIZE with V-Order is the default, and VACUUM is available for admins only, with a minimum retention of 7 days and a confirmation dialog. VACUUM deletes files permanently, and there is no dry run in the API, so I wanted at least one “Are you sure?” between the user and the files.
The interesting part is not the OPTIMIZE. It’s everything around it.
Imagine somebody opens the Priorities page, sees 100 unhealthy tables, ticks Select all and clicks Optimize now. With V-Order, that’s 100 rewrite jobs hitting the same capacity in the middle of the working day. Your reports and pipelines would not be very happy about it… So every request goes into a queue first, and has to pass a few rules:
- A daily rewrite budget. By default, 500 GB per day. The selection bar shows how much of today’s (and tonight’s) budget a selection would use, before you click anything.
- At most 3 jobs per lakehouse at the same time. The rest wait in the queue.
- A 12-hour cooldown per table. A second OPTIMIZE right after the first one rewrites data for almost no gain.
- One lock per table, so the same table is never treated twice at once.
- Fresh data only. Decisions are made on a scan that is less than 24 hours old.
- Protection locks. You can lock a whole workspace or lakehouse, and its tables can’t be treated, while they’re still scanned and shown. My FabCon demo tables are in a locked workspace, because I need them sick on purpose, to show performance degradation in my sessions 🙂
Every rule is checked twice: when the request is made, and again right before it’s sent to Fabric. That way, if you lock a workspace at 5 PM, the treatments somebody scheduled for tonight on that workspace won’t run either.
And, there are roles. Viewers see everything but can’t touch anything. Operators can scan and treat. Admins can also VACUUM, manage locks and assign roles. Every request is recorded with who made it, when, and how it ended.
Finally, about 5 minutes after a treatment succeeds, Dr Lakehouse scans that table again. If ten tables were treated in a row, they share one rescan. This is the part I care about the most: you don’t just know that the job ran, you know whether the table got better.
Under the hood
Here is how the pieces fit together:
drl_collect– a Python notebook that scans all lakehouses daily (and on demand) and writes the results to amonitoringlakehouse: the latest health per table, the daily snapshots, and a trend per lakehouse.- The app – a Fabric App built with Rayfin (React frontend plus user data functions). The functions run as a service account, which is the only identity that needs access to the client’s workspaces. Users only need access to the app.
drl_control– a Fabric SQL database that holds the queue, the roles, the locks and the audit trail.drl_driver– a second Python notebook that runs only while there is work. The app starts it whenever someone queues a treatment or a scan, and a daily run at 01:00 picks up the night queue. It checks the running jobs, releases the locks, queues the rescans, and submits whatever is ready. Once nothing is running or due, it exits. This is what makes Run tonight work while nobody has the app open.
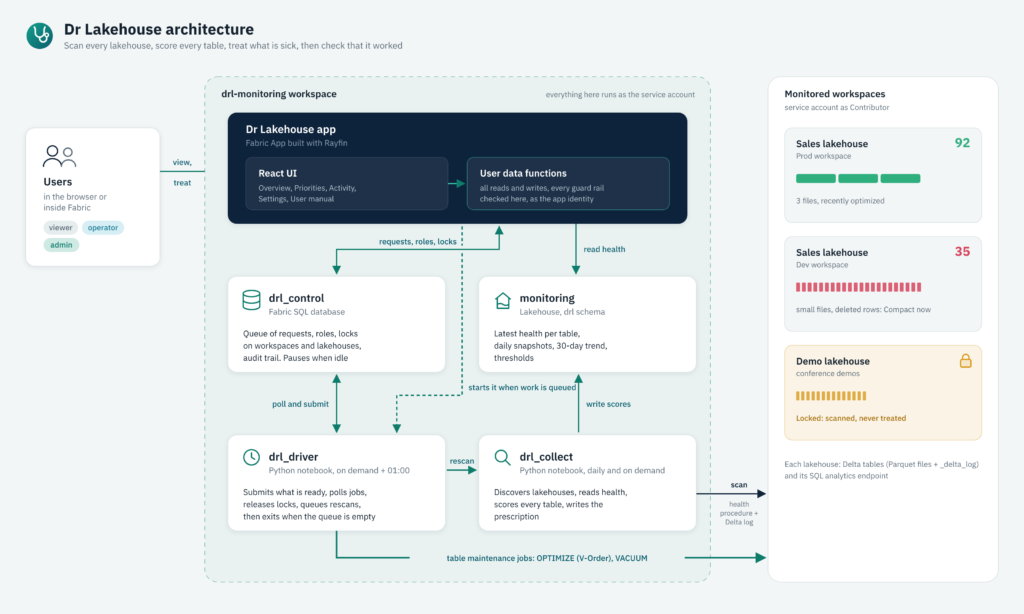
Why a separate SQL database, and not the database that comes with Rayfin? Because Rayfin’s built-in data service runs queries with the caller’s permissions. That’s fine for most apps, but here, it would mean every user needs write access to the queue and the roles table, and a clever user could simply make themselves an admin. With a separate database that only the functions can reach, the rules live in one place, and nobody can go around them.
What Fabric taught me along the way
A few things surprised me while building this, and I think they’re worth sharing, even if you never use Dr Lakehouse.
“Succeeded” doesn’t mean “fixed”
I optimized a small table with 16 tiny files. The job finished with status Succeeded. The rescan showed… 16 files, and no OPTIMIZE anywhere in the Delta log. Same story with a second table of 13 files.
Wait, what?! The explanation is fast optimize. Before compacting a group (“bin”) of small files, Fabric checks whether it’s worth it. By default, it only compacts a bin if it has at least 50 small files, or enough data to produce a properly sized file (around 1.3 GB with the default settings). Otherwise, it simply skips it, and the job still reports success. It makes perfect sense: compacting 16 files of a few KB each gains you nothing. But, it also means that a green job tells you nothing about what happened to your table. You can read more about fast optimize in the official docs.
Two things changed because of this. First, Dr Lakehouse now flags small files only on tables that are large enough to compact, because prescribing a treatment that Fabric will skip is just noise. And second, it convinced me that the rescan after every treatment is not a nice-to-have.
A pipeline can’t call your Fabric App functions
The first plan for the unattended queue processing was a Fabric pipeline with a Functions activity, calling the app’s user data functions every 5 minutes. It failed with Missing required header ‘x-ms-rayfin-info’: Rayfin functions only accept calls that come from the app itself. So the queue driver became a small Python notebook that does the same work directly against the control database and the Fabric API.
A database that never sleeps is not free
That notebook first ran every 5 minutes, and it worked. Then I looked at how a Fabric SQL database is billed. And, I’ve already written about it in detail in this article. It stays online until it has been idle for 15 minutes, and while online, it uses at least about 0.67 vCore, which is roughly 1.7 CU. A query every 5 minutes means it never goes idle, so the control database alone would burn most of an F2, around the clock, to look at an empty queue.
I considered moving the queue to a Fabric Warehouse. But the queue depends on two things a Warehouse doesn’t give you: concurrent updates on the same table (Warehouse snapshot isolation fails them with update conflicts), and enforced primary keys (in a Warehouse, they’re NOT ENFORCED), which is exactly what stops one table from being treated twice.
So the database stayed, and the driver changed instead. It now starts on demand: the app wakes it up when someone queues a treatment or a scan, it works the queue every minute, and it exits as soon as nothing is running or due. Plus one scheduled run at 01:00 for the night queue. Between those, nobody touches drl_control, and it pauses after 15 minutes.
The database name is the lakehouse name
When you connect to a lakehouse SQL analytics endpoint from code, the database (Initial Catalog) is the lakehouse name, not its ID. Obvious once you know it, and a confusing “database not found” error if you don’t.
What does it cost?
This is usually the first question, and it’s a fair one: a tool that saves capacity shouldn’t eat it. Thanks to the on-demand driver, drl_control is online only while someone uses the app or a treatment runs, plus 15 minutes.
Keep in mind that the OPTIMIZE jobs themselves are not Dr Lakehouse overhead. You’d pay for them anyway, whether they run from a pipeline, the lakehouse explorer, or Dr Lakehouse. The difference is that Dr Lakehouse only runs them on tables that actually need them.
Try it
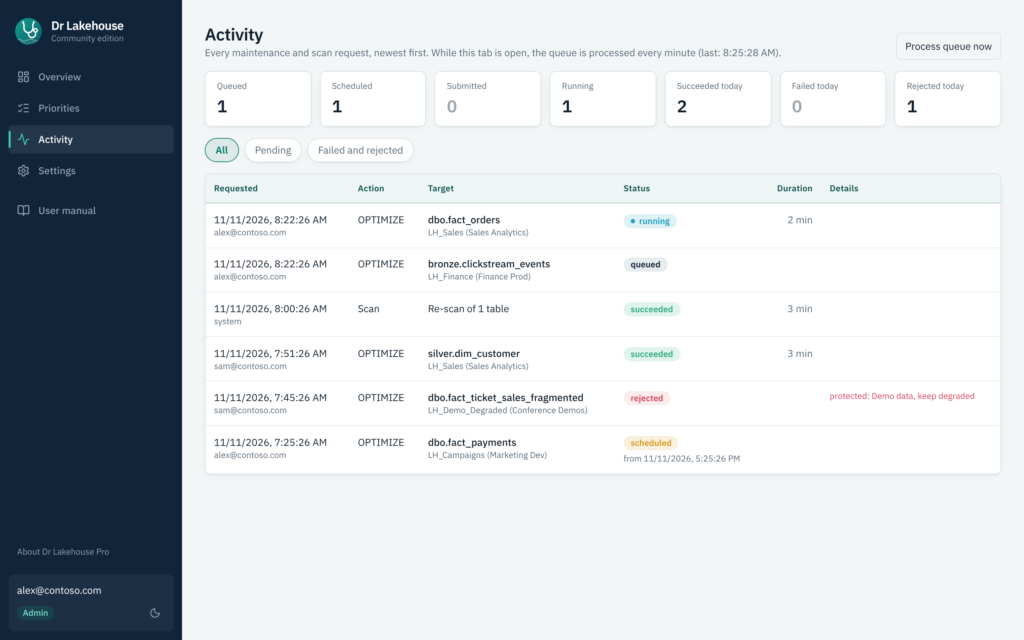
The Community edition is free on GitHub, under the Elastic License 2.0. It’s everything in this article: the scan, health scores, prescriptions, OPTIMIZE and VACUUM from the app, and all the guardrails. You can run and modify it in your own tenant, you just can’t offer it to others as a hosted service.
Dr Lakehouse Pro builds on it for teams that run Fabric at scale: a treatment ledger with before and after per table and the CU spent, a daily CU budget, storage reclaim planning, a Direct Lake guard that treats the tables behind your semantic models first, help fixing the ingestion settings that cause small files in the first place, plus an installer and support.
If you’d like to see it running on your own tenant, do reach out directly at nikola@data-mozart.com or nikola@datacrafters.io.
Conclusion
Keep OPTIMIZE in your pipelines. But, every now and then, take your tables to the doctor: to find out where maintenance is missing, where it’s wasted, and whether it works at all.
Thanks for reading!
Last Updated on November 11, 2026 by Nikola