

Building Power BI reports is a cool thing, I won’t argue about it! And I am pretty sure that each time we build a report, we firmly believe that this report is a “real deal” and that it will be consumed by a large majority of our users.
However, the reality is often completely opposite! There are many reports that are being regularly run in the beginning, but after a while, they are starting to become a “dead wood”. Of course, there are some “evergreen” reports, that are being used frequently for years, but I would argue that that’s more an exception than the rule.
The point here is that you need to have a possibility to check the usage metrics of your Power BI reports – which reports are most frequently run, which users are the most active, or to simply identify rarely used reports, so you can consider removing or adjusting them.
With Power BI Service it’s easy!
If you’re using Power BI Service – you’re the lucky one! Just go to Admin portal, and click on Usage metrics:

And you will get a nice overview of the various figures related to your reports, dashboards, datasets…
But what should I do if I run my Power BI reports on the Report Server?
Good news! There is also a possibility to check the metrics, even to visualize them similar to the Service version.
Magic happens within two special DMVs (Data Management Views) that reside in the ReportServer database on your reporting server. These two specially created views are ExecutionLog and ExecutionLog3, which retrieve data from the underlying table ExecutionlogStorage.
Here is the basic example of how you can check the execution log for the report called Sales by Year, and walk through all executions from the beginning of this year until the moment of the query run. Results are displayed sorted in descending order, starting from the latest execution.
USE [ReportServer]
SELECT c.[name] as reportName
       ,e.username as userExec
       ,e.TimeStart
       ,e.TimeEnd
       ,DATEDIFF(ss,e.TimeStart,e.TimeEnd) as TimeInSeconds
       ,e.Parameters
       ,c.ModifiedDate as ReportLastModified
       ,u.username as userCreated
FROM catalog c
       INNER JOIN executionlogstorage e on c.itemid = e.reportid
       INNER JOIN users u on c.modifiedbyid = u.userid
WHERE e.TimeStart >= '2020-01-01'
       AND e.TimeEnd < getdate()
       AND c.[name] = 'SalesByYear'
ORDER BY timestart DESC
Simply said, when you run the query, you should be able to see the report name, a user that created the report, when the report was last modified, a user that performed specific execution, and, most important, the time that report needed for rendering and parameters which were used. This should give you a brief overview of things happening in the background.
Get more in-depth view
In case you need to check the execution log in more depth, you can run the following query:
USE [ReportServer]
SELECT c.[Name] as reportname
      ,e.InstanceName
      ,e.ItemPath
      ,e.UserName as userExec
      ,e.RequestType --Interactive or Subscription
      ,e.Parameters
      ,e.ItemAction --Render or Sort
      ,e.TimeStart
      ,e.TimeEnd
      ,e.TimeDataRetrieval
      ,e.TimeProcessing
      ,e.TimeRendering
      ,e.Source
      ,e.Status
      ,e.ByteCount
      ,e.RowCount
FROM Catalog c
      INNER JOIN ExecutionLog3 e ON e.ItemPath = c.Path
WHERE c.name = 'SalesByYear'
      AND e.TimeStart >= '2020-01-01'
      AND e.TimeEnd < getdate()
ORDER BY e.TimeStart DESC
Who needs them?
I also like to have an overview of which reports are being used and which can be considered as “dead wood”. Therefore, I created a simple Power BI report, which imports data from the following query in the background:
USE [ReportServer]
SELECT distinct a.*
      ,l.UserName
FROM
(
     SELECT c.[name] as reportName
           ,SUBSTRING(SUBSTRING(path, CHARINDEX('/', path) + 1, LEN(path)),0,CHARINDEX('/',SUBSTRING(path, CHARINDEX('/', path) + 1, LEN(path)))) Folder
           ,CASE(RequestType) WHEN 0 THEN 'Interactive' WHEN 1 THEN 'Subscription' WHEN 2 THEN 'Refresh Cache' ELSE 'Unknown' END AS RequestType
           ,MAX(l.TimeStart) lastRunDate
     FROM Catalog c
           INNER JOIN ExecutionLogStorage l ON l.ReportID = c.ItemID
     WHERE c.Type NOT IN (1,3,5,8)
           AND l.ReportAction IN(1,13)
     GROUP BY c.[name]
          ,SUBSTRING(SUBSTRING(path, CHARINDEX('/', path) + 1, LEN(path)),0,CHARINDEX('/',SUBSTRING(path, CHARINDEX('/', path) + 1, LEN(path))))
          ,CASE(RequestType) WHEN 0 THEN 'Interactive' WHEN 1 THEN 'Subscription' WHEN 2 THEN 'Refresh Cache' ELSE 'Unknown' END
     HAVING MAX(l.TimeStart) < getdate() - 90
) a
INNER JOIN ExecutionLogStorage l ON l.TimeStart = a.lastRunDate
This query returns a list of reports that were not run in the last 90 days. Of course, you can adjust the date range according to your needs. In any case, you can refer to this article and check all the different information you can obtain using these DMVs.
So, here is what I’ve created in Power BI to visualize this data:

This page shows me total number of executions for the specific report in the selected time period, and also some additional info on the right.
The next page gives me an overview per user, but also per folders on the Report Server:
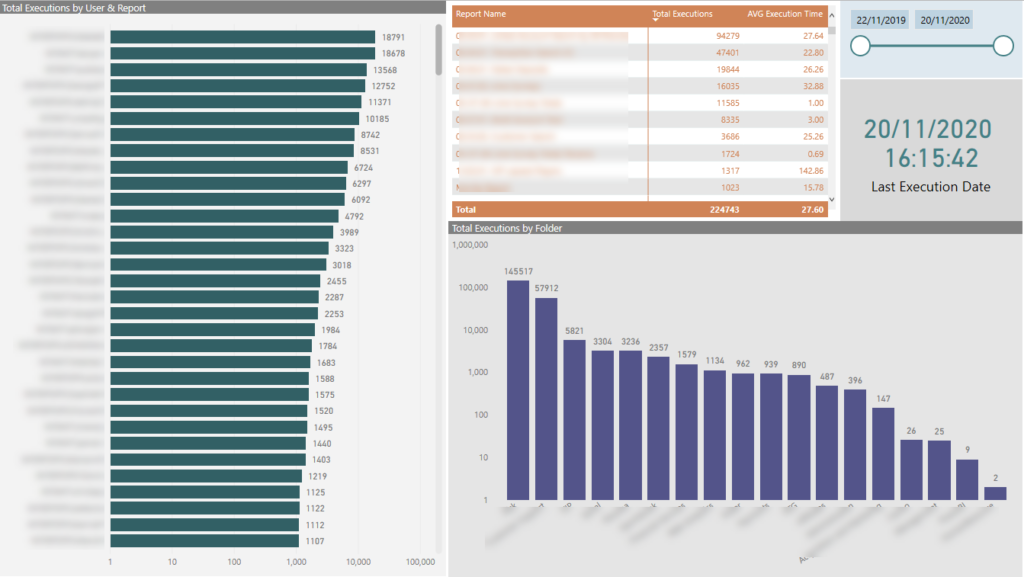
Finally, the most useful for me is to check which reports are rarely used. The following report page helps me to identify those items:

Conclusion
Even though Power BI Service gives you ready-made solution for examining usage metrics, there are still lot of us working with Power BI Report Server. Therefore, I believe that having report similar to this one can help you better understand who, when and how, running your reports!
Thanks for reading!


Ayobami Adeleke
Nice one, please can you leave a link to the pbix here?
Nikola
Hi Ayobami,
Unfortunately, I can’t, as it contains real data that is not for sharing outside of the company. Sorry about that!
Jerry Brown
This is good news, and hard to find resources on this for PBI Report Server, so thank you! I have a question about where you enter the query. I need to set this up for my team but I’m missing information on how to access these logs. Do you enter the queries you show from inside Power BI Desktop (for server), or do you sign on from a url, or maybe MSSMS Report Server Configuration Manager?
Mark Lynn
To Whom It May Concern:
Thank you for building out this website, programming the SQL Scripts and developing the Power BI Dashboard. I accidently found this website when I was Googling for a different Power BI Report Server matter I am working on. This is a big win for me!
Very Appreciative,
Mark Lynn.
Andrey
Hello Ayobami, thank’s a lot!!
Is there a way to track which pages are used in the report (i use Report Server)?
Power BI Report Server Monitoring Tool - Blog about Actionable Reporting - Alexander Korn
[…] I want to give a shout out to Nikola Ilic for providing input for this pbix file through his blog post: Check Power BI usage metrics on Report Server! – Data Mozart (data-mozart.com) […]