

If someone asks you to define the Power Query, what should you say? If you’ve ever worked with Power BI, there is no chance that you haven’t used Power Query, even if you weren’t aware of it. Therefore, one could easily say that Power Query is the “heart and soul” of Power BI…
In more official wording, Power Query is Microsoft’s technology for connecting and transforming data from multiple sources. As Microsoft’s official documentation states, you can connect to hundreds of different data sources and perform more than 300 transformations on your data.
The key advantage of Power Query is that you can perform complex data transformations with little or no coding skills! Additionally, all steps you’ve applied during the data transformation process are being saved, so every time you refresh your dataset, those steps will be automatically applied to shape your data, which is a real time-saver.
Out of those 300+ transformations, it’s extremely hard to choose the most useful ones, but I will share my top 3 tips related to Power Query (and its powerful M language).
Tip #1 – Time Savers in Power Query Editor
I need to say this immediately: there are tons of time-saving actions you can perform with clever usage of Power Query Editor, so I will narrow my recommendation to a few I’m using most often.
I bet that you face this scenario almost every time you are preparing data for your Power BI report. You import wide table with lot of columns and you need to get rid of some of them. You are scrolling from left to right, choosing which columns to keep and which to remove.
But, there is much more sophisticated way to obtain this:
As you see in the illustration above, instead of exhausting scrolling, just open Choose Columns drop-down menu, select Choose Columns, and select columns you want to keep! Soooo handy!
Another tip under the same drop-down menu: choose Go To Column and you will be navigated straight to that column, so you can perform any kind of transformation you want on that specific column, again without the need to waste your time trying to find it in wide “30+ column tables”…
Another hidden gem is “Query Dependencies” button under View tab.

This is extremely useful when working with complex models, when data comes from multiple different sources, or not all data is being loaded to the report.
Using Query Dependencies will give you quick visual overview of your data model:
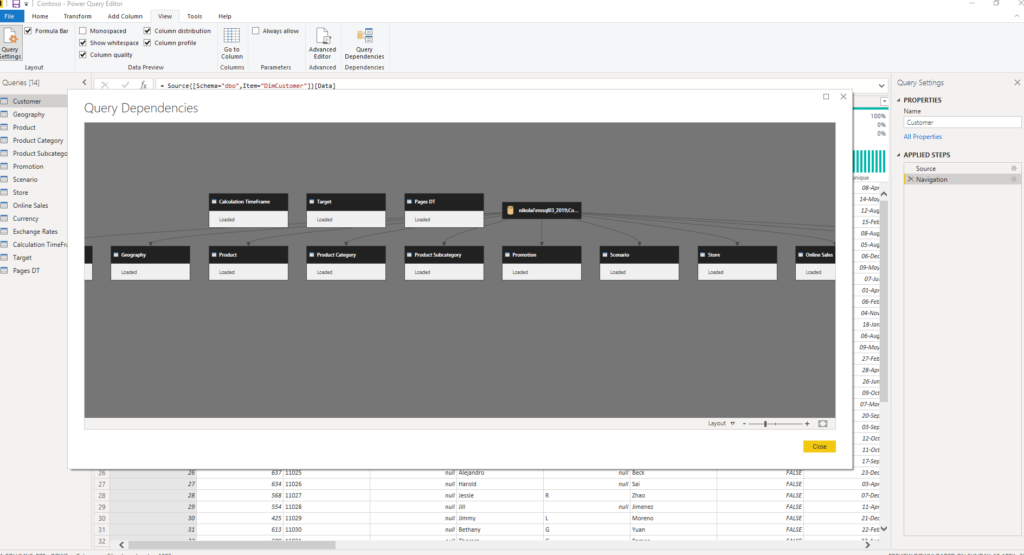
Instead of clicking on every single entity in your data model to check its status, you can have this all at one place, and even better, it’s visually represented!
Imagine having data coming from CSV files, SQL Server database and Sharepoint lists, and part of that data doesn’t even being loaded to the report for whatever reasons. This is a huuuuge time saver!
Tip #2 – Use M language to perform frequent calculations
One of the most common business requests is to calculate the day difference between different events. For example, I want to know the age structure of my customers, so I need to calculate their age every time data is refreshed.
Or, I need to check how many days are customers late with their payments. As you can assume, these figures need to be calculated dynamically, so here comes M language to the rescue!
Let’s demonstrate on calculating customers’ age. Basically, there are two ways to achieve this in Power Query: first doesn’t need any coding, but it requires multiple steps to be applied. Therefore, I prefer the second option, when you put the whole calculation in one step!
This method visualized above requires three separate steps. First, we insert a new column and under the Date drop-down menu, we choose the Age option. However, Power Query calculates Age in days since BirthDate till today. Therefore, we need to convert this awkward number to years, which is done under the Duration drop-down menu and selecting Total Years. Again, we are getting an awkward result, because age is displayed as a decimal number with multiple decimal places (this is correct, but not intuitive). One last step is to round down that number, which is performed under Rounding.
Now, nothing is wrong with this approach, but if you are doing multiple calculations, your Power Query Applied Steps pane will finish polluted with many unnecessary steps.
That’s why I prefer another option: under the Add Column tab, choose a Custom column and enter the following formula:
Number.RoundDown(Duration.TotalDays(Date.From(DateTime.LocalNow()) - [BirthDate])/365)
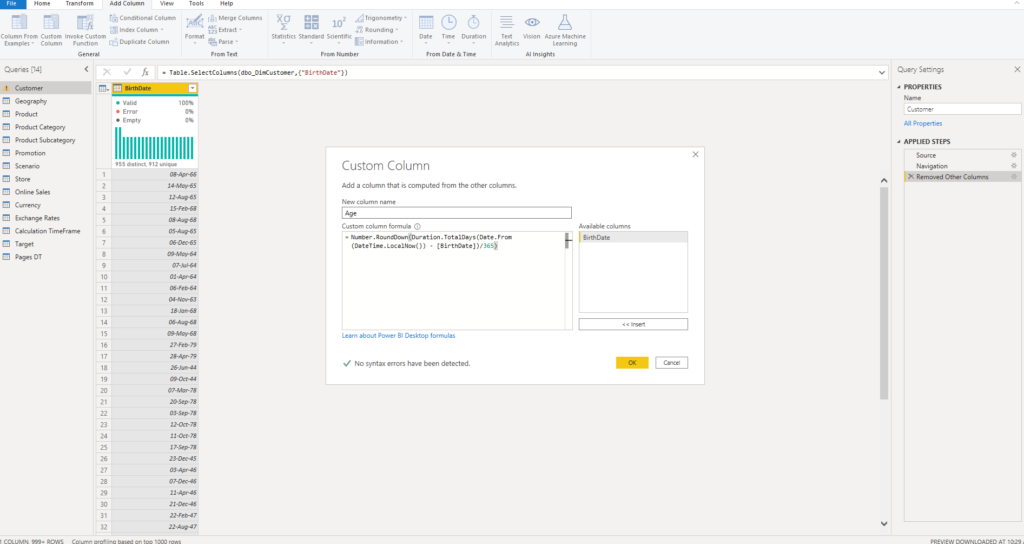
This way, we perform all iterations from the previous version in one run and we have only one step applied! Mission accomplished in a more elegant way…
Tip #3 – Custom Flexible Date Dimension
This one is my favorite! First, I thought to dedicate separate post to this, but in the end I’ve decided to put it here.
I won’t spend much time explaining the importance of having separate Date dimension (that will be topic for another article) – I will just briefly say: technically, Power BI allows you to “survive” without separate Date dimension, but don’t do it! Just don’t…
There are multiple solutions to create separate Date dimension in your data model, but here I will focus on using M language to achieve this.
There are plenty of ready-made scripts on the web for creating a fully functional Date dimension, but I’ve chosen this solution from Reza Rad (by the way, on his blog you can learn a lot of useful stuff).
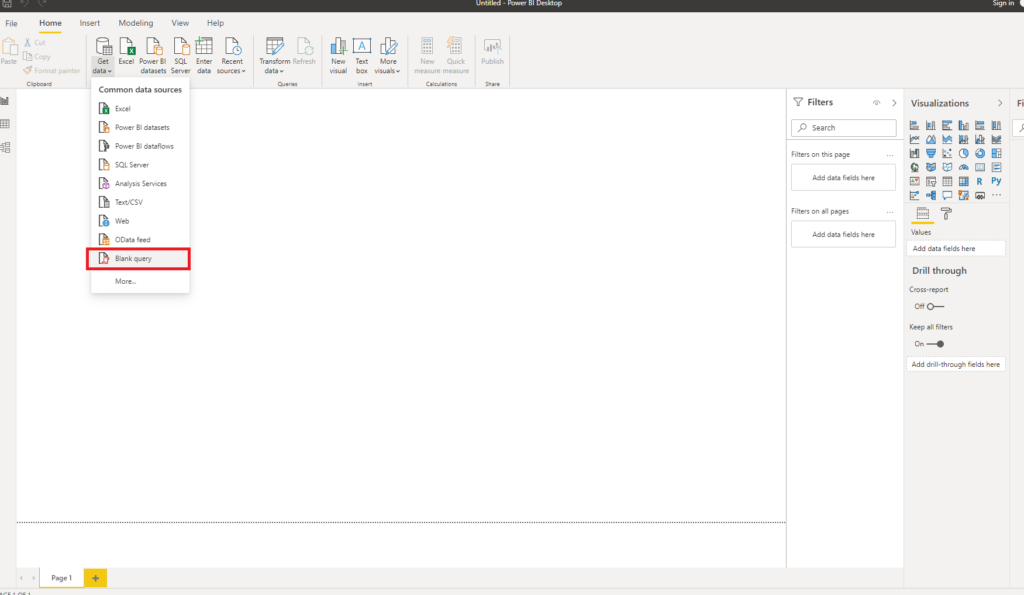
Open new Power BI file and choose Blank query under Get data:
This will navigate you to Power Query Editor. The next step is of key importance in order to have a highly customized Date dimension.
Under Manage Parameters, select New Parameter and format it like on the following image:
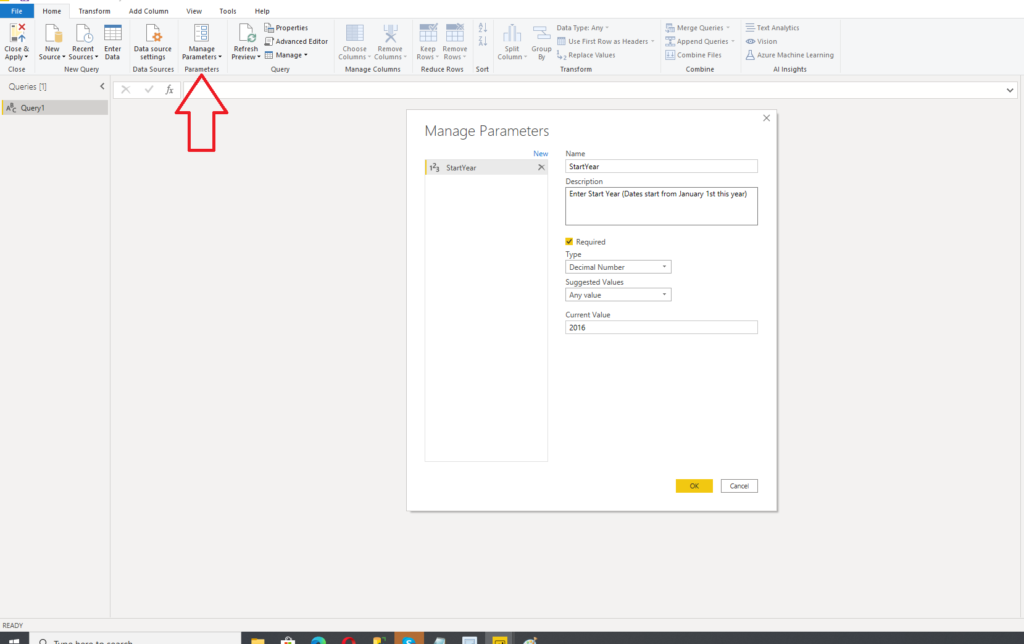
This way, you are defining from which year you want your Date dimension to start. Do exactly the same for EndYear:

Now that we have both our parameters defined, we can switch to Advanced Editor and paste the whole Reza’s script for creating specific columns of our Date dimension (of course, feel free to include/exclude more columns according to your needs).
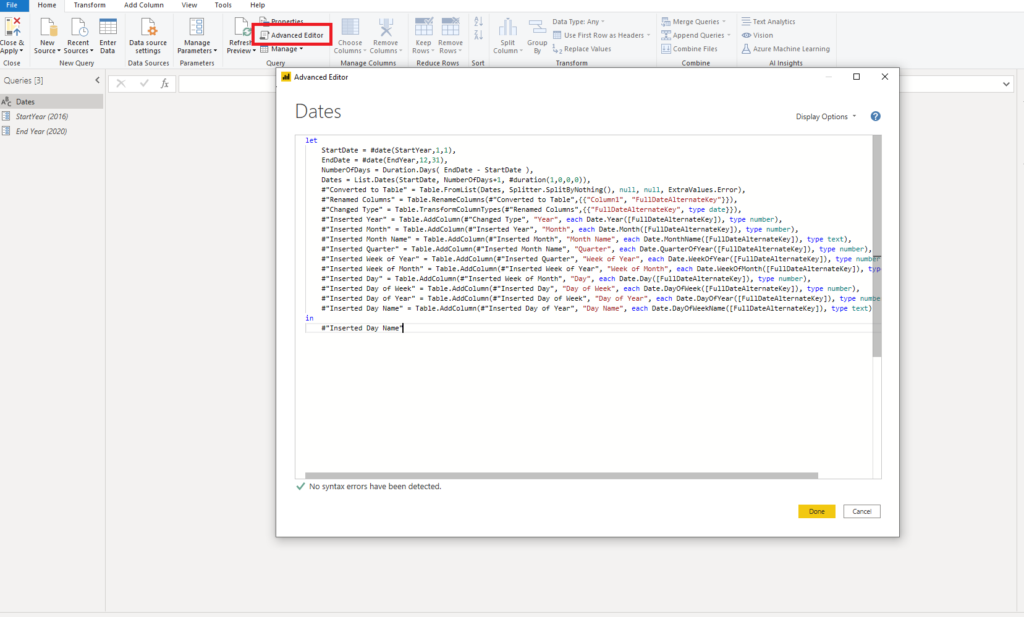
And here is the whole script:
let
    StartDate = #date(StartYear,1,1),
    EndDate = #date(EndYear,12,31),
    NumberOfDays = Duration.Days( EndDate - StartDate ),
    Dates = List.Dates(StartDate, NumberOfDays+1, #duration(1,0,0,0)),
    #"Converted to Table" = Table.FromList(Dates, Splitter.SplitByNothing(), null, null, ExtraValues.Error),
    #"Renamed Columns" = Table.RenameColumns(#"Converted to Table",{{"Column1", "FullDateAlternateKey"}}),
    #"Changed Type" = Table.TransformColumnTypes(#"Renamed Columns",{{"FullDateAlternateKey", type date}}),
    #"Inserted Year" = Table.AddColumn(#"Changed Type", "Year", each Date.Year([FullDateAlternateKey]), type number),
    #"Inserted Month" = Table.AddColumn(#"Inserted Year", "Month", each Date.Month([FullDateAlternateKey]), type number),
    #"Inserted Month Name" = Table.AddColumn(#"Inserted Month", "Month Name", each Date.MonthName([FullDateAlternateKey]), type text),
    #"Inserted Quarter" = Table.AddColumn(#"Inserted Month Name", "Quarter", each Date.QuarterOfYear([FullDateAlternateKey]), type number),
    #"Inserted Week of Year" = Table.AddColumn(#"Inserted Quarter", "Week of Year", each Date.WeekOfYear([FullDateAlternateKey]), type number),
    #"Inserted Week of Month" = Table.AddColumn(#"Inserted Week of Year", "Week of Month", each Date.WeekOfMonth([FullDateAlternateKey]), type number),
    #"Inserted Day" = Table.AddColumn(#"Inserted Week of Month", "Day", each Date.Day([FullDateAlternateKey]), type number),
    #"Inserted Day of Week" = Table.AddColumn(#"Inserted Day", "Day of Week", each Date.DayOfWeek([FullDateAlternateKey]), type number),
    #"Inserted Day of Year" = Table.AddColumn(#"Inserted Day of Week", "Day of Year", each Date.DayOfYear([FullDateAlternateKey]), type number),
    #"Inserted Day Name" = Table.AddColumn(#"Inserted Day of Year", "Day Name", each Date.DayOfWeekName([FullDateAlternateKey]), type text)
in
    #"Inserted Day Name"
Hit Close & Apply and we now have fully functional Date dimension in our data model!
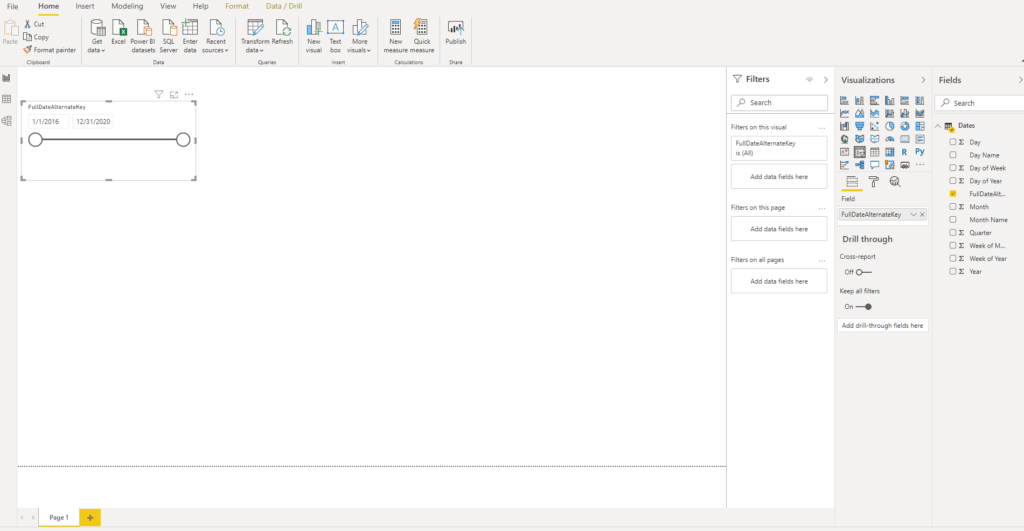
We can easily change the time frame by managing parameters and switching year values.
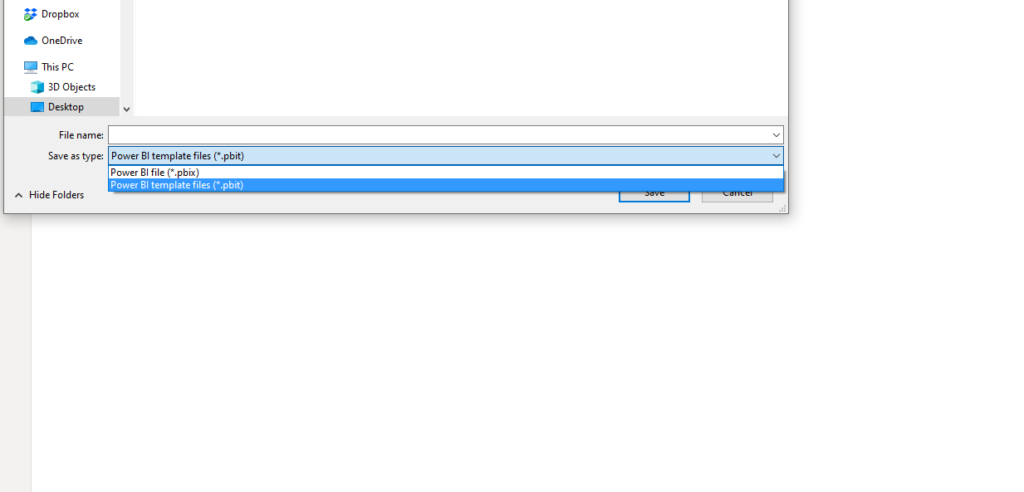
And now comes ice on the cake, as a bonus tip: save your file as .pbit (Power BI Template file). This way, when you starting your Power BI projects, you don’t need to create a Date dimension from Scratch, wasting your time and energy – it will already be there for you!
You want more? There it is. Once you open your template file, you will be prompted to enter values for Start Year and End Year, which means that you can customize time-frame from report to report! How cool is that!
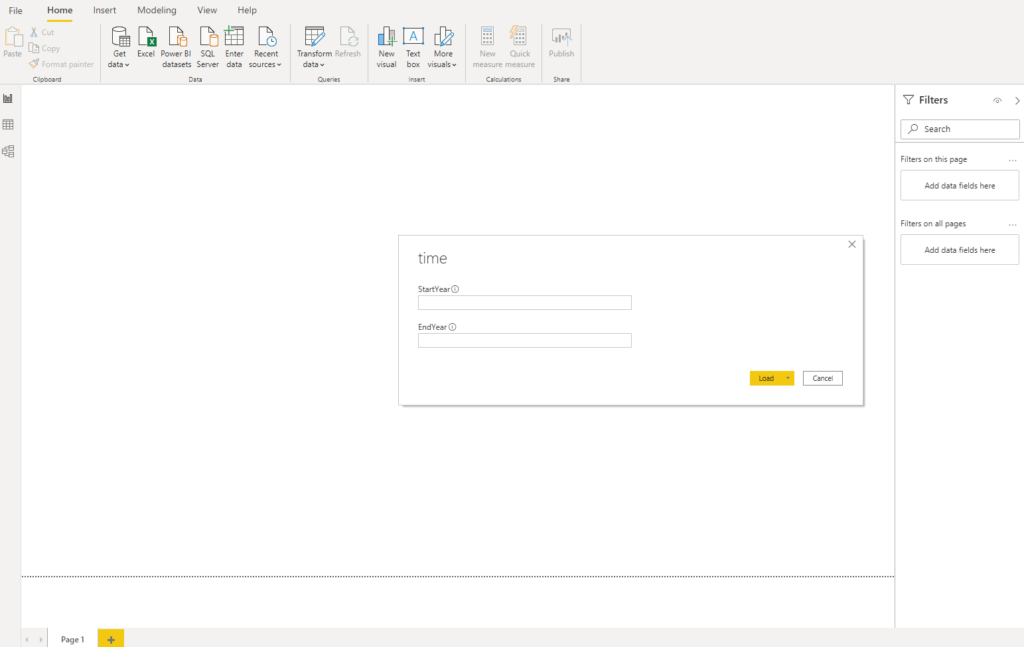
As soon as you enter values, Power BI will automatically create Date dimension for you, based on values you defined!

Conclusion
Power Query offers a whole range of features when it comes to data retrieval and especially for data transformation. Describing all of them will require a book or two, so I wanted to extract just a few of them which I consider most useful in my day-to-day work with Power BI.
What are your favorite Power Query features? Feel free to share them in the Comments section.
Last Updated on June 7, 2020 by Nikola


Gudmundur Asmundsson
This is far better dimdate function that I have been using since 2017. It creates a custom function with date from and to plus u can specify the local language for days and months.
let CreateDateTable = (StartDate as date, EndDate as date, optional Culture as nullable text) as table =>
let
DayCount = Duration.Days(Duration.From(EndDate – StartDate)),
Source = List.Dates(StartDate,DayCount,#duration(1,0,0,0)),
TableFromList = Table.FromList(Source, Splitter.SplitByNothing()),
ChangedType = Table.TransformColumnTypes(TableFromList,{{“Column1”, type date}}),
RenamedColumns = Table.RenameColumns(ChangedType,{{“Column1”, “Date”}}),
InsertYear = Table.AddColumn(RenamedColumns, “Year”, each Date.Year([Date])),
InsertQuarter = Table.AddColumn(InsertYear, “QuarterOfYear”, each Date.QuarterOfYear([Date])),
InsertMonth = Table.AddColumn(InsertQuarter, “MonthOfYear”, each Date.Month([Date])),
InsertDay = Table.AddColumn(InsertMonth, “DayOfMonth”, each Date.Day([Date])),
InsertDayInt = Table.AddColumn(InsertDay, “DateInt”, each [Year] * 10000 + [MonthOfYear] * 100 + [DayOfMonth]),
InsertMonthName = Table.AddColumn(InsertDayInt, “MonthName”, each Date.ToText([Date], “MMMM”, Culture), type text),
InsertCalendarMonth = Table.AddColumn(InsertMonthName, “MonthInCalendar”, each (try(Text.Range([MonthName],0,3)) otherwise [MonthName]) & ” ” & Number.ToText([Year])),
InsertCalendarQtr = Table.AddColumn(InsertCalendarMonth, “QuarterInCalendar”, each “Q” & Number.ToText([QuarterOfYear]) & ” ” & Number.ToText([Year])),
InsertDayWeek = Table.AddColumn(InsertCalendarQtr, “DayInWeek”, each Date.DayOfWeek([Date])),
InsertDayName = Table.AddColumn(InsertDayWeek, “DayOfWeekName”, each Date.ToText([Date], “dddd”, Culture), type text),
InsertWeekEnding = Table.AddColumn(InsertDayName, “WeekEnding”, each Date.EndOfWeek([Date]), type date)
in
InsertWeekEnding
in
CreateDateTable
Nikola
Fantastic! Thanks for sharing Gudmundur!