Have you ever wondered what makes Power BI so fast and powerful when it comes to performance? So powerful, that it performs complex calculations over millions of rows in a blink of an eye.
In this series of articles, we will dig deep to discover what is “under the hood” of Power BI, how your data is being stored, compressed, queried, and finally, brought back to your report. Once you finish reading, I hope that you will get a better understanding of the hard work happening in the background and appreciate the importance of creating an optimal data model in order to get maximum performance from the Power BI engine.
After we laid theoretical ground for understanding architecture behind VertiPaq storage engine, and which types of compression it uses to optimize your Power BI data model, it’s the right moment to make our hands dirty and apply our knowledge in real life case!
Starting point = 777 MB
Our data model is quite simple, yet memory exhaustive. We have a fact table (factChat) which contains data about live support chats and one dimension table (dimProduct), that relates to a fact table. Our fact table has around 9 million rows, which should not be a big deal for Power BI, but the table was imported as it is, without any additional optimization or transformation.
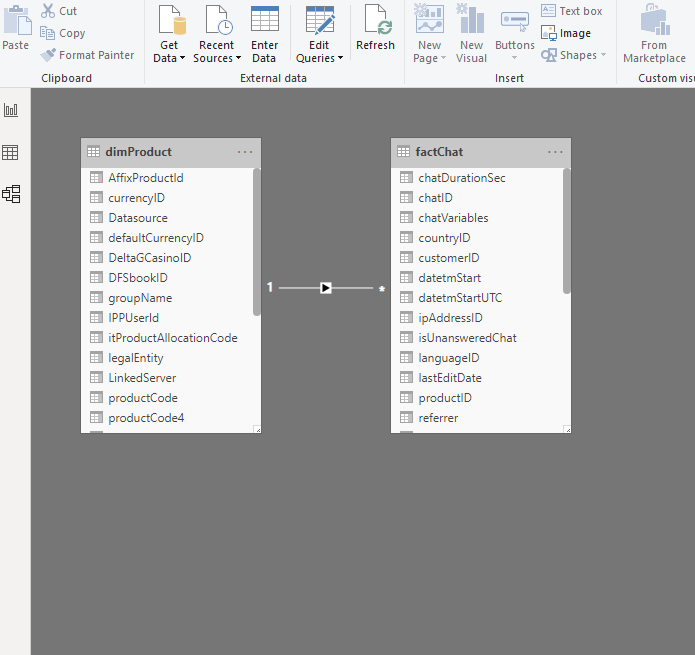
Now, this pbix file consumes whopping 777 MB!!! You can’t believe it? Just take a look:

Just remember this picture! Of course, I don’t need to tell you how much time this report needs to load or refresh, and how our calculations are slow because of the file size.
…and it’s even worse!
Additionally, it’s not just 777 MBs that takes our memory, since memory consumption is being calculated taking into account following factors:
- PBIX file
- Dictionary (you’ve learned about the dictionary in this article)
- Column hierarchies
- User-defined hierarchies
- Relationships
Now, if I open Task Manager, go to Details tab and find msmdsrv.exe process, I will see that it burns more than 1 GB of the memory!

Oh, man, that really hurts! And we haven’t even interacted with the report! So, let’s see what we can do to optimize our model…
Rule #1 – Import only those columns you really need
The first and the most important rule is: keep in your data model only those columns you really need for the report!
That being said, do I really need here both chatID column, which is a surrogate key, and sourceID column, which is a primary key from the source system. Both these values are unique, so even if I need to count the total number of chats, I would still be fine with only one of them.
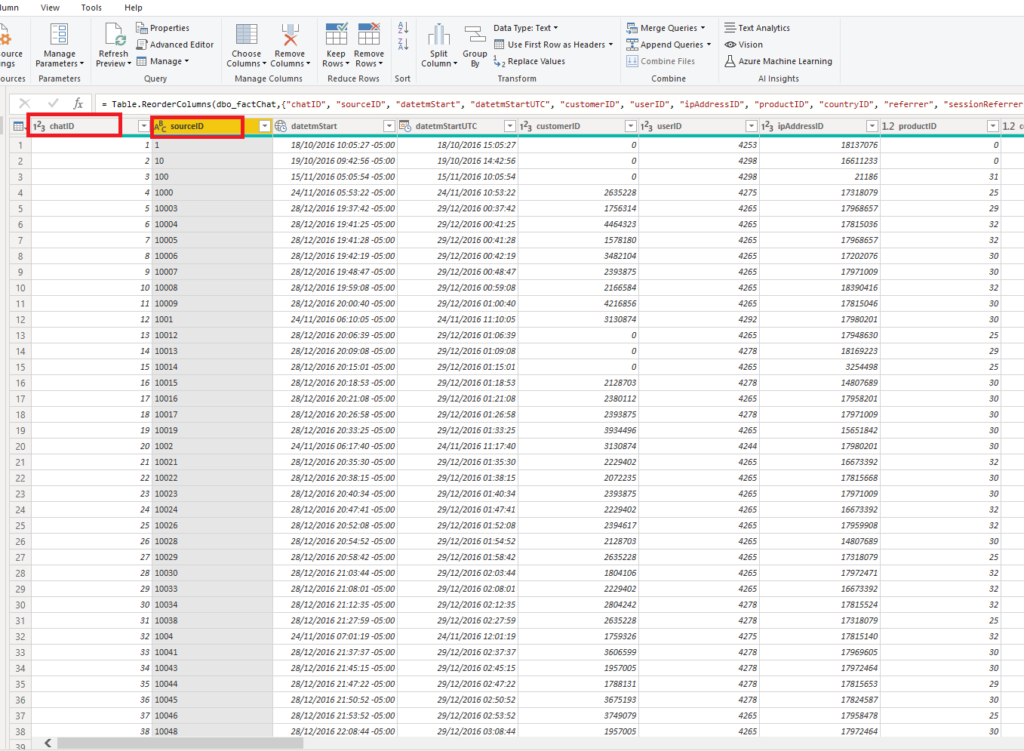
Let me check how the file looks now:

By removing just one unnecessary column, we saved more than 100 MB!!! Let’s examine further what can be removed without taking a deeper look (and we will come later into this, I promise).
Do we really need both original start time of the chat and UTC time, one stored as a Date/Time/Timezone type, other as Date/Time, and both going to a second precision??!!
Let me get rid of original start time column and keep only UTC values.

Another 100 MB of wasted space gone! By removing just two columns we don’t need, we reduced size of our file by 30%!
Now, that was without even looking into more details of the memory consumption. Let’s now turn on DAX Studio, my favorite tool for troubleshooting Power BI reports. As I already stressed a few times, this tool is a MUST if you plan to work seriously with Power BI – and it’s completely free!
One of the features in DAX Studio is a VertiPaq Analyzer, a very useful tool built by Marco Russo and Alberto Ferrari from sqlbi.com. When I connect to my pbix file with DAX Studio, here are the numbers related to my data model size:
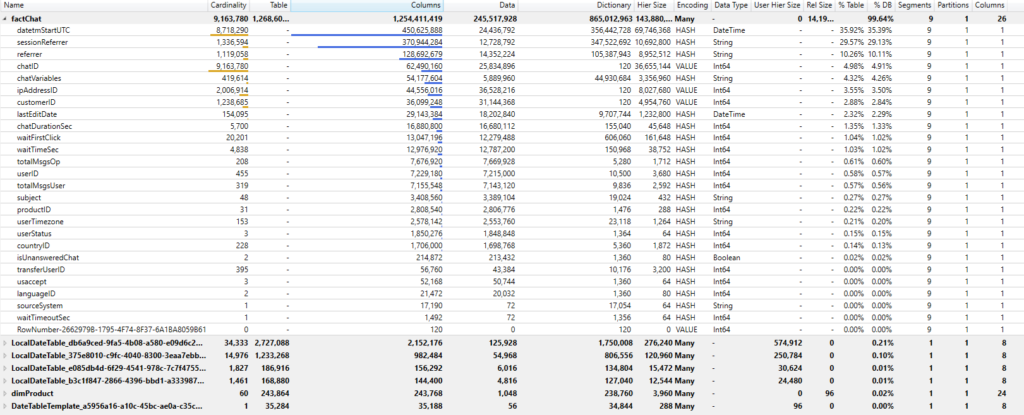
I can see here what are the most expensive columns in my data model and decide if I can discard some of them, or do I need to keep them all.
At first glance, I have few candidates for removal – sessionReferrer and referrer columns have high cardinality and therefore can’t be optimally compressed. Moreover, as these are text columns and need to be encoded using a Hash algorithm, you can see that their dictionary size is extremely high! If you take a closer look, you can notice that these two columns take almost 40% of my table size!
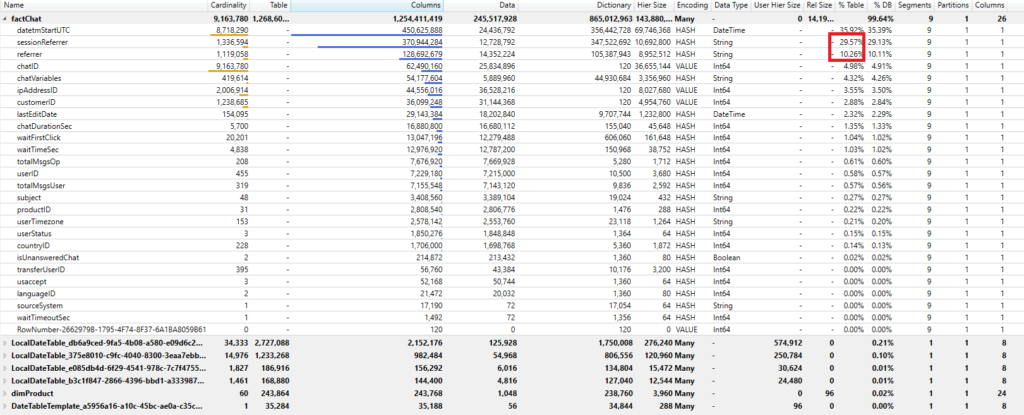
After checking with my report users if they need any of these columns, or maybe only one of them, I’ve got a confirmation that they don’t perform any analysis on those columns. So, why on Earth should we bloat our data model with them??!!
Another strong candidate for removal is the LastEditDate column. This column just shows the date and time when the record was last edited in the data warehouse. Again checked with report users, they didn’t even know that this column exists!
I removed these three columns and the result is:

Oh, god, we halved the size of our data model by just removing few unnecessary columns.
Truth to be said, there are some few more columns which could be dismissed from the data model, but let’s now focus on other techniques for data model optimization.
Rule #2 – Reduce the column cardinality!
As you may recall from my previous article, the rule of thumb is: the higher the cardinality of a column, the harder for VertiPaq to optimally compress the data. Especially, if we are not working with integer values.
Let’s take a deeper look into VertiPaq Analyzer results:

As you see, even if the chatID column has higher cardinality than the datetmStartUTC column, it takes almost 8 times less memory! Since it is a surrogate key integer value, VertiPaq applies Value encoding, and the size of a dictionary is irrelevant. On the other hand, Hash encoding is being applied for the column of date/time data type with high cardinality, so the dictionary size is enormously higher.
There are multiple techniques for reducing the column cardinality, such as splitting columns. Here are a few examples of using this technique.
For Integer columns, you can split them into two even columns using division and modulo operations. In our case, it would be:
SELECT chatID/1000 AS chatID_div
             ,chatID % 1000 AS chatID_mod
  .......
This optimization technique must be performed on the source side (in this case by writing a T-SQL statement). If we use the calculated columns, there is no benefit at all, since the original column has to be stored in the data model first.
A similar technique can bring significant savings when you have decimal values in the column. You can just simply split values before and after the decimal like explained in this article.
Since we don’t have any decimal values, let’s focus on our problem – optimizing the datetmStartUTC column. There are multiple valid options to optimize this column. The first is to check if your users need granularity higher than day level (in other words, can you remove hours, minutes and seconds from your data).
Let’s check what savings would this solution bring:

The first thing we notice is that our file is now 255 MB, so 1/3 from what we started from. VertiPaq Analyzer’s results show that this column is now almost perfectly optimized, going from taking over 62% of our data model to just slightly over 2.5%! That’s huuuuge!

However, it appeared that day level grain was not fine enough and my users needed to analyze figures on hour level. OK, so we can at least get rid of minutes and seconds and that would also decrease the cardinality of the column.
So, I’ve imported values rounded per hour:
          SELECT chatID
				,dateadd(hour, datediff(hour, 0, datetmStartUTC), 0) AS datetmStartUTC
				,customerID
				,userID
				,ipAddressID
				,productID
				,countryID
				,userStatus
				,isUnansweredChat
				,totalMsgsOp
				,totalMsgsUser
				,userTimezone
				,waitTimeSec
				,waitTimeoutSec
				,chatDurationSec
				,sourceSystem
				,subject
				,usaccept
				,transferUserID
				,languageID
				,waitFirstClick
			FROM factChat
It appeared that my users also didn’t need a chatVariables column for analysis, so I’ve also removed it from the data model.
Finally, after disabling Auto Date/Time in Options for Data Load, my data model size was around 220 MB! However, one thing still bothered me: the chatID column was still occupying almost 1/3 of my table. And this is just a surrogate key, which is not used in any of the relationships within my data model.
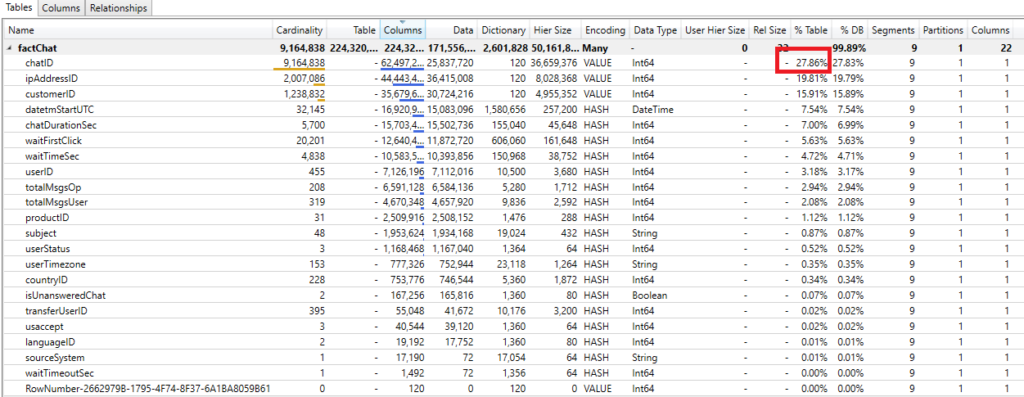
So, here I was examining two different solutions: the first was to simply remove this column and aggregate number of chats, counting them using GROUP BY clause:
SELECT count(chatID) chatID
				,dateadd(hour, datediff(hour, 0, datetmStartUTC), 0) datetmStartUTC
				,customerID
				,userID
				,ipAddressID
				,productID
				,countryID
				,userStatus
				,isUnansweredChat
				,totalMsgsOp
				,totalMsgsUser
				,userTimezone
				,waitTimeSec
				,waitTimeoutSec
				,chatDurationSec
				,sourceSystem
				,subject
				,usaccept
				,transferUserID
				,languageID
				,waitFirstClick
			FROM factChat
			GROUP BY dateadd(hour, datediff(hour, 0, datetmStartUTC), 0)
				,customerID
				,userID
				,ipAddressID
				,productID
				,countryID
				,userStatus
				,isUnansweredChat
				,totalMsgsOp
				,totalMsgsUser
				,userTimezone
				,waitTimeSec
				,waitTimeoutSec
				,chatDurationSec
				,sourceSystem
				,subject
				,usaccept
				,transferUserID
				,languageID
				,waitFirstClick
This solution would also reduce the number of rows since it will aggregate chats grouped by defined attributes – but the main advantage is that it will drastically reduce the cardinality of chatID column, as you can see in the next illustration:
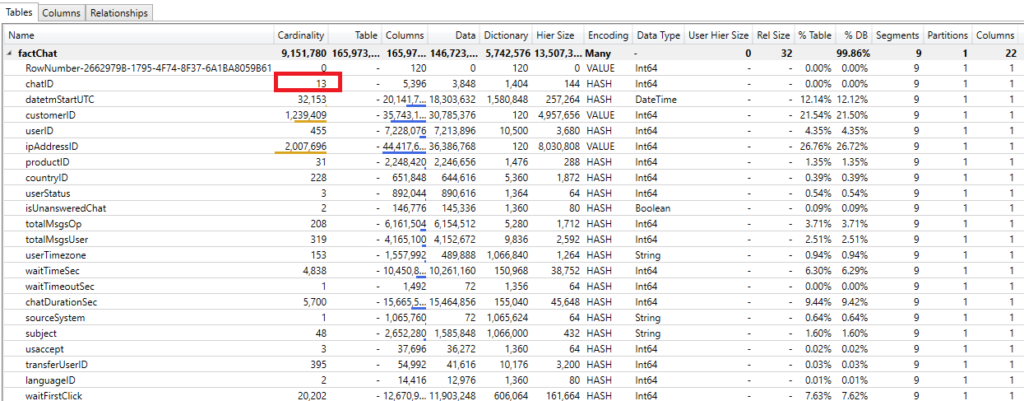
So, we went down from “9 million and something” cardinality to just 13!!! And this column’s memory consumption is now not worth mentioning anymore. Obviuosly, this also reflected on out pbix file size:

Updated Solution (Thanks to Davide Mauri)
Thanks to Davide Mauri from Microsoft, who rightly spotted that there would be no benefit by keeping the chatID column at all, once I’ve removed it from the model, we saved an additional 3 MB, but preserved original granularity of the table!
And one last time, let’s check the pbix file size:

Please recall the number we started at: 777 MB! So, I’ve managed to reduce my data model size by almost 90%, applying some simple techniques which enabled the VertiPaq storage engine to perform more optimal compression of the data.
And this was a real use-case, which I faced during the last year!
General rules for reducing data model size
To conclude, here is the list of general rules you should keep in mind when trying to reduce the data model size:
- Keep only those columns your users need in the report! Just sticking with this one single rule will save you an unbelievable amount of space, I assure you…
- Try to optimize column cardinality whenever possible. The golden rule here is: test, test, test…and if there is a significant benefit from, for example, splitting one column into two, or to substitute decimal column with two whole number columns, then do it! But, also keep in mind that your measures need to be rewritten to handle those structural changes, in order to display expected results. So, if your table is not big, or if you have to rewrite hundreds of measures, maybe it’s not worth splitting the column. As I said, it depends on your specific scenario, and you should carefully evaluate which solution makes more sense
- Same as for columns, keep only those rows you need: for example, maybe you don’t need to import data from the last 10 years, but only 5! That will also reduce your data model size. Talk to your users, ask them what they really need, before blindly putting everything inside your data model
- Aggregate your data whenever possible! That means – fewer rows, lower cardinality, so all nice things you are aiming to achieve! If you don’t need hours, minutes, or seconds level of granularity, don’t import them! Aggregations in Power BI (and Tabular model in general) are a very important and wide topic, which is out of the scope of this series, but I strongly recommend you to check Phil Seamark’s blog and his series of posts on creative aggregations usage
- Avoid using calculated columns whenever possible, since they are not being optimally compressed. Instead, try to push all calculations to a data source (SQL database for example) or perform them using the Power Query editor
- Use proper data types (for example, if your data granularity is on a day level, there is no need to use Date/Time data type. Date data type will suffice)
- Disable Auto Date/Time option for data loading (this will remove a bunch of automatically created date tables in the background)
Conclusion
After you learned the basics of VertiPaq storage engine and different techniques it uses for data compression, I wanted to wrap up this series by showing you on a real-life example how we can “help” VertiPaq (and Power BI consequentially) to get the best out of report performance and optimal resource consumption.
Thanks for reading, hope that you enjoyed the series!
Last Updated on July 20, 2021 by Nikola


Sérgio. Silva
Great articule. Kind regards from Portugal.
Nikola
Thanks Sergio, much appreciated! Greetings to you from Austria:)
Ray Ludeña
Thank Sergio.
Very interesting this article.
I have a question. These recommendations also could use in other visualizator like Qlik, right?
Regards from Perú
Nikola
Hi Ray,
Some of these rules are generally applicable (like, for example, eliminating columns/rows you don’t need), but I really don’t have any experience with Qlik, so I don’t know how it stores or compresses the data. The example from my article relates to the Tabular model, which runs in the background of SSAS Tabular, Power BI, and Power Pivot for Excel.
Wederley
Very interesting and useful article! Thanks for sharing!
Greetings from Brazil.
Nikola
Thanks Wederley, I’m glad that you find it useful! Greetings from Austria.
Srecko
Dobar i korisan clanak Nikola!
Nikola
Hvala Srecko
Denisse
Hello, when you remove the columns or reduce the rows, do you do it at the source or in Power Query?
Thank you,
Denisse
Nikola
Hi Denisse,
You can do it at both places. When I write a native SQL query to import the data, I’m removing unnecessary rows and columns on the source side, to preserve the query folding afterward. While, when I import the table in a “regular” way, I’m filtering data in the Power Query editor.
Hope this helps.
Bob
Hi Nikola,
very usefull to optimize our semantic model and keep it in the fabric f16 sku! saves a lot of $.
kind regards,
Bob