
While creating reports, I’m sure that you are facing situations when you get “(blank)” as a result and you don’t want to display it like this to your end users. Of course, keeping blanks makes sense in some cases, but most common scenario is that you want to display something else instead of it (0 when it comes to numbers, or maybe ‘N/A’ or ‘Unknown’ when working with text).
Possible solutions
So, what are the options to handle blanks in Power BI. Let’s check directly there…
I will use Stack Overflow 2013 database. This database contains tables with more than 20 million records, so if you want to measure performance, it’s definitely better than playing with Adventure Works or similar databases.
Let’s say that I want to see how many comments were left in every single year. First, since there is no specific year value in the database, I need to create a calculated column Year Comment, using the following formula:
Year Comment = YEAR(Comments[CreationDate])
The next step is the creation of a measure which will count all comments.
Total Comments = COUNT(Comments[Id])

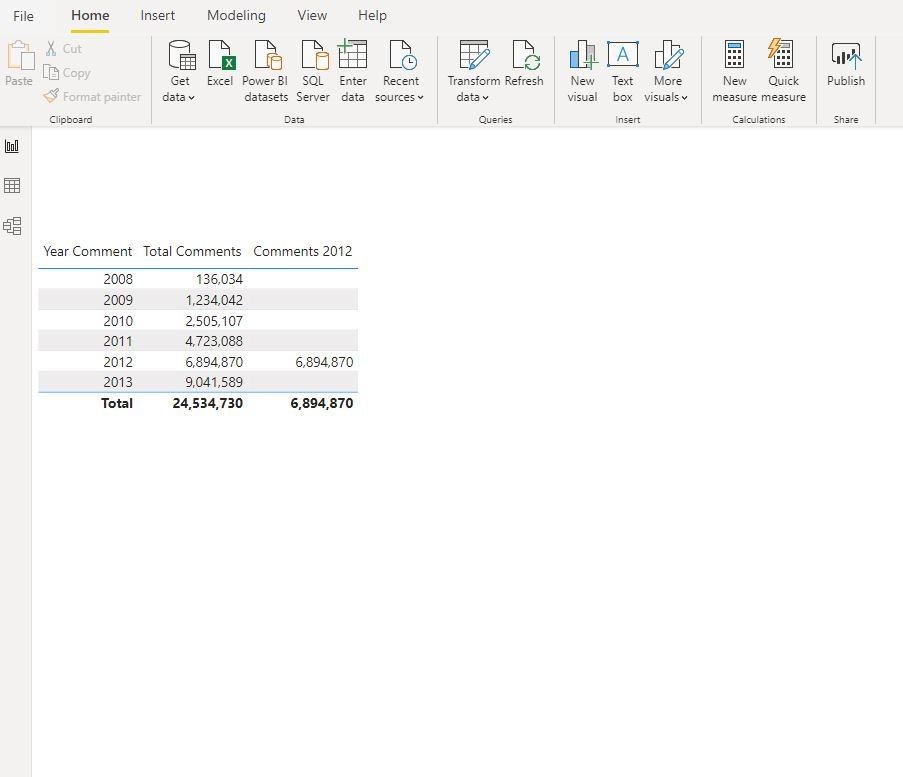
Here, we get total number of comments per year. Now, let’s say that we want to calculate how many comments were left in 2012 exclusively. This can be done in many different ways, but I’m using following formula:
Comments 2012 =
CALCULATE (
    [Total Comments],
    FILTER (ALL(Comments[Year Comment]), Comments[Year Comment] = 2012 )
)
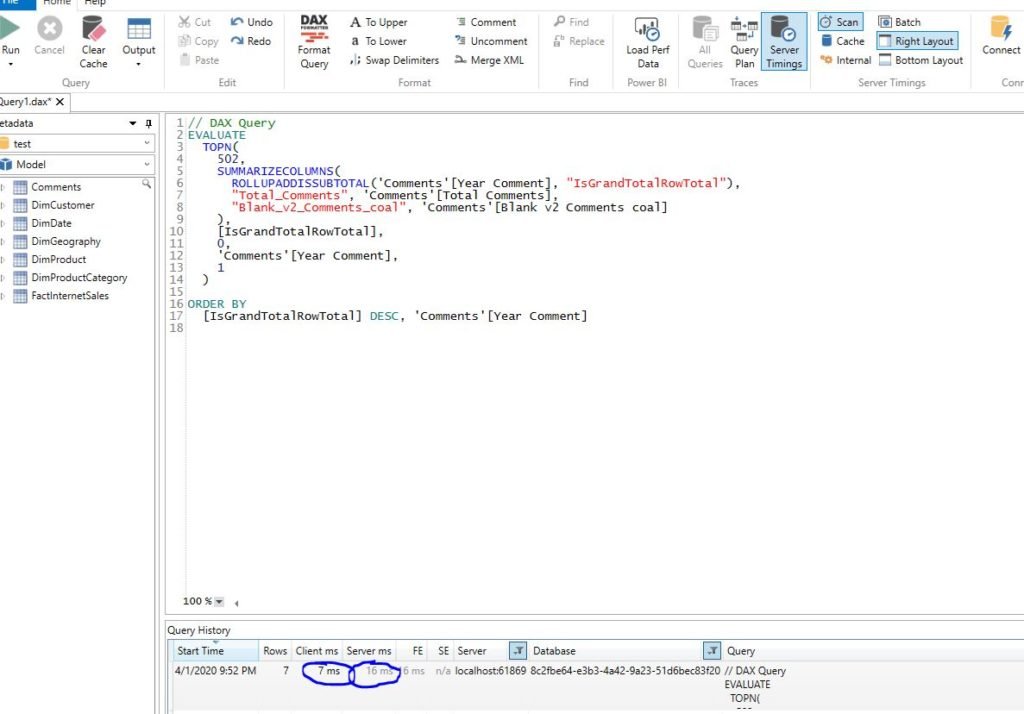
Let me stop for a moment and introduce you DAX Studio. Maybe some of you are familiar with this tool, but if you writing DAX on regular basis and working with Power BI on a daily level, this tool is a MUST! I will not go into details about what features does it offer – I would honestly say that it’s awesome and most important – it’s completely FREE! So, go and download DAX Studio immediately:)…
I will use DAX Studio to measure the performance of my visual. Let’s connect our .pbix file to DAX Studio and add our newly created measure to the report.
I’m also turning on Performance Analyzer under the View tab in Power BI, in order to catch the query which will be executed in the background. Here is the query which Power BI generated to display what we want:
// DAX Query
EVALUATE
  TOPN(
    502,
    SUMMARIZECOLUMNS(
      ROLLUPADDISSUBTOTAL('Comments'[Year Comment], "IsGrandTotalRowTotal"),
      "Total_Comments", 'Comments'[Total Comments],
      "Comments_2012", 'Comments'[Comments 2012]
    ),
    [IsGrandTotalRowTotal],
    0,
    'Comments'[Year Comment],
    1
  )
ORDER BY
  [IsGrandTotalRowTotal] DESC, 'Comments'[Year Comment]
Now, let me stop for a moment and try to explain what is going on in the background. When you interact with the visuals in Power BI, every time query is being generated and sent to Analysis Services (Tabular) engine (Vertipaq), which runs in the background and doing the “dirty” job.
In the following picture, we can see how Vertipaq coped with this query:

Solution #1: Using IF
Now, we get to handling blank values in the visual. The first scenario is the most obvious and most used I guess. The measure which can solve blanks is as follows:
Blank v1 comments =
IF (
    ISBLANK (
        CALCULATE (
            [Total Comments],
            FILTER (ALL(Comments[Year Comment]), Comments[Year Comment] = 2012 )
        )
    ),
    0,
    [Total Comments]
)
And, we get the following results:
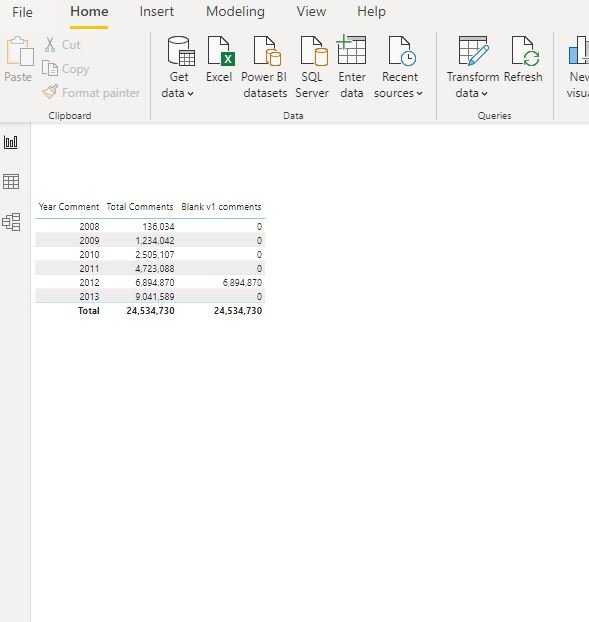
So, here we are: instead of blanks, we are displaying zeros. Let’s check how this query performed:

Of course, differences are not that big with simple measures, but with complex DAX and different filtering contexts, on multimillion rows tables, variations can be significant.
Solution #2: COALESCE()
Recently, Power BI introduced a completely new function: COALESCE(). For those coming from the SQL world, this is a well-known function, but let me explain briefly for those who are not familiar with it. Basically, COALESCE will walk through the values passed as arguments and return the first non-blank value (not null in SQL).
COALESCE(column1, column2, column3…columnN)
So, COALESCE will check column1, if the value is blank, it will go to check column2 value. If it is also blank, it will continue, until it finds the first non-blank value. As the last argument, you should assign value you want to return in the case that all checked arguments returned blank, something like:
COALESCE(column1, column2, column3…columnN, 0)
Let’s create a measure for our report using COALESCE function:
Blank v2 Comments coal =
COALESCE (
    CALCULATE (
        [Total Comments],
        FILTER (ALL(Comments[Year Comment]), Comments[Year Comment] = 2012 )
    ),
    0
)
Results are exactly the same:

Let’s check the performance of this measure:
Solution #3 Trick with 0
This is a little trick I saw Jeffrey Wang using. For those who don’t know, Jeffrey Wang is one of the DAX most-recognized names.
What’s the trick? In DAX, blank + 0 is 0! Yes, I know, for us coming from SQL environment, who think of blank as a NULL twin from SQL, it’s completely unexpected behavior. Try to run the following command in SQL Server Management Studio:
select NULL+0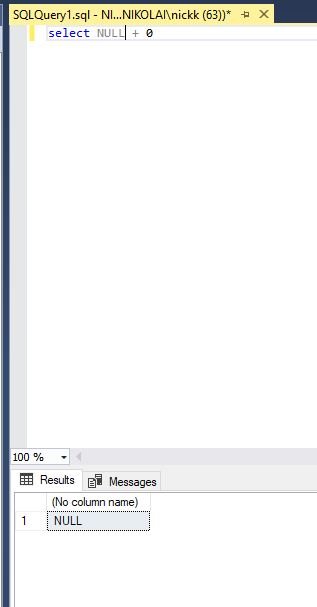
As you thought – the result is NULL. In SQL, NULL+something is always NULL…In DAX, it is not:)
So, let’s try this solution in our report:
Blank v3 Comments 0 =
CALCULATE (
    [Total Comments],
    FILTER (ALL(Comments[Year Comment]), Comments[Year Comment] = 2012 )
) + 0
Results are again exactly the same:

Finally, let’s see what happened in the background:
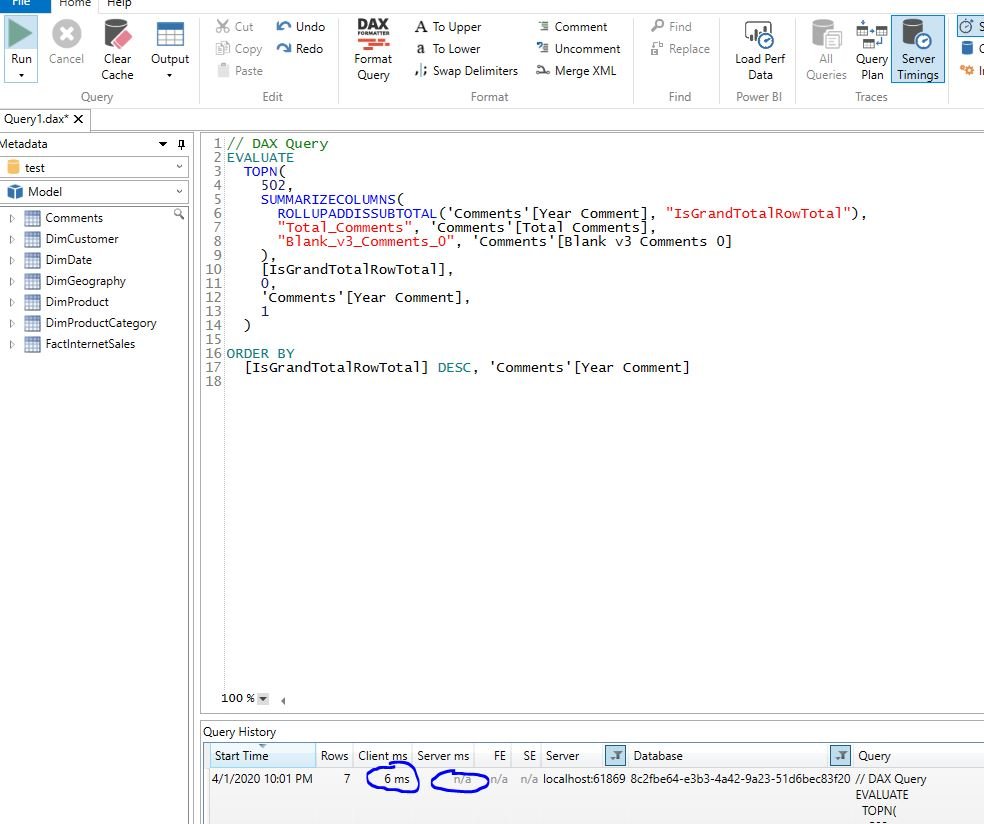
Not that bad, ha:)
Conclusion
As you could see, there are multiple ways of handling blank values in DAX. Depending on your data set, you should test different possibilities and choose one that best suit your needs.
Last Updated on July 26, 2021 by Nikola