If you’ve been working in enterprise data for a while, you’ve probably experienced the following scenario: the marketing team calls a customer anyone who’s ever downloaded a whitepaper from your company’s website. Sales defines a customer as someone with an active contract. And finance? They only count someone as a customer after the first payment clears. Same word, three different meanings, and chaos in every cross-functional dashboard. Welcome to the world of semantic drift – the silent killer of data initiatives that Microsoft Fabric IQ is designed to eliminate.
Announced at Microsoft Ignite 2025, Fabric IQ represents a fundamental shift in how Microsoft Fabric operates. While the rest of the platform has been laser-focused on where your data lives (lakehouses, warehouses, eventhouses), Fabric IQ is obsessed with what your data means.
This is the excerpt from the “Analytics Engineering with Microsoft Fabric and Power BI” book, that I’m writing together with Shabnam Watson for O’Reilly. You can access the early book release here.
Ontology at the core
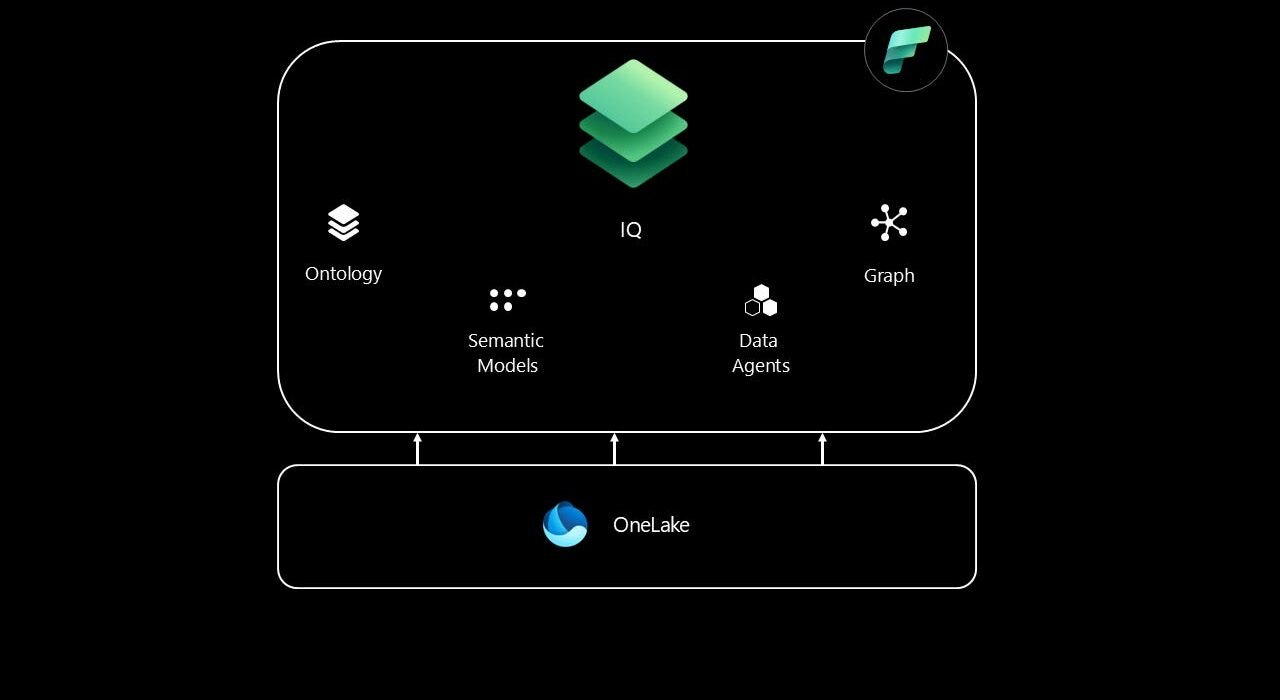
At its core sits the Ontology item – think of it as the Rosetta Stone for your business. An ontology is a shared, machine-understandable vocabulary that defines the things in your environment (represented as entity types), their facts (represented as properties), and the ways they connect (represented as relationships). If you’re thinking “this sounds like a fancy data model,” you’re not far from the truth. However, there is one critical difference: unlike a data model that lives in a single Power BI semantic model or database schema, an ontology sits above all your physical data sources and provides a single source of truth that every tool, every analyst, and every AI agent can reference.
The following illustration shows the simplified overview of the Fabric IQ architecture:
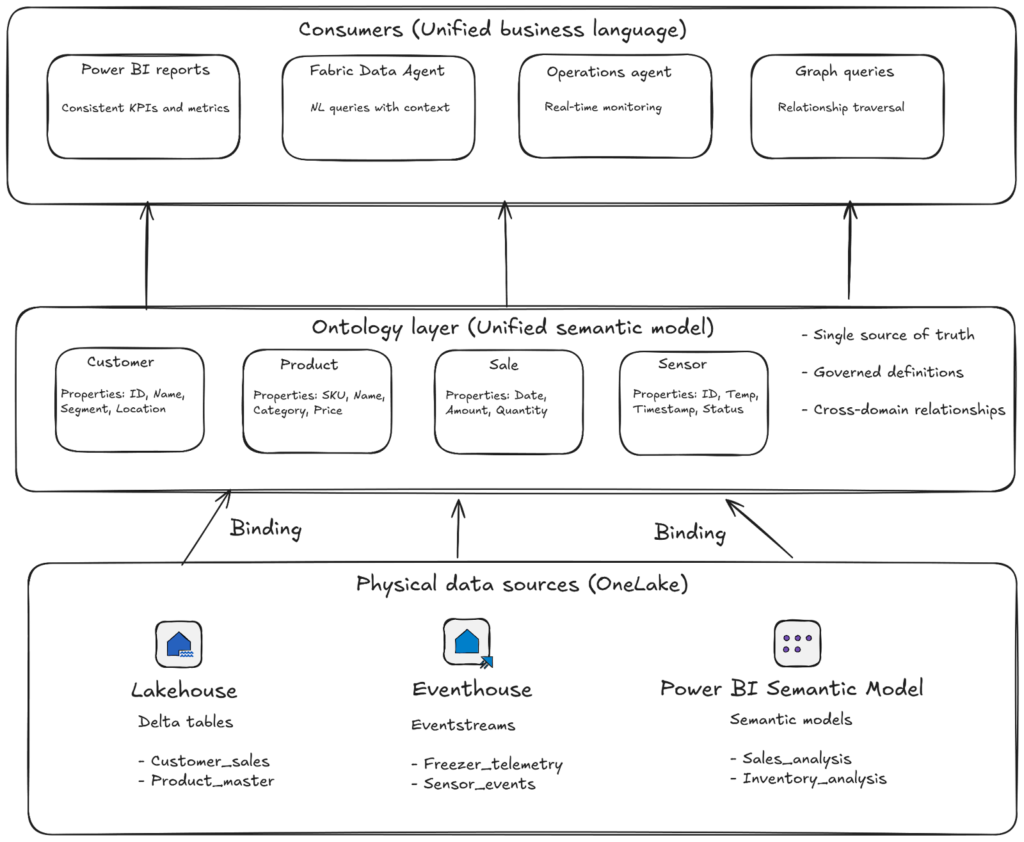
The power of Binding
The power of Fabric IQ happens through a concept called binding. When you create an ontology, you’re not just drawing boxes and arrows in a diagram – you’re rather connecting those abstract business concepts to real data living across your OneLake ecosystem. A single entity type like Customer can be bound to columns from your lakehouse tables, eventhouse streams, and even existing Power BI semantic models. The ontology handles the heavy lifting: it maps data types, defines identity keys, describes how columns map to properties, and establishes how those keys create relationships across multiple sources. This means when your marketing automation system, your CRM, and your billing platform all have slightly different customer records, the ontology can reconcile them into a single, coherent business entity. Updates in upstream sources require manual refresh, but once refreshed, every downstream consumer, whether it’s a Power BI report, a Fabric Data Agent, or an Operations Agent, sees the same unified view.
You might be wondering: “Can’t I just standardize my data upfront in a data warehouse and call it a day?” Well, sure you can. But, that only works if you control every single data source and can enforce perfect consistency at ingestion time. In the real world, you’re dealing with acquired companies running different systems, third-party APIs with their own schemas, and legacy databases that predate your entire career. The ontology approach says: “Let the data be messy at the source level, but enforce semantic consistency at the consumption layer.” It’s the difference between trying to make everyone speak the same language versus having a really good translator.
What makes Fabric IQ particularly powerful for Real-Time Intelligence workloads is its integration with Graph capabilities in Microsoft Fabric. While traditional analytics asks “what happened?” and “why did it happen?”, graph-enabled ontologies let you traverse complex relationships to answer questions like “Which stores have fewer ice cream sales when their freezer temperature rises above -18°C?” or “Find all shipments exposed to risky routes and the related cold chain breaches that resulted.”
The ontology declares which things connect and why, while the Graph engine stores and computes those traversals with sub-second performance. This isn’t just about drawing pretty network diagrams. It’s more about enabling AI agents and analysts to follow cause-and-effect chains across domains that traditional SQL joins simply can’t handle efficiently.
The real-world applications of Fabric IQ are already emerging across industries. Some companies are leveraging ontology in Fabric IQ to unify transmission and distribution grid data, breaking down the silos created by traditional relational databases. By structuring relationships between assets, events, and operational domains, such as weather systems, outage management systems, GIS data, and telemetry data, they’re building a foundation for advanced forecasting and risk evaluation.
In the retail sector, companies are using ontologies to link sales transactions, supply chain events, IoT sensor data, and customer behavior into unified business entities that Operations Agents can monitor in real-time. When a freezer temperature sensor crosses a threshold, the agent doesn’t just send an alert – it understands the downstream implications for inventory spoilage, sales impact, and customer satisfaction, because all those concepts are explicitly modeled in the ontology.
Despite its emerging popularity, Fabric IQ is not a silver bullet. If your organization struggles to agree on basic definitions now, an ontology won’t magically create consensus. What it will do is make those disagreements painfully obvious. The power comes when you commit to treating the ontology as a living, governed artifact with clear ownership, approval workflows, and version control. When that happens, you unlock benefits that cascade through your entire data ecosystem: consistent semantics across tools, fewer one-off models, less duplicated logic, and most importantly, AI agents that can move beyond answering questions to taking safe, auditable actions.
Because when business rules and constraints live in the ontology rather than scattered across 47 different Power BI semantic models and Fabric notebooks, your AI systems finally have the context they need to not just be helpful, but to actually understand your business.
Build your first Ontology
Let’s quickly see Fabric IQ in action. In this section, we will build our first Ontology. At the moment of writing, there are two options for creating an ontology:
Generate Ontology from semantic model – automatically generates an ontology on top of the existing Power BI semantic model
Build directly from OneLake – manually create the ontology by binding properties directly from OneLake
In our example, we will build an Ontology directly from OneLake. Before we start, there are certain prerequisites – you must enable specific settings on your Fabric tenant. All these settings can be found under the Tenant settings tab of the Admin portal.
Enable Ontology item
User can create Graph
Allow XMLA endpoints and Analyze in Excel with on-premises semantic models – required only if you want to generate an ontology from a semantic model
The following settings are required only if you want to use ontology with a Fabric Data agent:
Users can create and share Data agent item types
Users can use Copilot and other features powered by Azure OpenAI
Data sent to Azure OpenAI can be processed outside your capacity’s geographic region, compliance boundary, or national cloud instance
Data sent to Azure OpenAI can be stored outside your capacity’s geographic region, compliance boundary, or national cloud instance
For this example, we will need some sample data. You can download all the necessary files from here.
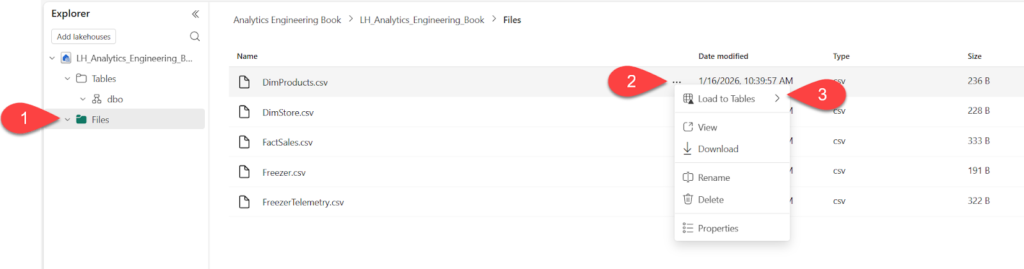
Next, let’s make this data available in the lakehouse. Let’s upload the files to the Files section of the lakehouse, and then transform them to Delta tables in the Tables section, as shown below. We will do that for all the files except the FreezerTelemetry file.
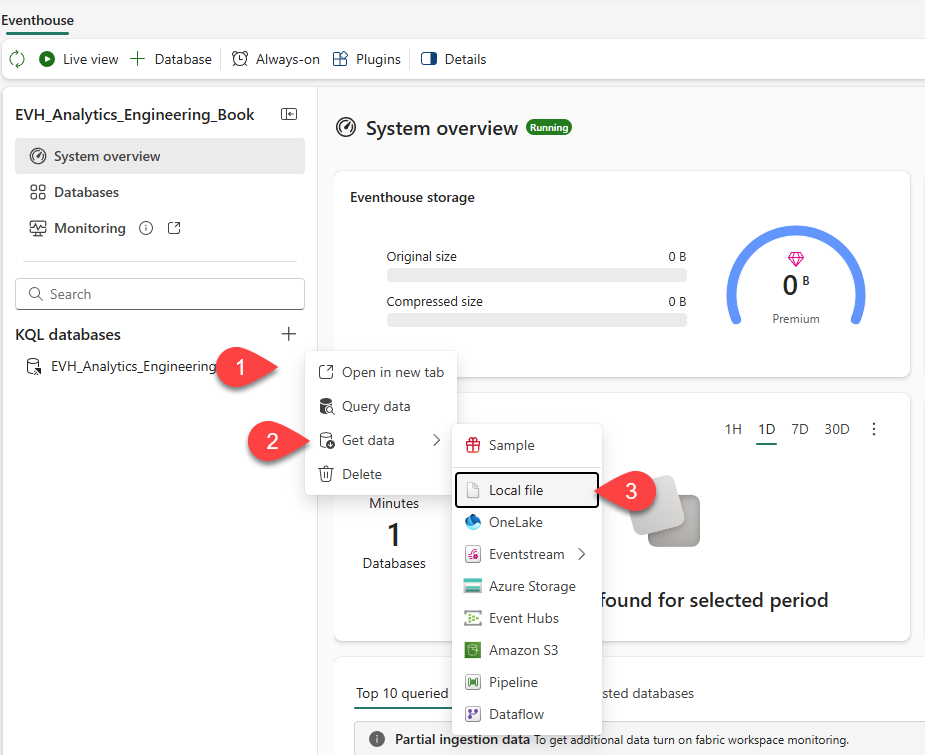
Next, we will create a new Eventhouse in the same Fabric workspace. Once the eventhouse is created, click on the three dots next to the default KQL database, choose Get data, and then Local file, as illustrated below:
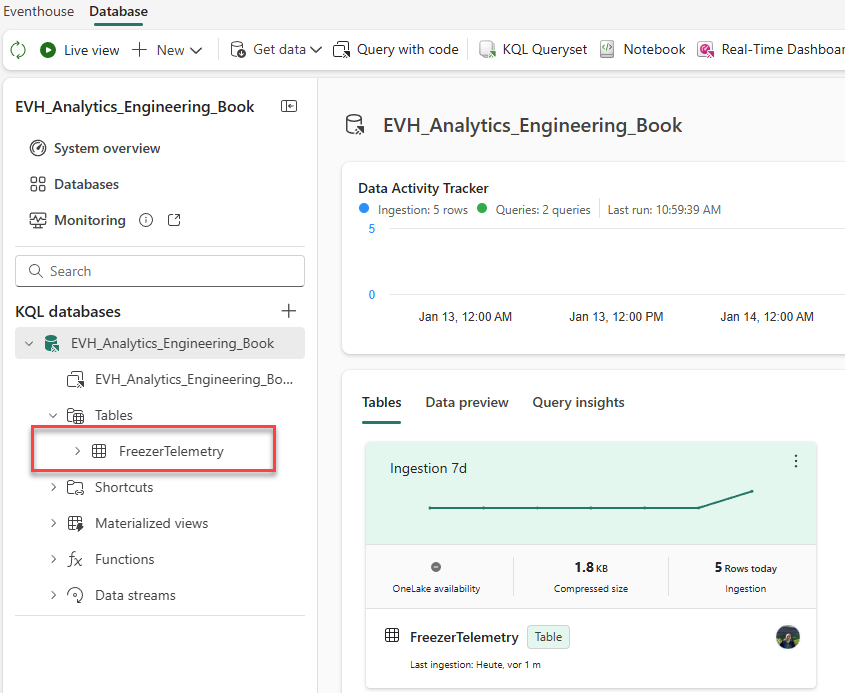
Provide the name for the table, and load the data from the FreezerTelemetry.csv file you previously downloaded. After confirming all the default settings, you should be able to see the FreezerTelemetry table in the KQL database, as shown in the following illustration:
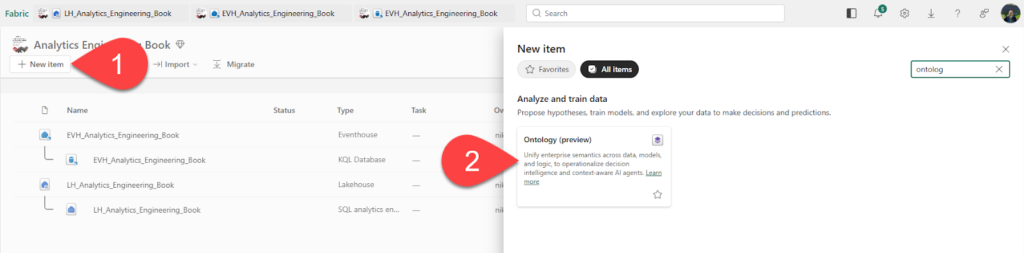
Now that the data is ready, let’s start building the ontology. Click on the New item and choose the Ontology item, as displayed below:
We’ll provide the SalesOntology as the ontology name. Now, let’s create entity types and data bindings. Entity types are the representation of your business objects. In our example, we have three business objects: store, products, and salesEvent. So, let’s first create the Store entity type in our ontology.
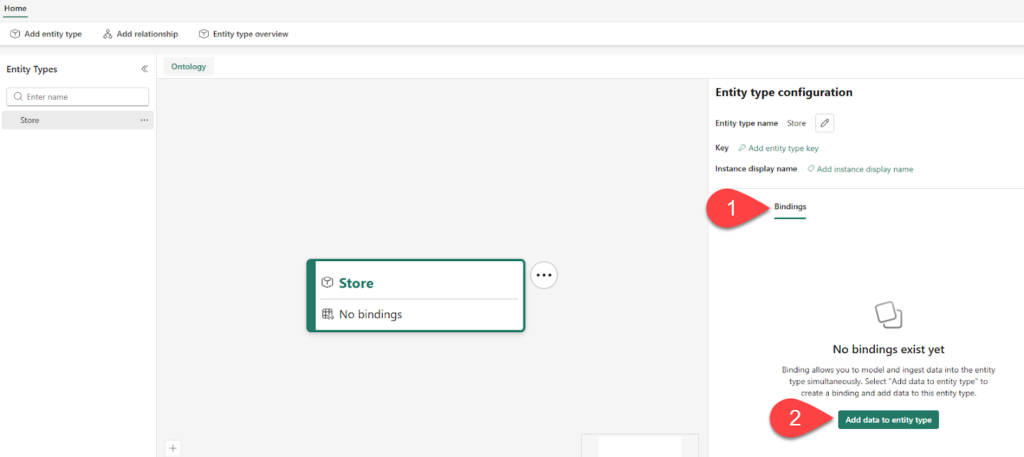
Once you create the Store entity type, you will be navigated to the configuration pane, where you can configure bindings and add data to entity type, as displayed in the following illustration:
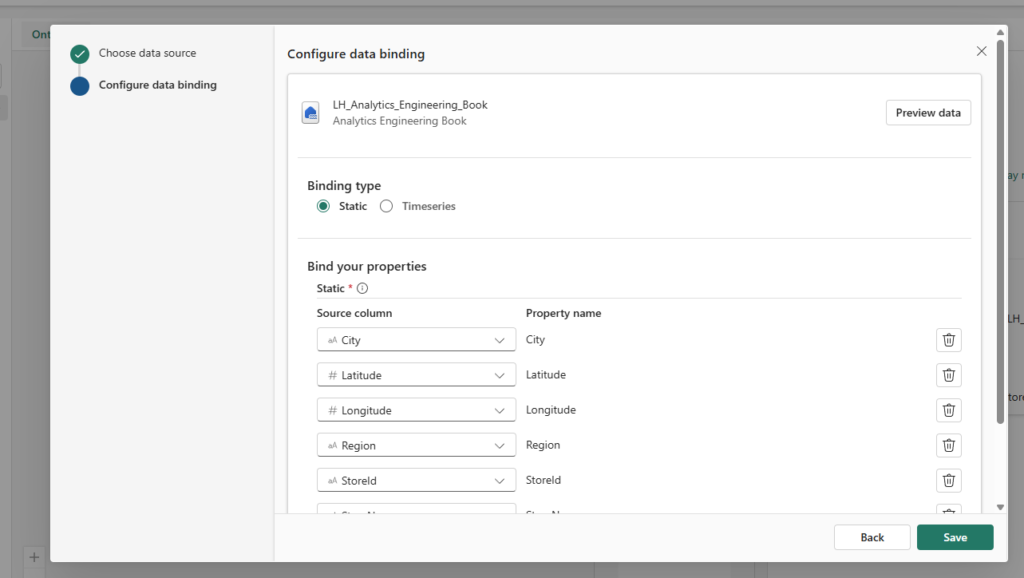
Connect to the lakehouse you previously created, and from the dropdown list, pick the dimstore table. The figure below displays the default, static binding type. The source column side lists column names in the source data, while the property name side lists their corresponding property names on the Store entity type within the ontology. Don’t change the default property names, which match the source column names.
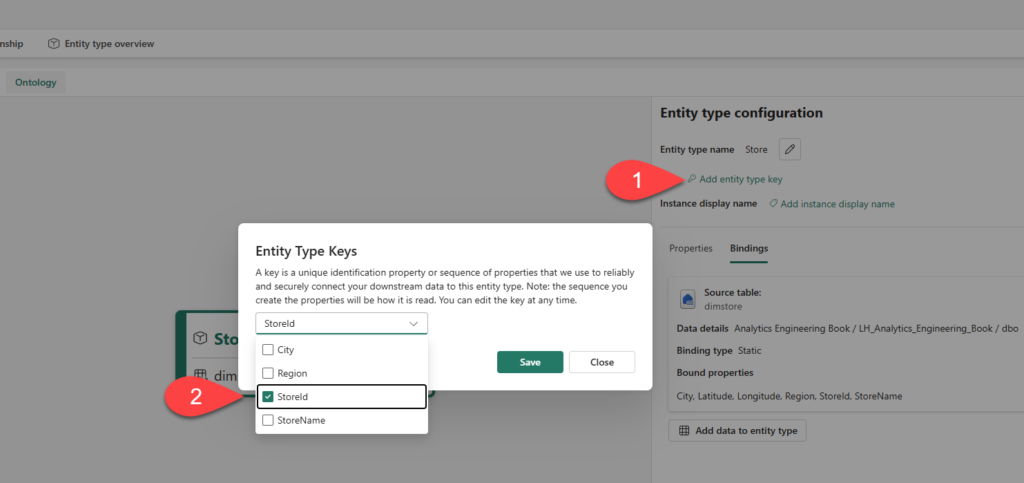
In the next step, we will add the entity type key, which is the StoreId column, as shown below:
Follow the same steps to create entity types Product and SalesEvent. Product entity maps to the dimproducts table in the lakehouse, and should use the ProductId column as a key, whereas the SalesEvent entity maps to the factsales table and should have the SaleId column as a key.
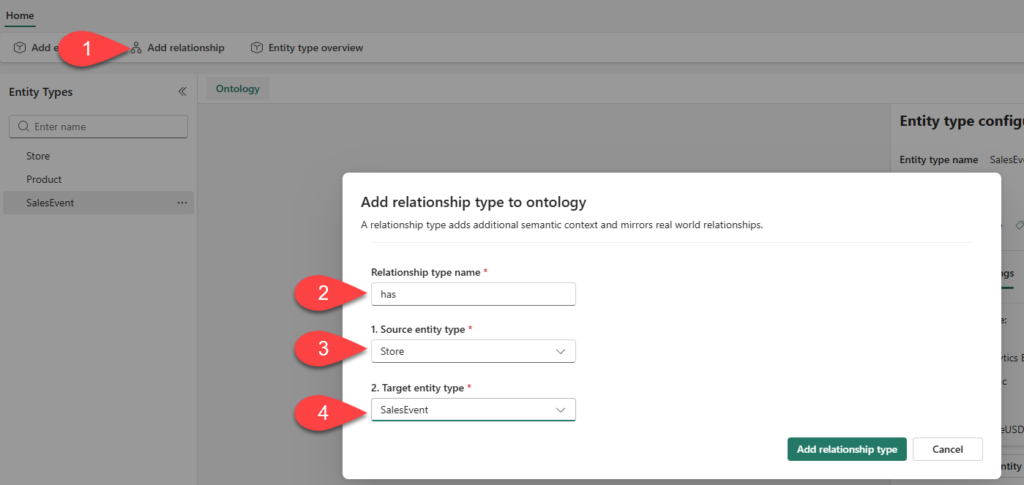
Now that we’ve created all the entities, let’s establish relationships to represent contextual connections in the data. The following illustration displays the process of creating a relationship between the Store and the SalesEvent entities:
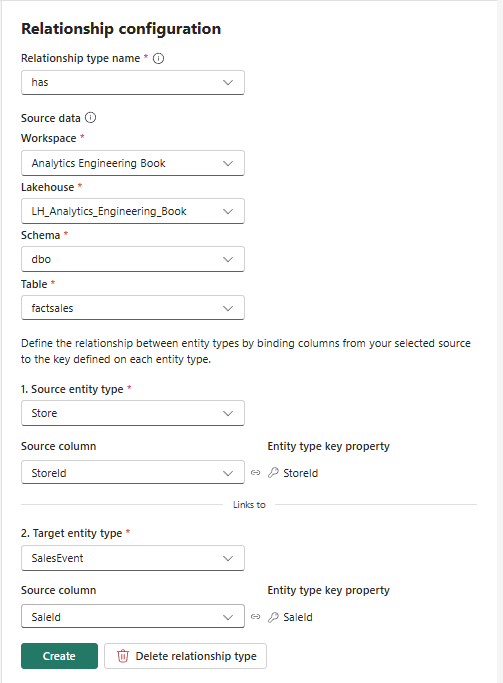
In the Relationship configuration pane, fill in the required configuration details, as displayed below:
Next, let’s create the soldIn relationship by following the same steps as in the previous relationship creation workflow. The only difference is that the source entity type is the Product, and the source column is the ProductId.
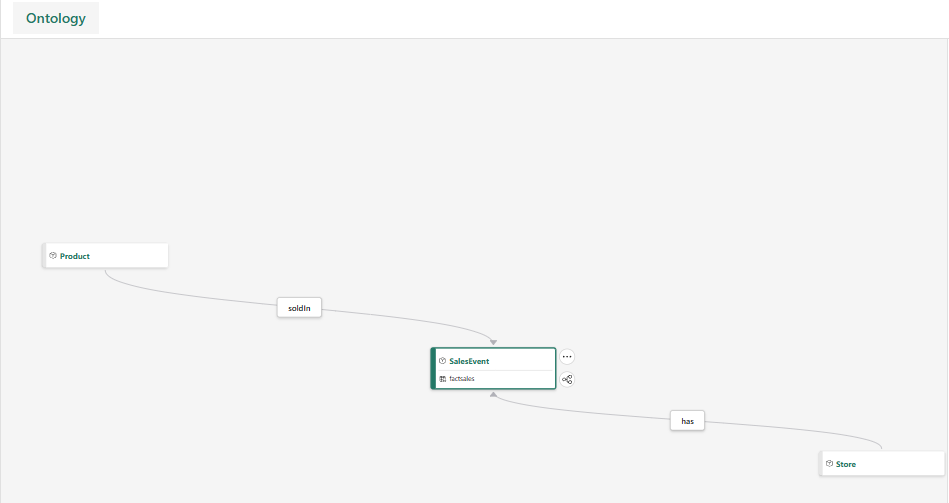
Once you complete this step, you should be able to see the SalesEvent entity with two relationships (has, soldIn) to the Store and Product entities, as shown below:
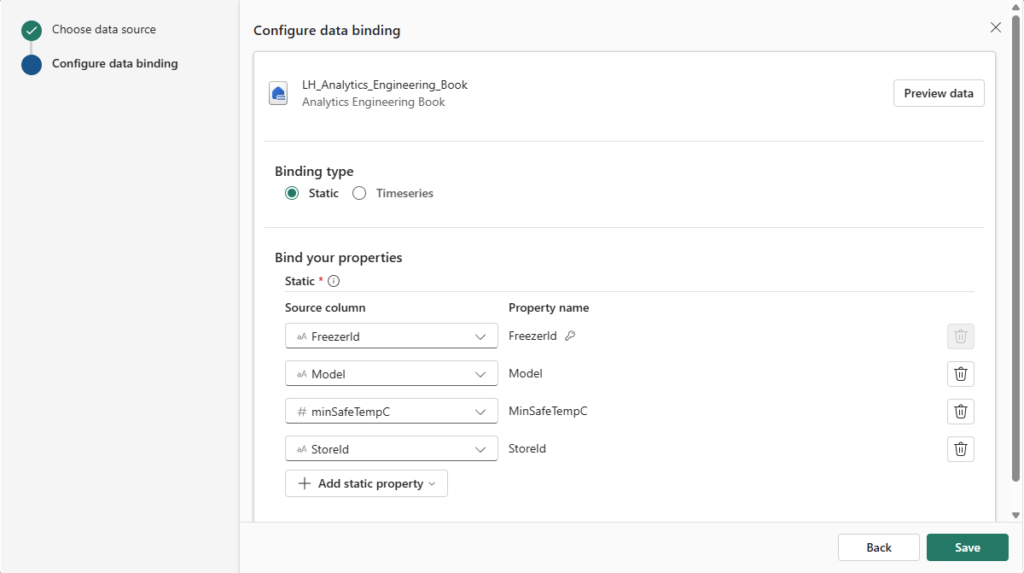
Then, add the FreezerId as the key value for the Freezer entity. Similar to the previous cases, we need to configure the binding of the Freezer entity. Pick the freezer table from the lakehouse, and configure column bindings as displayed below:
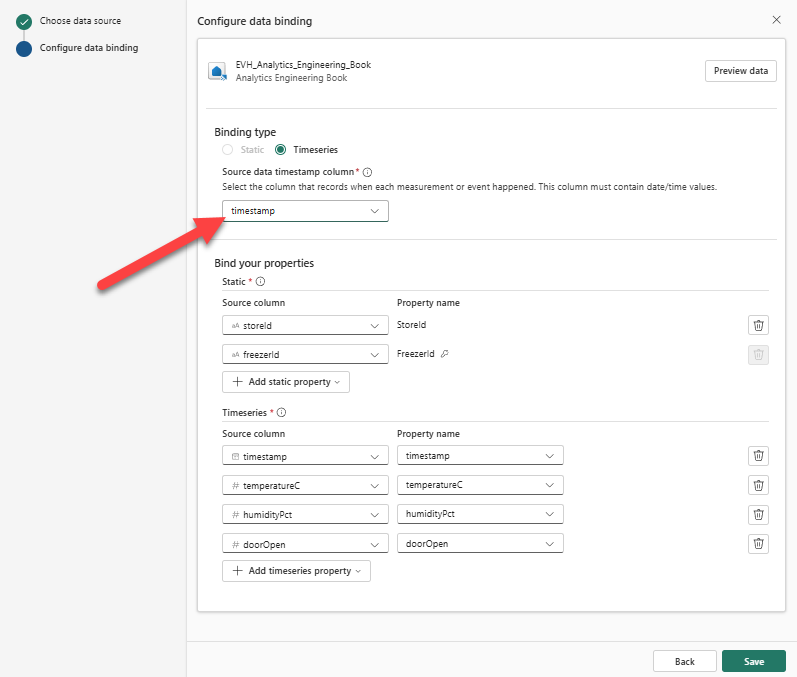
In the following steps, we will enrich our ontology with time-related data. From the Entity type configuration pane, under the Bindings tab, choose the Add data to entity type. This time, we will pick our eventhouse as a source, and the FreezerTelemetry table as a source table. The following figure shows the binding settings for the Freezer entity:
The Freezer entity now has two bindings – static, to the Freezer lakehouse table, as well as the time-series, to the FreezerTelemetry eventhouse table.
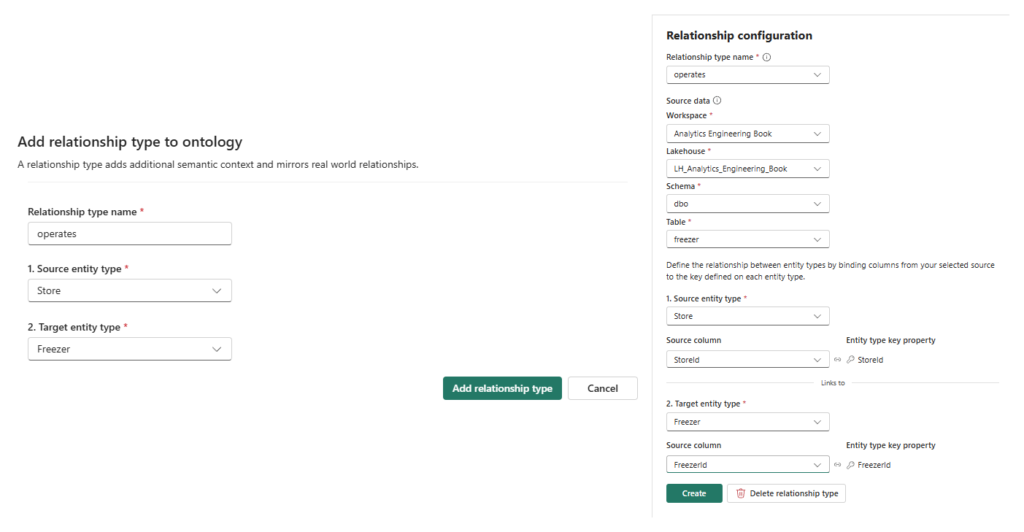
Finally, let’s establish a relationship between the Freezer and Store entities. The following figure provides all the necessary information for the relationship configuration:
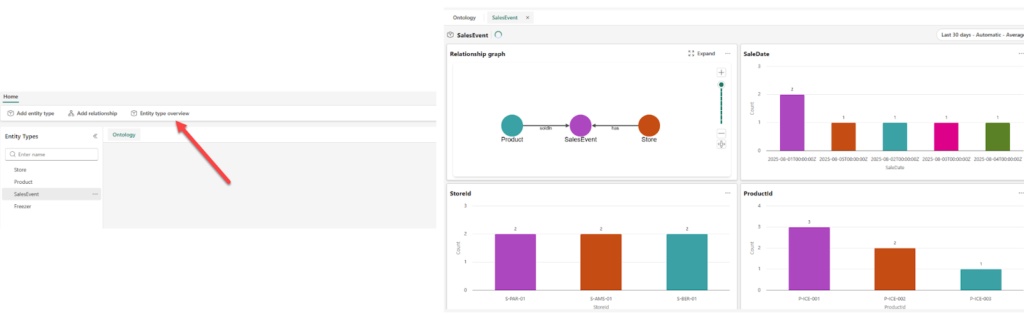
When you bound data to your entity types in the previous steps, the ontology automatically generated instances of those entities that are tied to the source data. You can get all the details at a glance by choosing the Entity type overview option from the top ribbon. This will display various information about the selected entity, as shown below:
Connecting with Data agents
As the final step, we will create a Data agent and use the ontology to provide the answers grounded in the ontology’s definitions and bindings. First, let’s create a new data agent in the same workspace we previously used to create our lakehouse, eventhouse, and ontology. We’ll name the agent: SalesOntologyAgent.
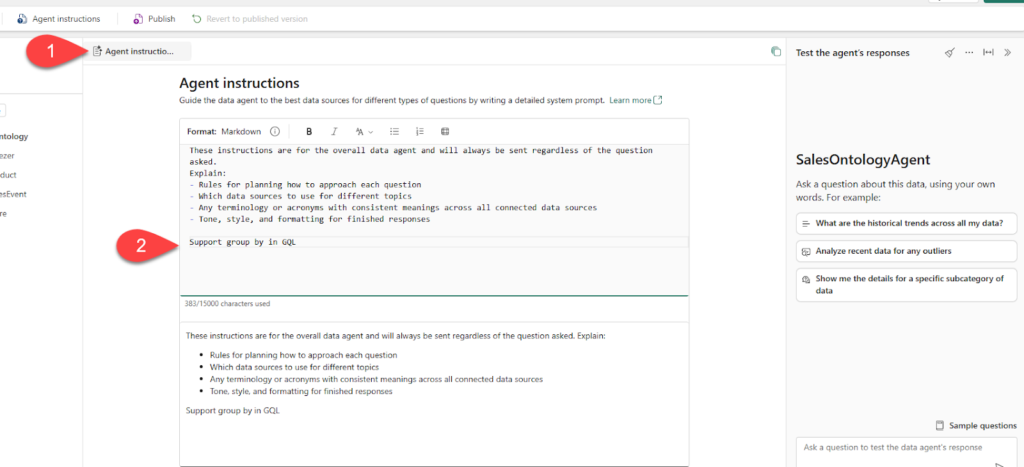
Once the agent is created, we will add the ontology as a data source. Next, let’s feed our agent with the additional instructions. Click ok the Agent instructions, and then add the “Support group by in GQL” at the bottom of the instruction window, as displayed below:
It’s time to explore our ontology by using natural language questions. For the starter, try these two prompts:
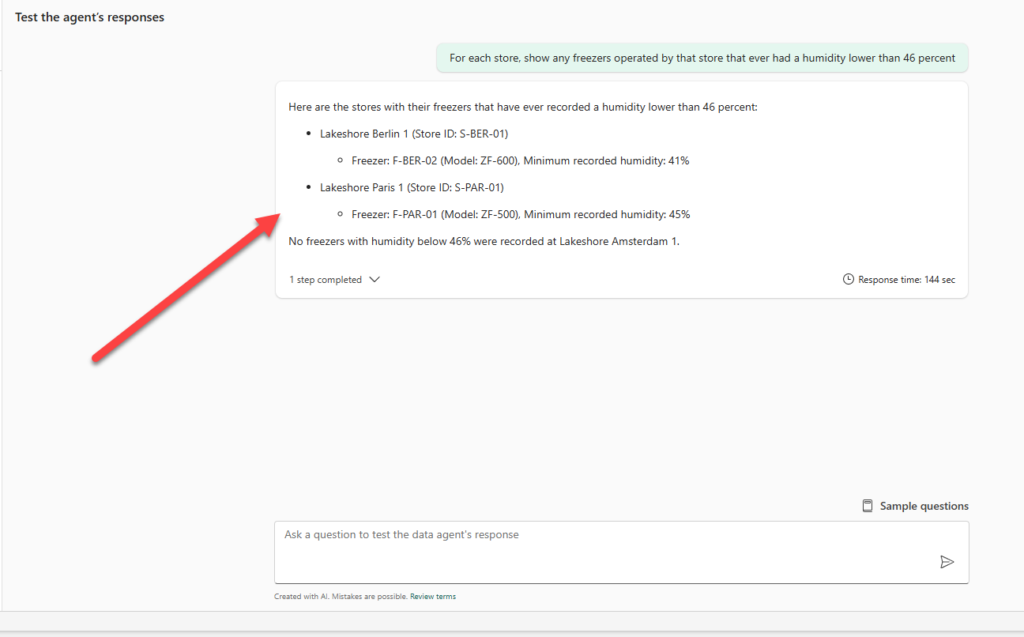
For each store, show any freezers operated by that store that ever had a humidity lower than 46 percent
What is the top product by revenue across all stores?
The figure below displays that the response references entity types, such as Store and Freezer, and their relationships, not just raw tables.
From there, you can continue exploring the ontology with a data agent by trying out some prompts on your own.
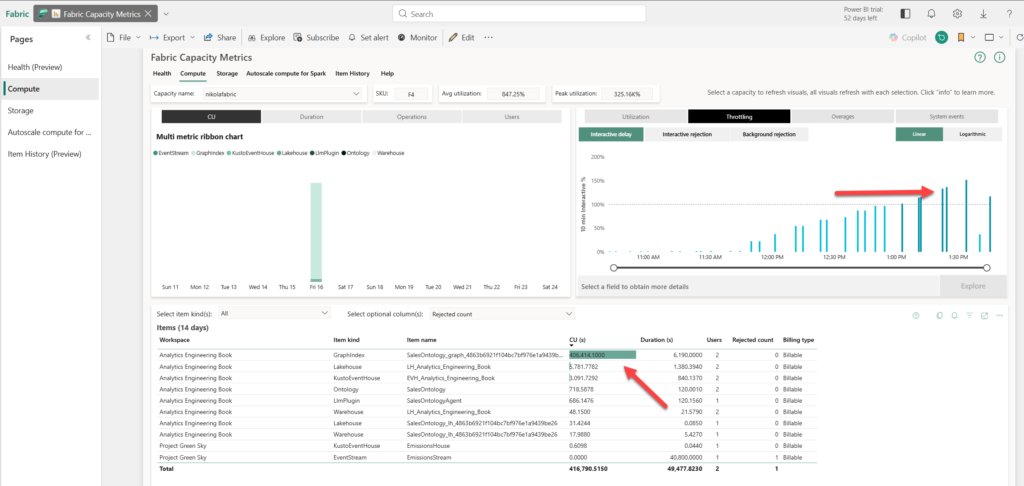
A word of warning: for this demo, I’ve been using F4 Fabric capacity, and it quickly burst!
As you can see in the illustration below, a screenshot from the Capacity Metrics App, the Graph item (Sales Ontology) exhausted all resources and caused my capacity to be throttled.
Hence, if you plan to use Fabric IQ and Ontology, make sure that your Fabric capacity is powerful enough to support these workloads.
Summary
The future is here! Bringing features like ontologies and graphs into the realm of everyday analytical tasks represents a huge leap forward in terms of how we perceive data. However, before you start creating ontologies like crazy in your Fabric workspace, please bear in mind a couple of things:
The feature is still in preview and in very early stages of life, so be prepared for the various limitations and/or glitches
Any updates made to the ontology’s upstream data sources need to be manually refreshed before they are available in the ontology item