

One of the things I like most in Power BI are – Bookmarks. For those who are not familiar, Bookmarks are one of the favorite and most used features in Power BI.
Basically, what Bookmark does, it captures the current state of the report, so you can use it for a reference in your actions through buttons, images, shapes, etc. Simply said, this will give you a possibility to create an app-like experience for your report and make it look interactive.
When space becomes a problem…
There are really dozen of use cases where you can apply bookmarking, but I will focus here on a specific problem: I would say it’s a frequent issue and I assure you that sooner rather than later you will face this problem during the report designing process.
So, we created our nice little Power BI report, everything looks fine, we have our 3-4 slicers on the page, so far, so good. But, one day our users want to have additional slicer for, let’s say, brand category. No problem, I will make existing slicers smaller and secure a space for the new one. Then, after a month or two, our users want to have one more slicer, than after another month or two, one more, etc. I think you get the point…
So, what should we do when we can’t accommodate all requested slicers on our report page? First option is to tell our users to choose which ones are the most important for them and then to discard others…Just kidding, of course you shouldn’t do that:).
We can create a separate report page which will contain slicers only? Or…we can create a slicer pane, which will hold all of our slicers on the existing report page…And we will be able to show or hide this slicer pane, depending on user’s choice.
As a bonus, we will give our users an option to reset all the slicers with one click!
Building from the scratch
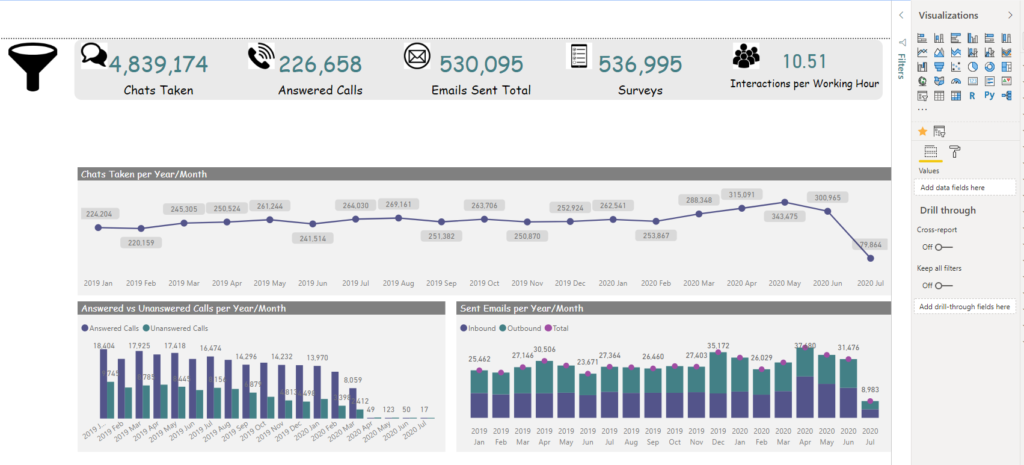
Here is how my report canvas looks like in the beginning:
First thing I’m going to do is to turn on Bookmarks Pane and Selection Pane under View tab, so I can take full control of manipulating different objects within the report.
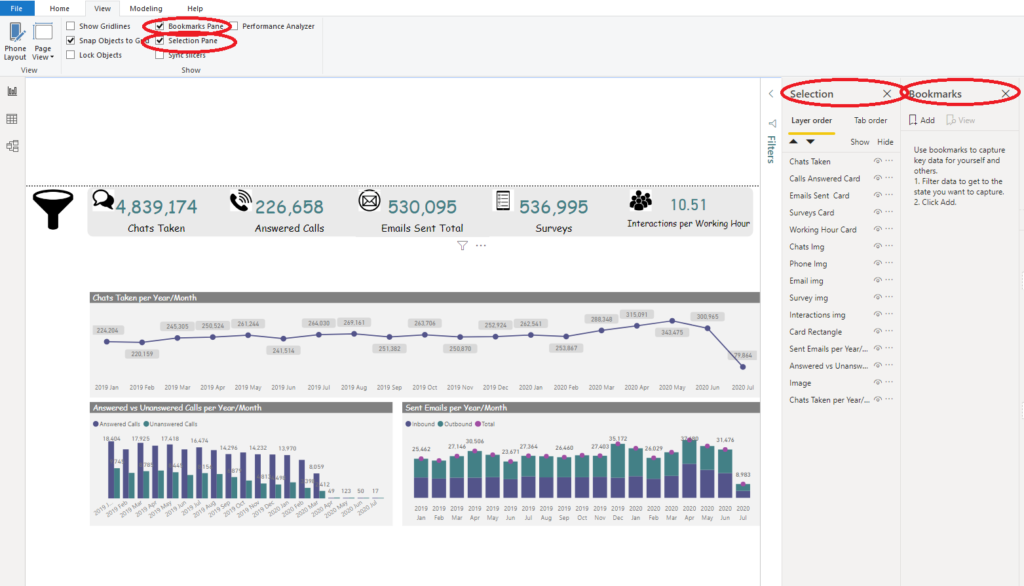
As you see, we haven’t created any bookmarks so far, but shortly and we will do.
The only “strange” item on the report canvas you can notice is the filter icon in the upper left corner. That icon will be used to open a slicer pane we are going to build.
Next step is to create all necessary slicers for the report. I’ve created 8 different slicers, based on users’ request.
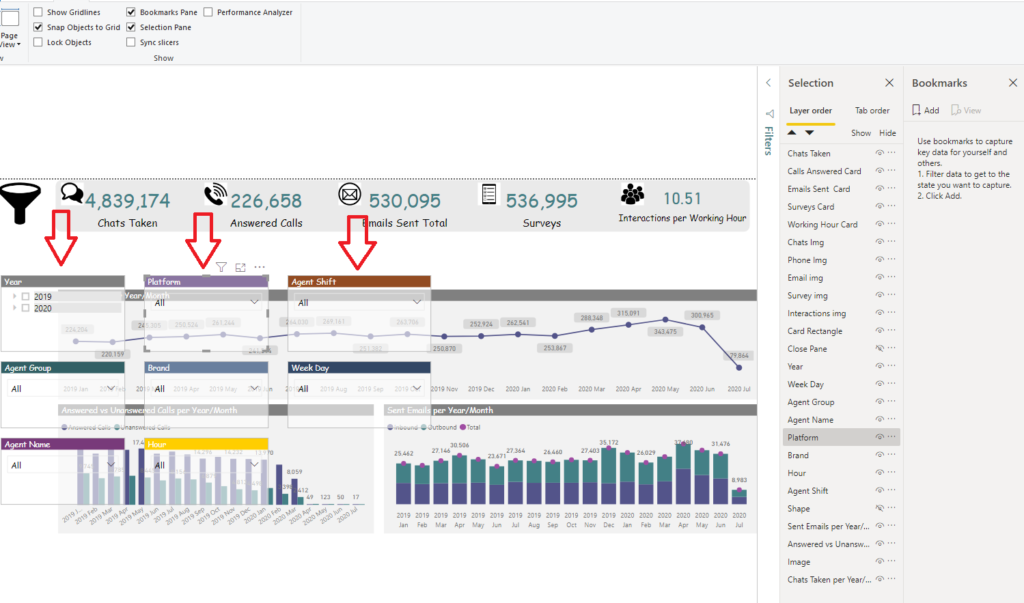
Finally, I’ll add nice rectangle shape, which will serve as a pane for all of my slicers, and icon for closing the slicer pane.
Now we have all our elements on the report page, so the next step is to define visibility of specific items within the bookmarks, and to define actions for navigating through the bookmarks.
As we have all our elements on the canvas, let’s first create bookmark which will capture current state of the page:
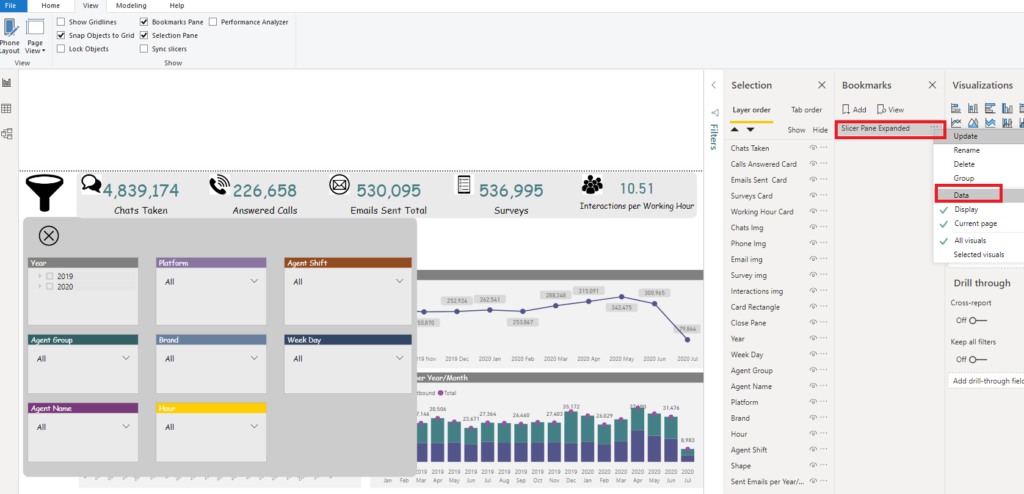
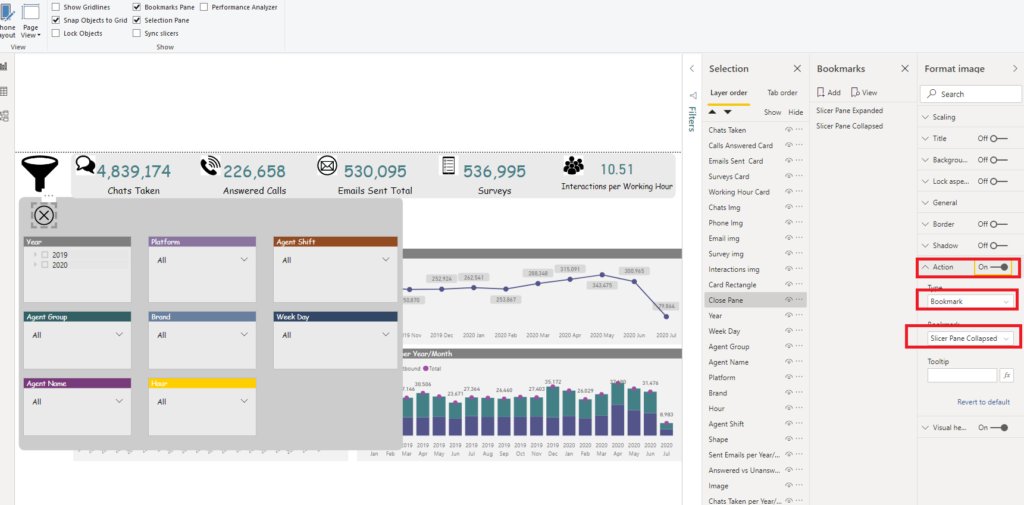
I clicked on Add and named my bookmark Slicer Pane Expanded. The most important thing is to uncheck Data option (click on three dots to open this menu), so that we can be sure that slicers aren’t reset when users switch between the bookmarks.
Now, let’s set Action property of our filter icon, so we can specify what do we want it to do:
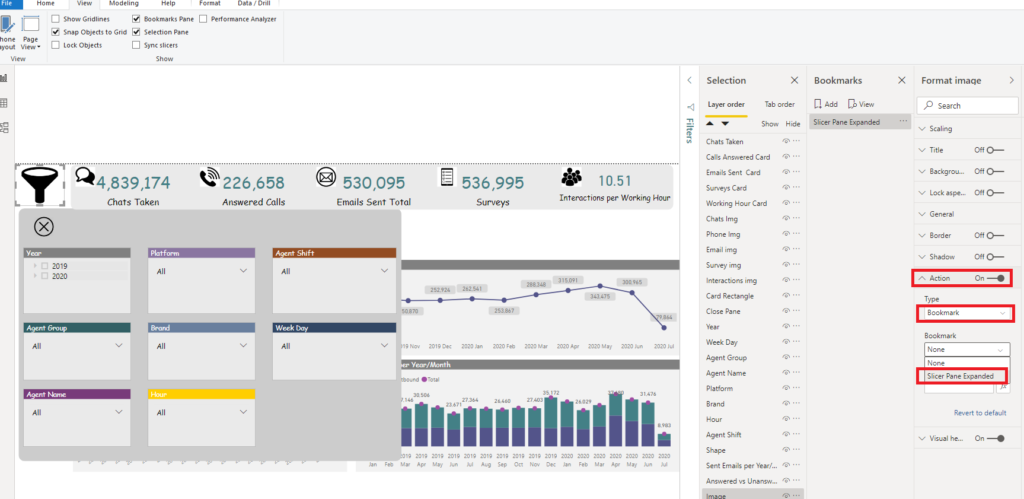
By doing this, we instructed our icon to navigate us to the report state captured by Slicer Pane Expanded bookmark.
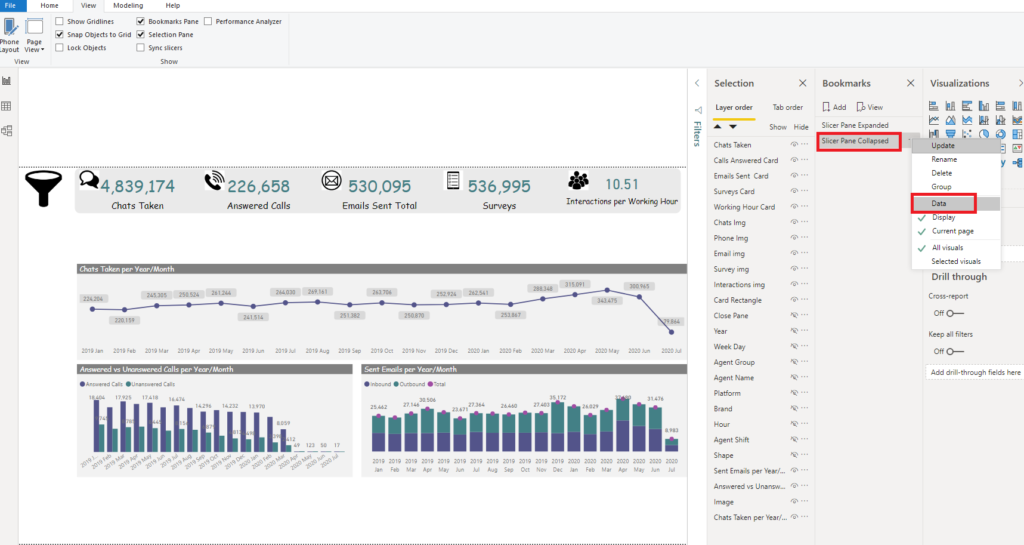
Now, let’s set the state when the slicer pane is collapsed. First, I’ll hide all items related to slicer pane in Selection:

I can now create a new bookmark, called Slicer Pane Collapsed, using the same rules as in the previous step:
One important remark from my side regarding Selection pane: by dragging elements up and down, you are defining the order of visibility on the report page! That means, if rectangle shape which serves as a slicer pane is above our slicers in Selection pane, and the rectangle is not transparent, it will cover our slicers and they will not be visible. So, make sure that you define the right order of elements here.
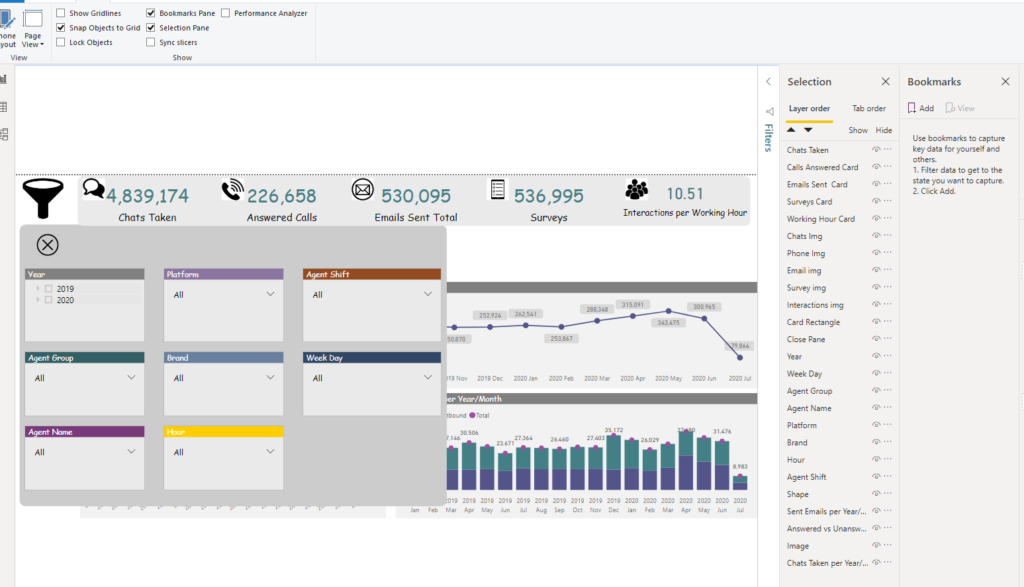
Once I do CTRL + click on our filter icon, look what happens:
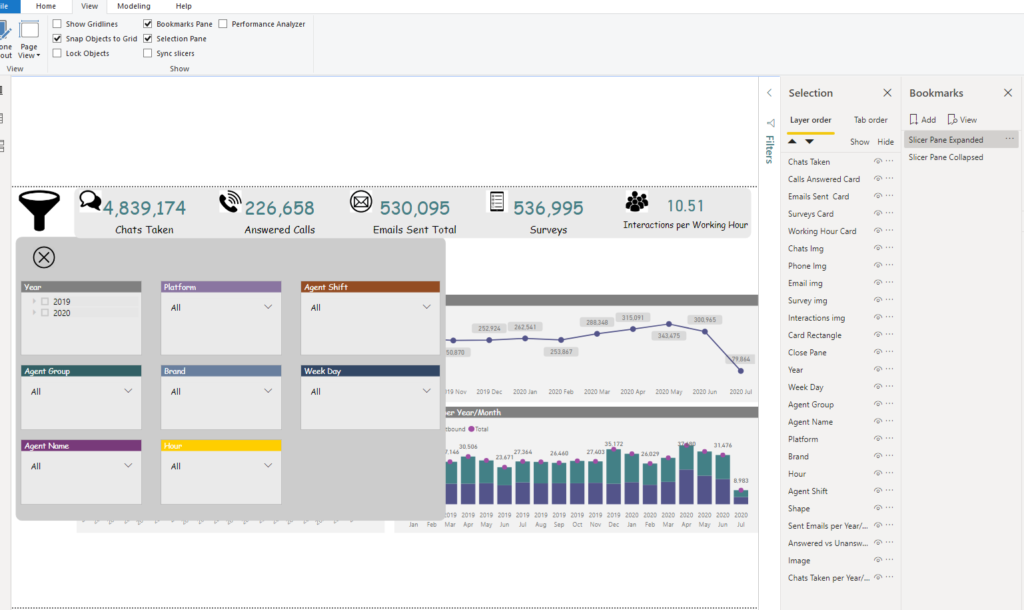
Our slicer pane is there! And I can select whatever values I want in my slicers, they will be propagated to a visuals “behind”. One last thing to configure here is to define action for an icon for closing the slicer pane:
And now, let’s check how it works in reality:
Awesome, isn’t it?
Bonus tip – Reset all filters with one click!
Now, the final touch to make our users even more happy…It would be quite cumbersome when someone chooses 8 different values in 8 different slicers to go back to the default selection. One would have to click one by one slicer and clear the selection.
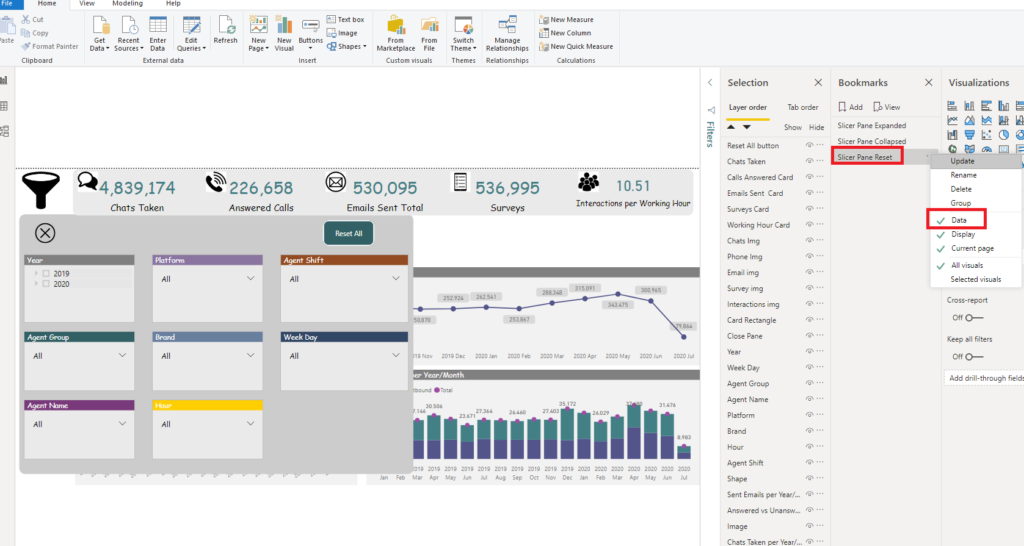
So, let’s help our users with this! First, I will put blank button within the our newly created Slicer pane. I’ve formatted the button to look nicer and to “tell” our users what is it about – I think that “Reset All” is self-explanatory here.
Now, let’s create another bookmark, which we’ll call Slicer Pane Reset. Apply same steps as previously, but don’t uncheck Data option! This will capture current state of the page (including all the selections within slicers), so once we navigate to this state via bookmark, it will also “transfer” captured data state (in our case, it’s the state where all slicers are reset to default):
Once again, let’s check if everything works as expected:

Absolutely perfect!
Conclusion
As you witnessed, we pushed filtering experience to a whole new level, using bookmarks in our report. Your users will love you – you supplied all slicers they wanted, but you also saved space on your report to accommodate more visuals or to give existing ones little more space.
Last Updated on July 15, 2020 by Nikola


Greg McDonald
I’m just getting into Power BI, but this is brilliant. I love how you laid out the explanation with some pics and a vid of the final product and how it works. Plus, the Reset All to make it simple to wipe everything off is very intuitive.
Well done! Thanks for the tip!