

One of the things that I like most in Power BI is rapid report development. In just a few clicks, results can be visible and ready for analysis. Of course, complexity comes later, but that first visual impression can be easily achieved within a few minutes.
I’m sure that most of you have your own tips and tricks for boosting Power BI development. However, I would like to share my 5 tips, which I often use during report development.
Tip #1 Measure Folders
Creating measures is a must for every Power BI report. And it’s not an issue when your report has just few measures. But, things become more complicate when you need to operate with tens, or even hundreds of measures.
To prevent that, I always use following technique to better organize my measures. By default, measure will reside in the table where you created it.
I’m using sample Contoso database and I’ve created simple measure for calculating Sales Total in FactOnlineSales table:
Sales Total = SUM(FactOnlineSales[SalesAmount])
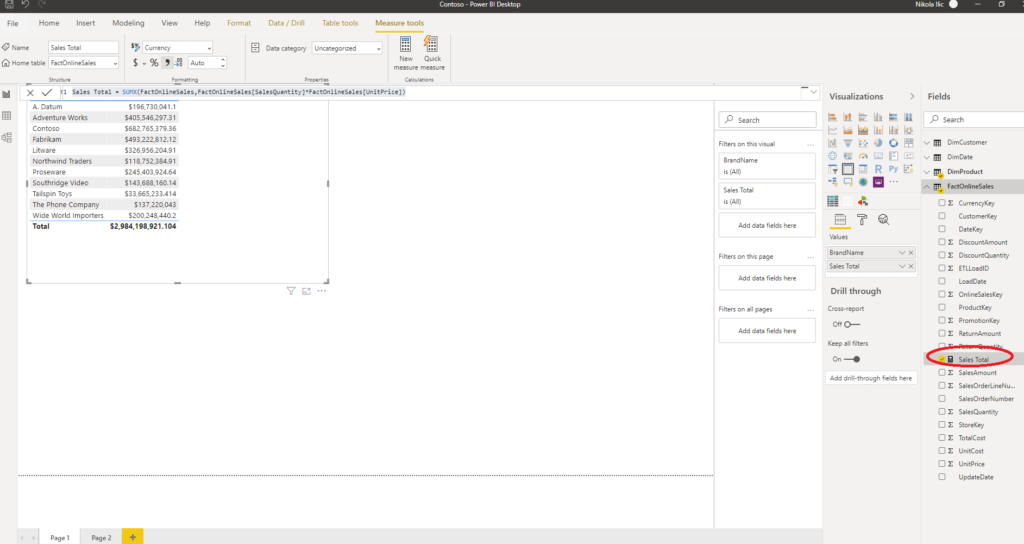
As you see, measure resides in FactOnlineSales table, where it was originally created. In order to change this, I need to create brand new table which will hold my measures.
Under Home tab, select Enter Data and create plain empty table called Sales Measures.
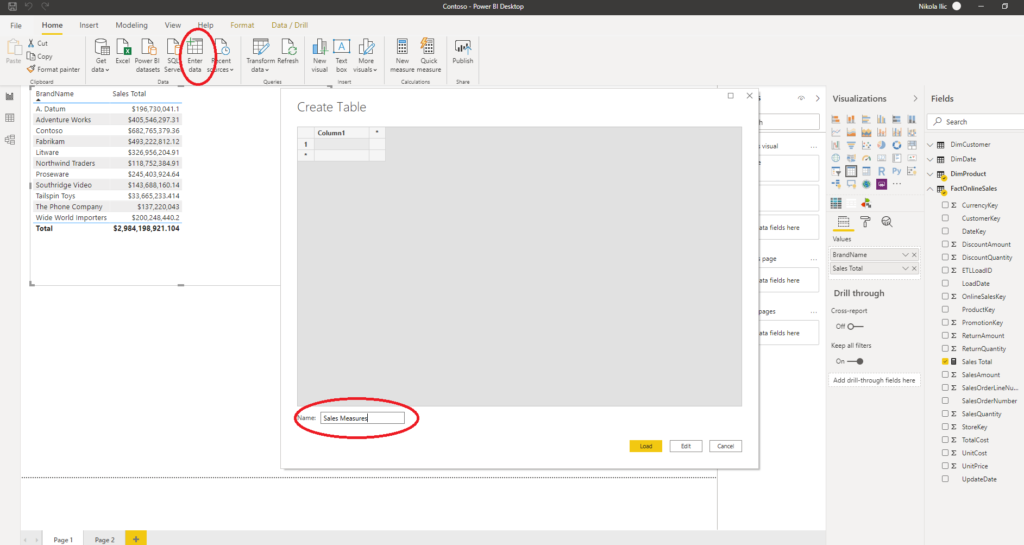
Click Load and you will see new table in your model. After that, click on your measure Sales Total, and under Home table, select Sales Measures.
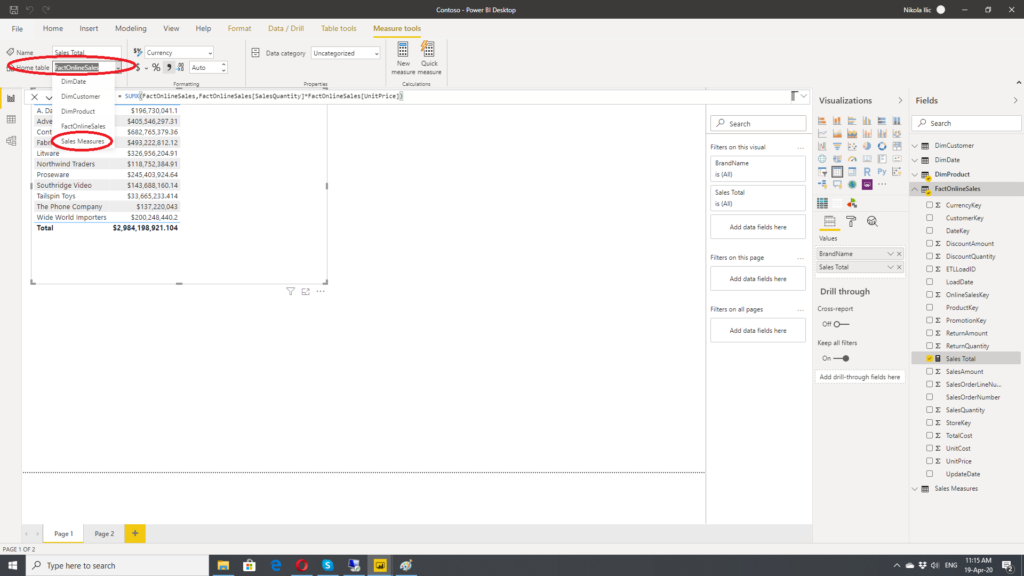
Then, just simply delete Column 1 and you are good to go. This way, you can separate and group you measures. Trust me, it will make your life much easier.
Tip #2 Disable Auto Date/Time
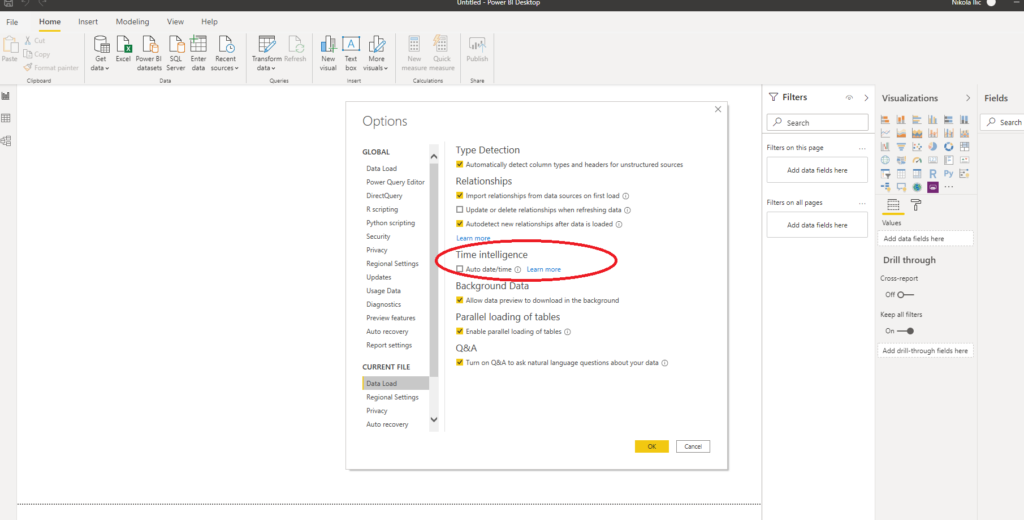
Up until latest Power BI Desktop update, there was one thing that annoyed me pretty much. When you open Options and Settings under File tab, then under Options and Data Load, there was a section for Time Intelligence. By default, check box was checked.
What that means?
Power BI automatically created hidden date tables for EVERY SINGLE field of data type date in your model!
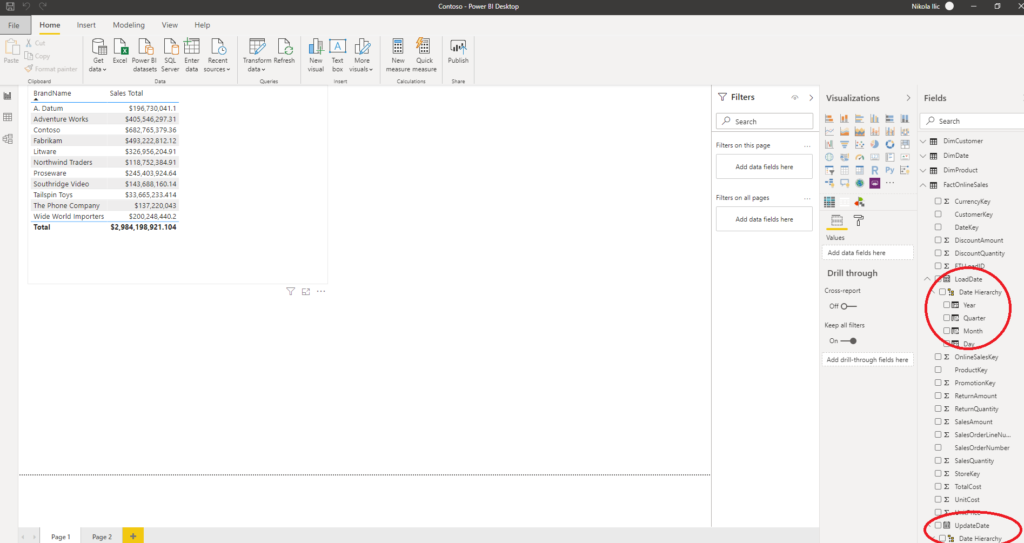
This is not bad “per se”, because Power BI prevents you from suffering in case you don’t have proper Date dimension. However, as proper Date dimension is one of the key things you need when building reports, please disable this feature, because it increases your data model size.
I’m glad to see that Power BI team finally disabled this by default.
Tip #3 Shift + Enter
It might looks straightforward and stupid to many of you, but I was regularly struggling to properly format DAX code while writing my measures. I’m using fantastic tool called DAX Studio for my Power BI development and there is a nice little thing called DAX Formatter inside.
However, when you write your measures directly in Power BI Desktop, if you hit Enter, instead of moving to a new row, you confirm your measure for evaluation.
Solution is to hit Shift+Enter and your cursor will be moved to a new row, making your DAX code formatted as it should be:)
Tip #4 Column Profiler
When I import data into Power BI Desktop, before I proceed further with data modeling and visualizations, I like to take a quick look on my data. I want to check the data quality, distribution and maybe identify some outliers in early stage of development.
Therefore, I am regularly turning on column profiling under View tab in Power Query editor.
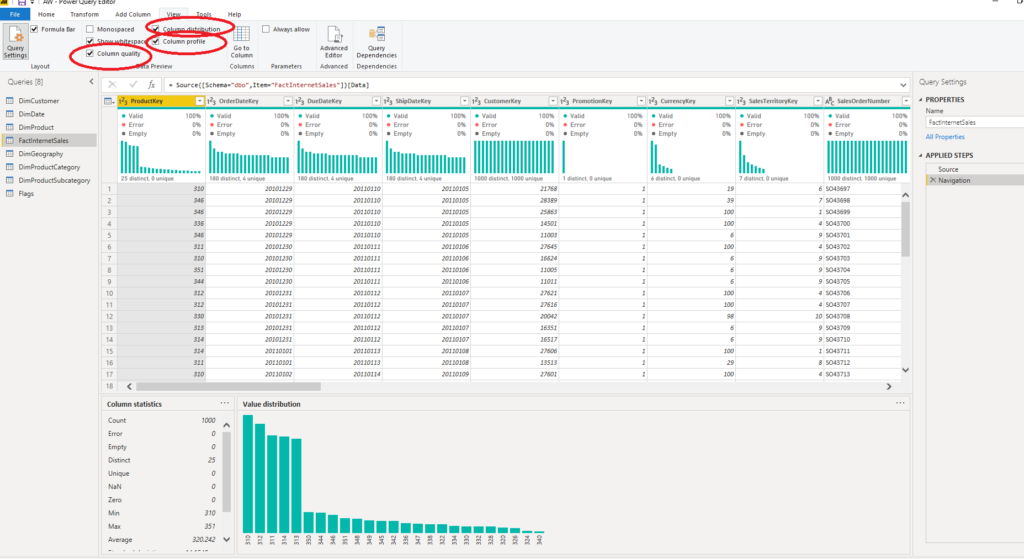
This way, I get a feeling about my data, so I can make proper decisions before going deeper.
Tip #5 Expanding Dimension Attributes
In most cases, dimensions in your data model contain all necessary attributes for understanding figures from fact table. However, in some scenarios you may want to extend dimension attributes to enable your end users with more flexibility in analysis.
Imagine following situation: in dimProduct table, we have whole bunch of different attributes, such as: Category, SubCategory, Color, etc.
But, let’s say that I want to classify my products based on their sales data. So, products with sales greater than X value will be “High”, moderate sales will mark product as “Medium” and products with sales amount less than Y value will belong to “Low” group.
Since I’ve already created my Sales Total measure in one of the previous examples, I will use this value to determine in which group should product belong.
Now, I will use Calculated column to store values of Sales Total per product. It’s just simple as:
Sales Amt Product = [Sales Total]
Based on this value, I will determine if the product belongs to High, Medium or Low group. To achieve that, SWITCH function comes in handy:
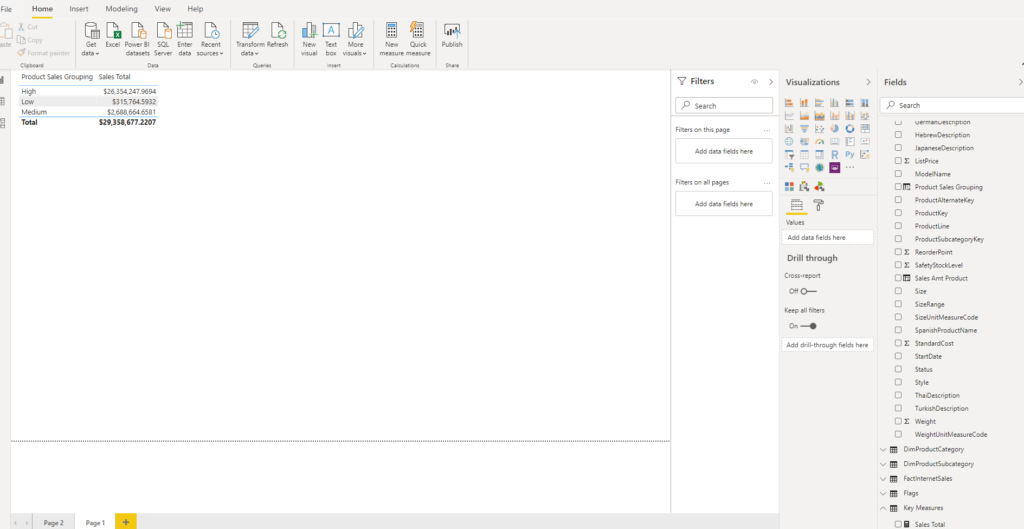
Product Sales Grouping = SWITCH(TRUE()
                                ,DimProduct[Sales Amt Product] > 100000,"High"
                                ,DimProduct[Sales Amt Product] > 20000,"Medium"
                                ,DimProduct[Sales Amt Product] <=20000,"Low"
)
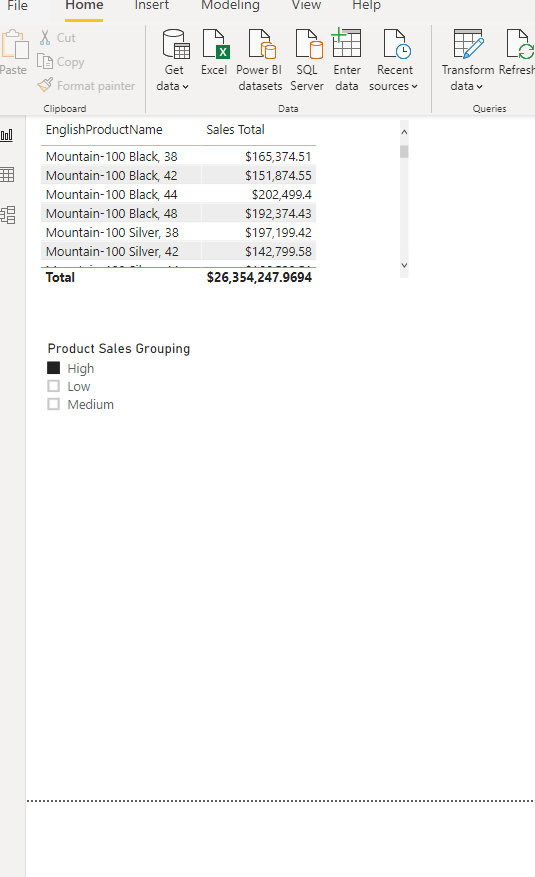
Basically, what happens here is that every single row has been evaluated and, depending on the value, classified accordingly. This way, we created brand new attribute for our products, based on their sales value. Now, we can simply use this attribute for filtering, as any other regular attribute:
We can also use our new attribute as a slicer:
Conclusion
Maybe some of these tips looks trivial and not so advanced, but I found them quite useful in day-to-day work with Power BI.
Last Updated on April 20, 2021 by Nikola


NEil Rodrigues
simple but super useful.. Thank you. this is a great blog. the synapse bit is of less use to me, the development and report building is certainly something i enjoyed reading
Nikola
That’s great to hear Neil! Cheers from Austria!
General Ledger
It seems a screenshot is missing at Based on this value, I will determine if the product belongs to High, Medium or Low group. To achieve that, SWITCH function comes in handy:
Nikola
Oh, good catch! Thanks! It’s been fixed now:)