Just recently, while presenting my session: “Magnificent 7 – Simple tricks to boost your Power BI Development” at New Stars of Data conference, one of the questions I’ve received was:
Is there a way to show the actual active filters as a result of the slicer choices on the page?
I’ve already answered the question in this article, but then I thought: maybe more people search for the solution to this problem, so I decided to write a short post to explain in detail how you can achieve this.
As usual, I will use sample Contoso database for demo purposes:
DAX is your friend!
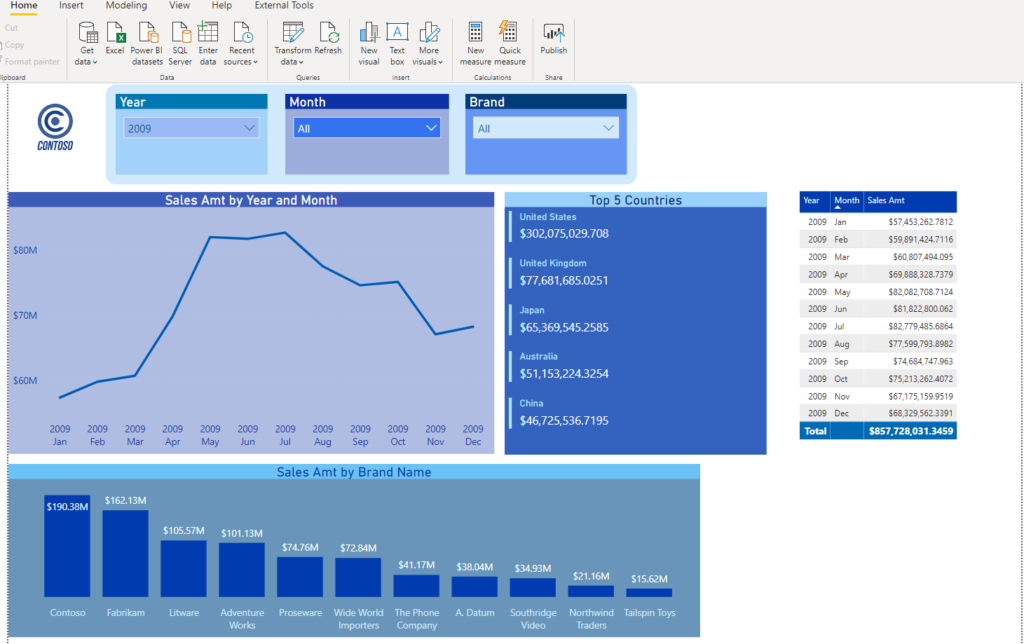
This is the starting point. You can notice three slicers on the report canvas, and let’s say that I want to show my users which brands are selected within Brands slicer.
The first step is to create a DAX measure that will capture all selected values in the slicer. You can use two different DAX functions to obtain the values: VALUES() or DISTINCT(). VALUES() function is more complex since you can use both table name and column name as an argument, but let’s focus here on the column name as an argument.
Basically, VALUES() will return all distinct values from the column we passed, including blanks (if exist)! On the other hand, DISTINCT() will return all distinct values but ignoring blank values. Which one you want to use, depends mostly on the business request (if your users want to see numbers for blanks or not). Personally, I prefer to use VALUES(), because it gives me the full picture.
So, I will create a following measure:
Selected Brands = VALUES('Product'[BrandName])
Now, when I put this measure in the Card visual, let’s see what happens:
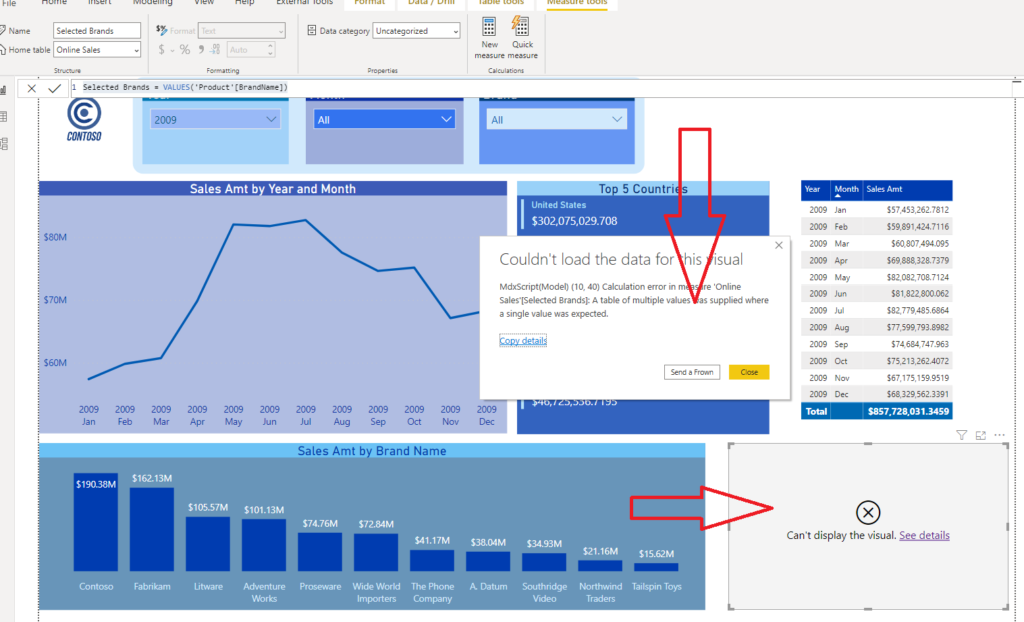
Oops, that gives me an error! Error message explains that the calculation expects a single value. The problem is that VALUES() and DISTINCT() return TABLE! However, it’s not a “normal” table, it’s virtual table created on the fly by DAX engine, so we should apply some additional calculations in order to extract single values from it.
Iterator functions to the rescue!
Iterator functions do what their name says – they iterate over the table and apply the calculation row by row! Iterator functions have X in the end: SUMX, AVERAGEX, COUNTX…In our scenario, we need to iterate over our distinct values and concatenate them into our string, which will be later displayed in the report. To achieve that, we will use CONCATENATEX() function.
This function accepts three arguments: the first is a table that we want to iterate on (in our case, a virtual table created using VALUES() function), then expression we are applying row by row on this table, and finally delimiter we want to use for separating extracted values.
Selected Brands = CONCATENATEX(
                            VALUES('Product'[BrandName]),
                            'Product'[BrandName],
                            ",")
In my example, I’m using comma as a delimiter, but you can also use others, such as a semicolon, etc. Now, when I look again in my report, I can see that I got desired results:
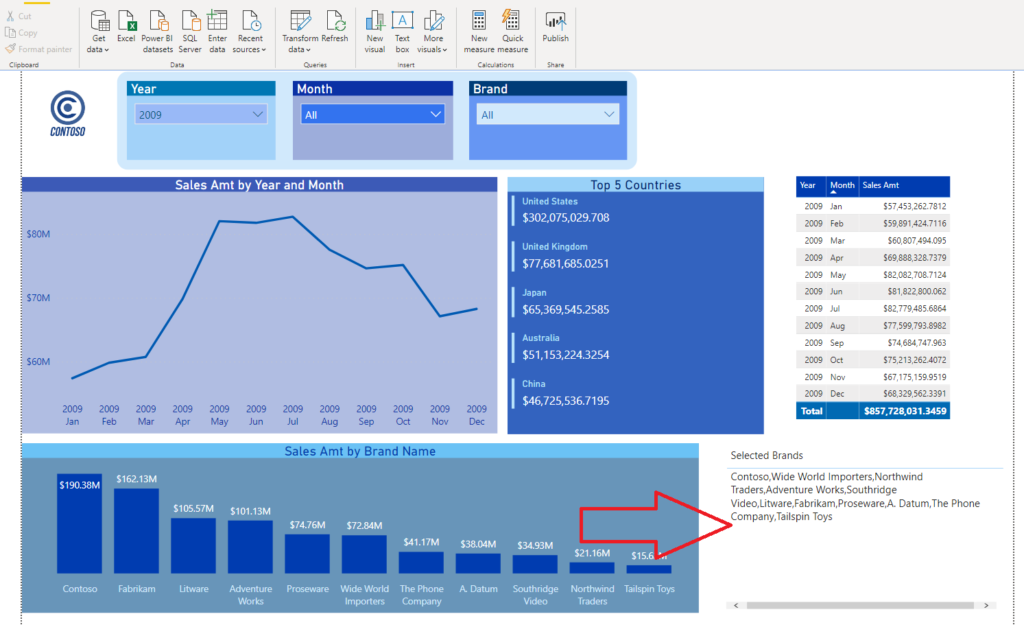
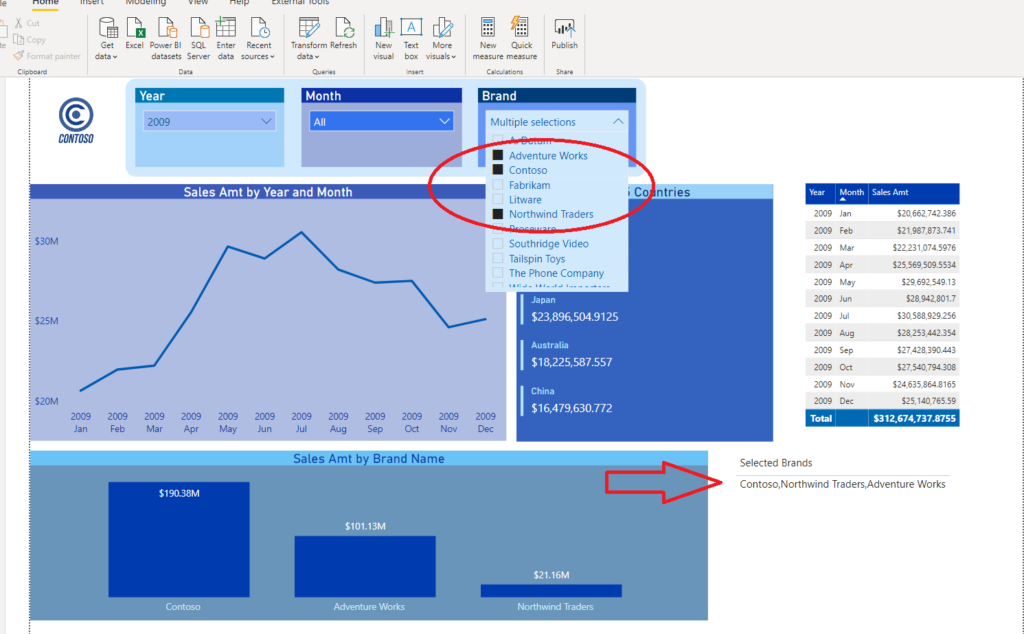
And, if I choose only a few brands within the slicer, my visual will adjust to reflect the changes:
Combining multiple measures
You can create the same measure for other slicers also, and then put all the results in the table visual. So, I will create the measure for Year slicer:
Selected Year = CONCATENATEX(
                            VALUES(Dates[Year])
                            ,Dates[Year]
                            ,",")
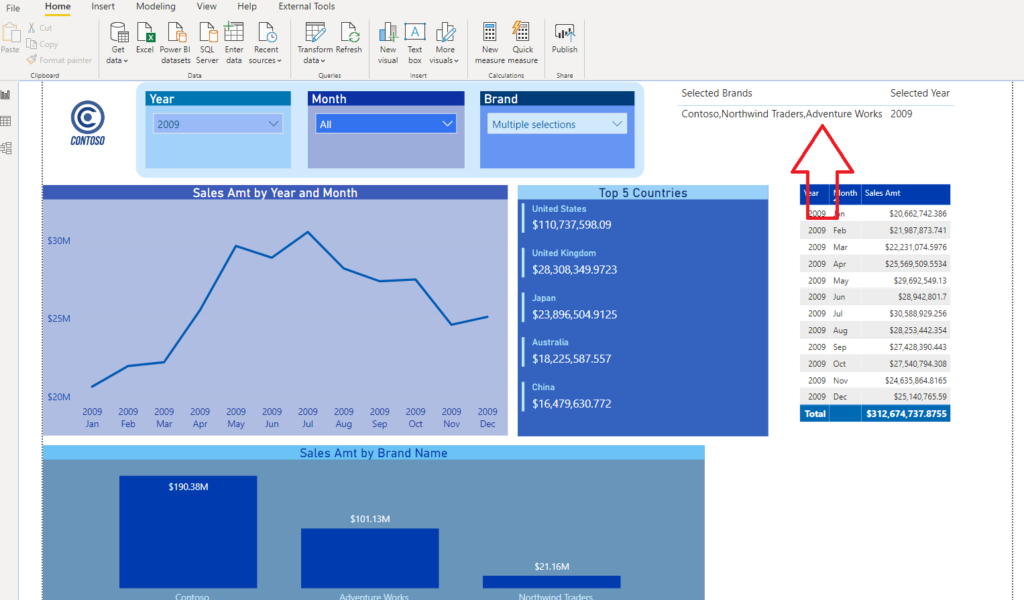
Now, when I drag both my measures into the table fields, I see both of my selected slicers’ values at one place:
Bonus idea!
If you have many slicers in your report, and you want to display all of the selections, but you don’t want to waste a space on your report canvas, you can create a bookmark containing the table with all selected values, and then just display the bookmark on user’s request.
Something like this:
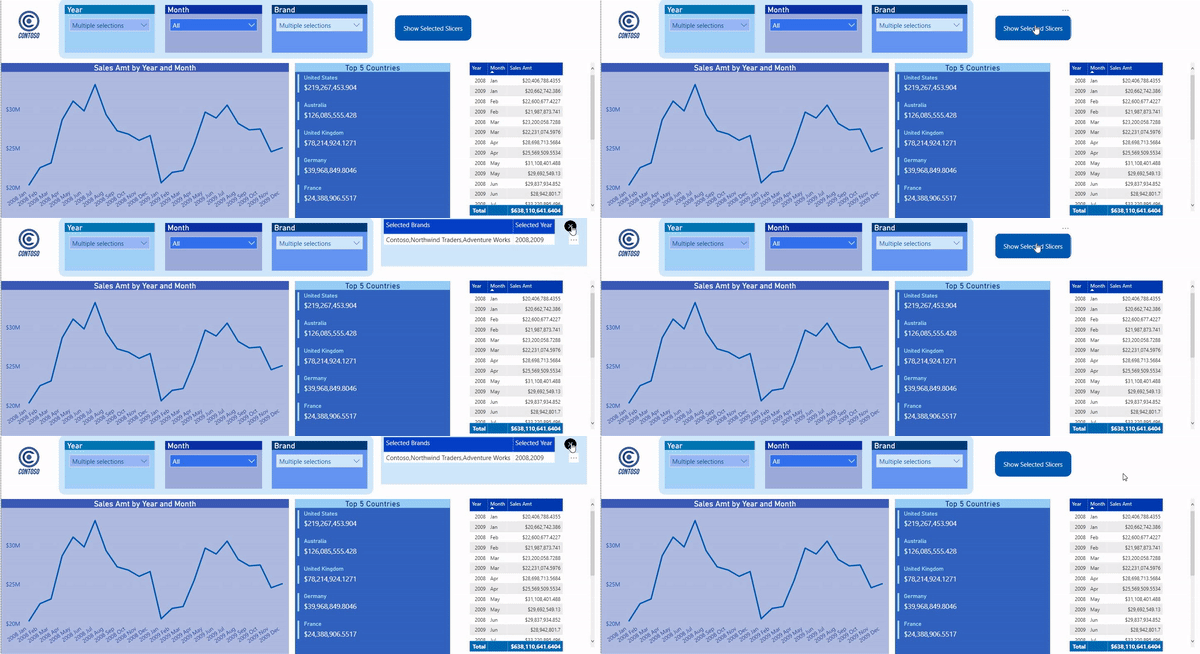
How cool is that! So, you don’t need to worry about bloating your report space with this table. You can show/hide it using bookmarks and actions.
Last Updated on September 3, 2020 by Nikola


John K
Nice tip. Now to push for more.
How can you have CONCATENATE X to substitute “and” for the last comma? Instead on getting “Apples, Bananas, Pears”, you get “Apples, Bananas and Pears”.
Consultant Power BI
You have to use SUBSTITUTE with the last parameters, [InstanceNumber] being equal to DISTINCTCOUNT of the given column minus 1 (this means the last position in the serie). This is an example :
Selected Brands = SUBSTITUTE( [YOUR_CONCATENATE_FORMULA], “,” , ” and”, DISTINCTCOUNT(‘Product'[BrandName]) – 1 )